
Market Minds Advisory
Wiper Blade Market

Wiper Blade Market: Nine Months Recommended, Twenty Six Months Actual

Manufacturers recommend replacement at nine months and drivers wait around twenty six, and nobody in this industry has ever managed to move that number at all in four decades of trying.

Lead Analyst

Published

September 2026

Make Smarter Decisions with Customized Research Insights

Request a free sample report and evaluate market opportunities, growth trends, and competitive dynamics relevant to your business needs.

2025 MARKET VALUE$4.6BMarket Size 2025
2036 FORECAST VALUE$7.4BBase Case , 2026 to 2036
CAGR 2026 TO 20364.4 %Bull 5.6% / Bear 3.2%
INCREMENTAL OPPORTUNITY$2.6BNet 10- year value creation
EXPANSION MULTIPLE1.54x2036 value over 2026 base
Strategic Levers
M&A Pipeline
Regional Outlook
Country Rankings
Competitive Intelligence
Segmental Deep-dive
Call-Us : 91 93563 13602

Executive Snapshot and Market Trajectory

The defining number in this market is a gap nobody has closed. Manufacturers recommend replacement at around nine months and drivers actually replace at about twenty six, waiting until noise or streaking becomes intolerable rather than when performance degrades. Closing that gap is worth more than any product improvement attempted.
Fitment complexity has quietly dismantled the retail model that used to serve this market. More than forty distinct arm connector variants now exist against a handful in the nineteen nineties, which ended the idea that one blade fits most cars and pushed purchasing toward catalogue lookup, online listing and workshops. Beam blades grow fastest at 6.6%, half again the market rate. Data now decides the sale.
The functional argument has also changed underneath the category. A camera behind the windscreen cannot see through a smeared arc, so streaking is now a sensing failure rather than a visibility annoyance. Around 84% of new assembly specifies beam designs, which the aftermarket follows years later. East Asia holds 30% and India grows fastest at 7.8%. Most aftermarket ranges are still weighted toward the designs now leaving the parc entirely. Stocking follows yesterday.
Market Definition
Windscreen and rear wiper blades supplied for original equipment fitment and aftermarket replacement, covering conventional bracket blades, beam blades, hybrid blades, rear wiper blades, refill elements, and heated or specialty blades. Measured at manufacturer selling value. Wiper arms, motors, linkages and mechanisms, washer pumps, reservoirs and fluids, and windscreen treatment products are excluded from scope.
Base Year Value
$4.6B in 2025 (MMA Primary Research Dataset, August 2026)
Forecast Period
2026 to 2036, eleven discrete annual values
CAGR
4.4% base case. Bull 5.6%. Bear 3.2%.
Fastest Growth Segment
Beam Blades: 6.6% CAGR
Fastest Growth Country
India: 7.8% CAGR
Fastest Growth Region
South Asia and Pacific: 6.6% CAGR
Largest Region
East Asia: 30% of 2025 global value
Market Leaders
Bosch, Valeo, Denso, Trico Products, Tenneco. Source: MMA Primary Research Dataset, July 2026.
Primary Survey
n=3,800 procurement and R&D decision-makers, Q4 2025, six countries
Methodology
Demand-side build-up, cross-validated against public data, 47 expert interviews

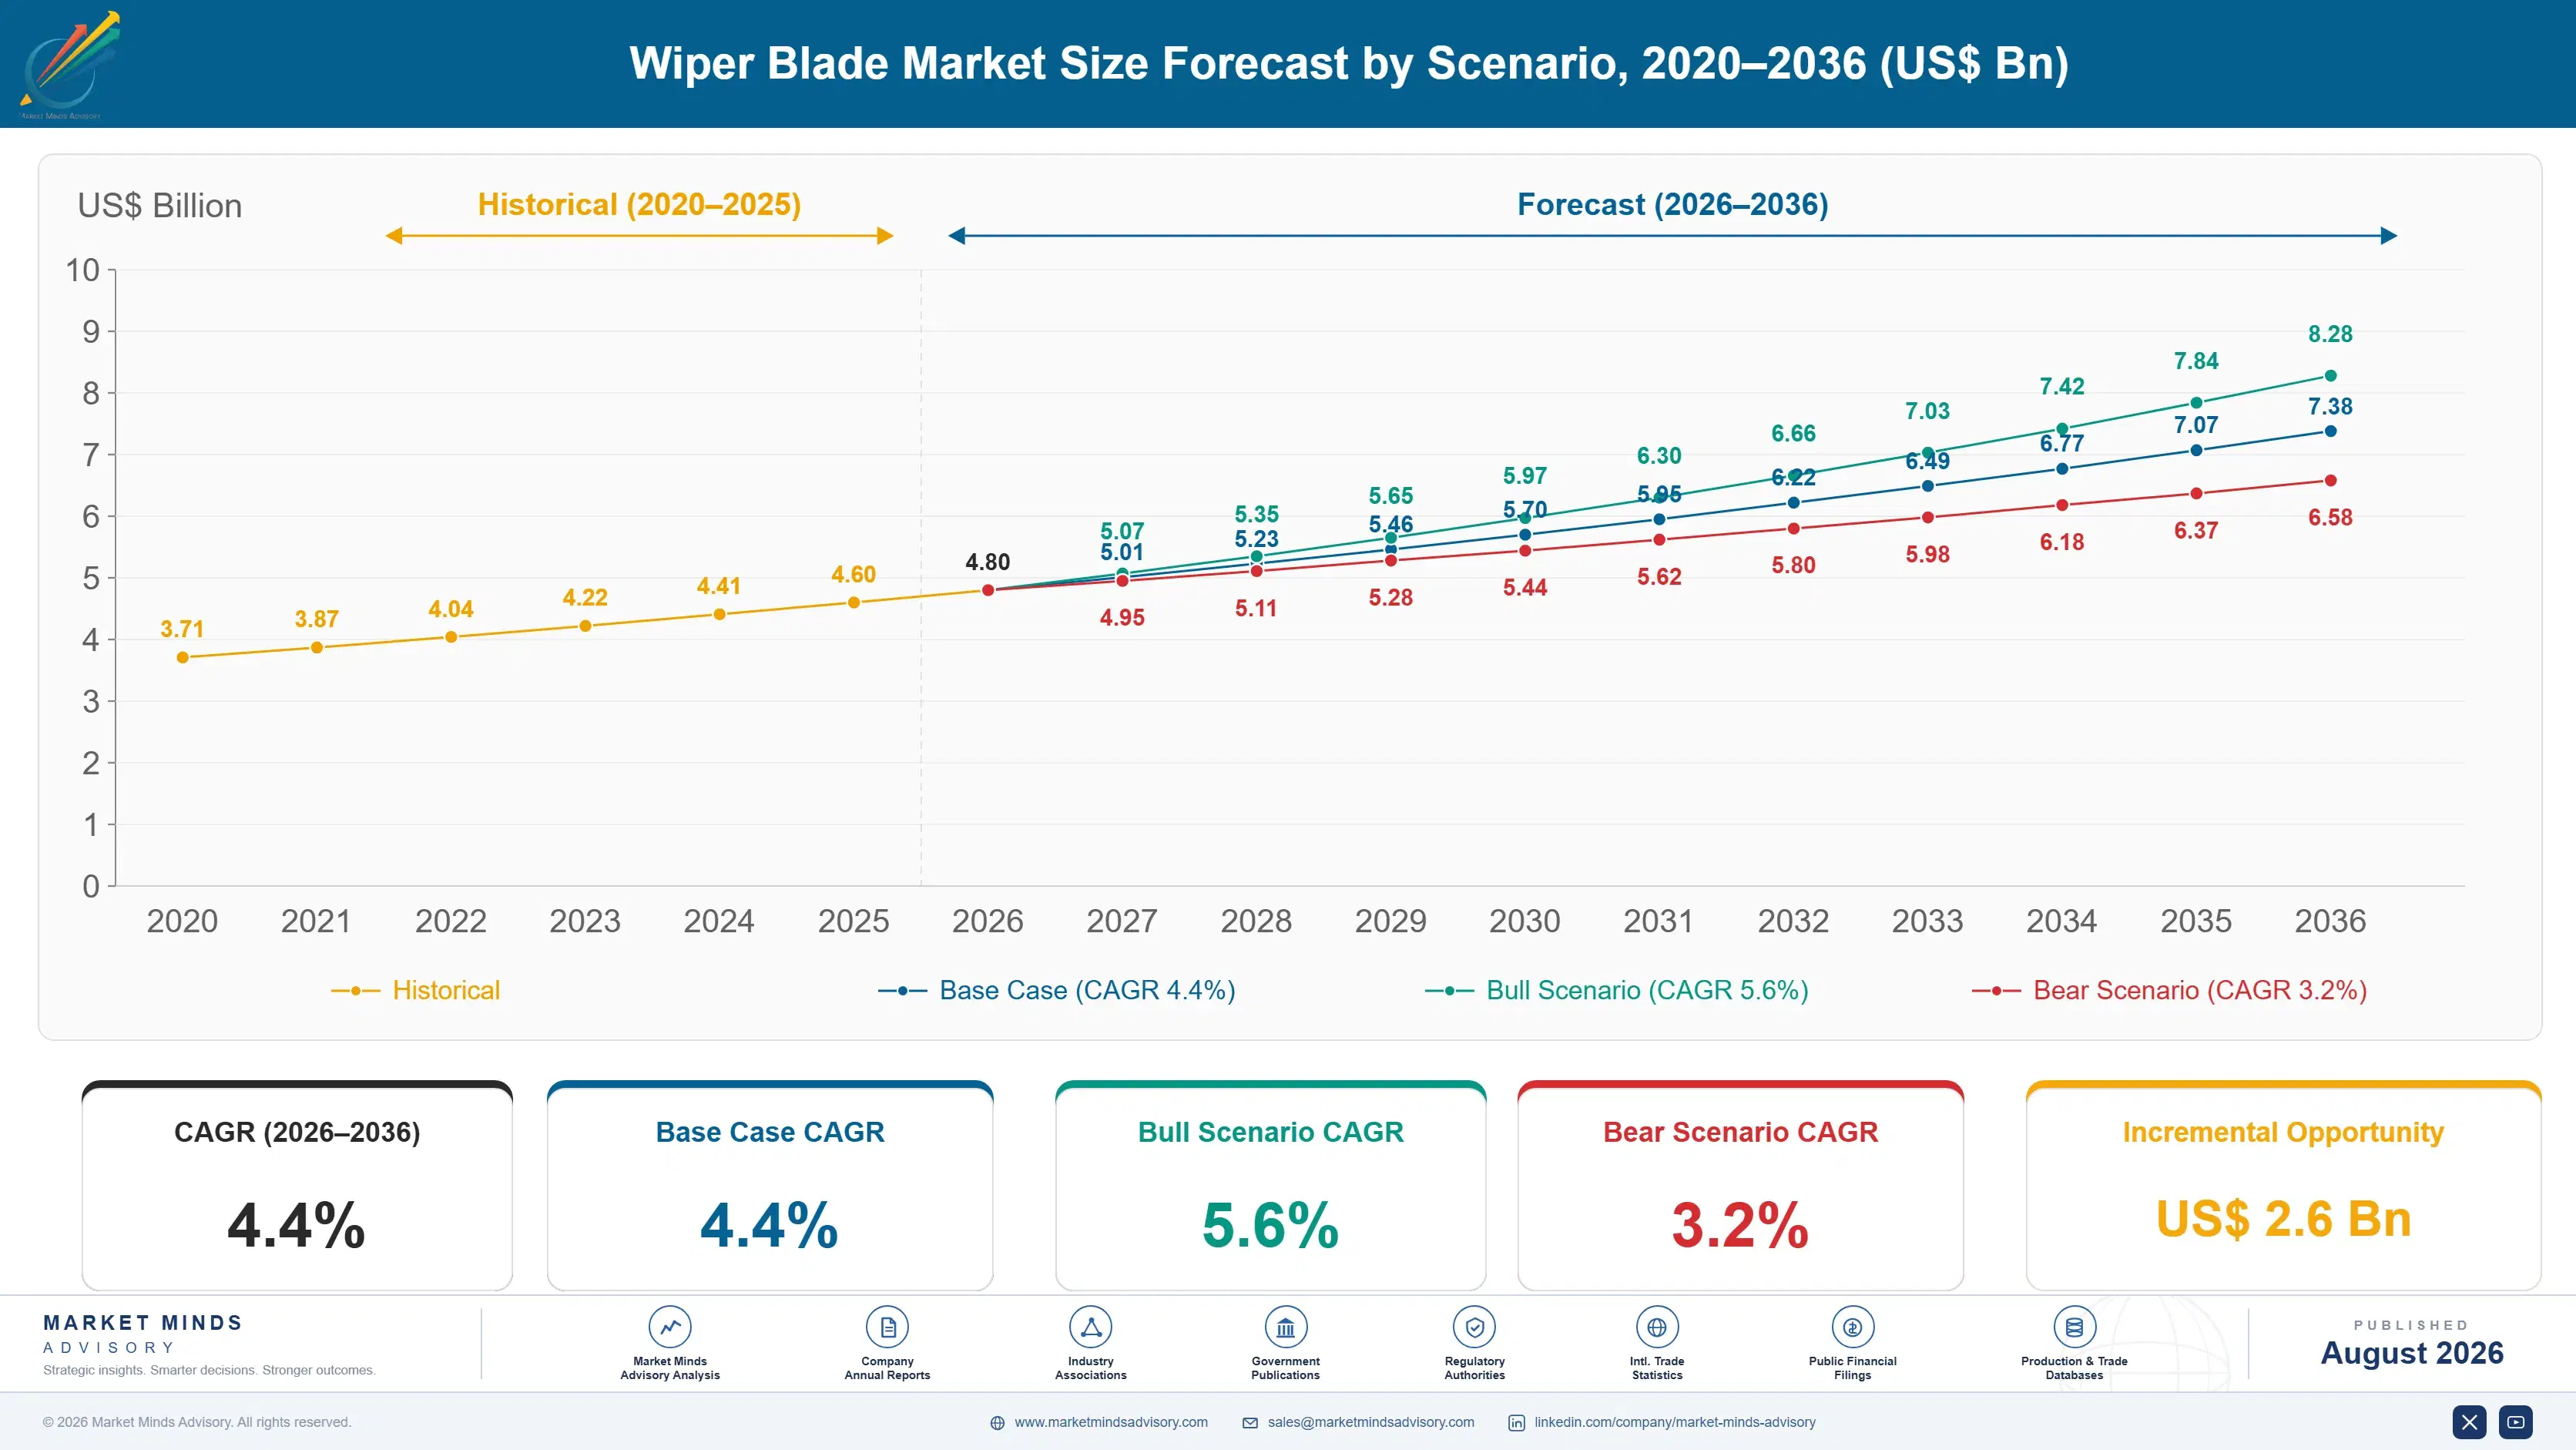
Wiper Blade Market Forecast Scenarios

wiper-blade-industry-analysis-key-insight-size-forecast-scenario-1787665121361
The five years to 2025 saw the product change faster than the buying behaviour behind it. Beam blades took nearly all new vehicle fitment while the aftermarket continued selling conventional designs into an ageing parc, and online retail took share from physical shelves that fitment complexity had made increasingly difficult to merchandise. The 3.6% historical rate reflects mix improvement more than any change in replacement frequency.
The 4.4% base case rests on three mechanisms. Beam blades grow at 6.6% as the aftermarket follows original equipment fitment with a lag of several years. Driver assistance makes wiping quality a sensing requirement rather than a comfort one, which supports premium positioning. And Indian vehicle parc growth runs at 7.8%, faster than any market covered, with replacement demand following assembly volumes into service. Fitment lag, sensing and geography together.
The 5.6% bull case turns on driver assistance systems flagging degraded wiping directly to the driver, which would replace a subjective judgement about streaking with a dashboard message and could move the replacement interval materially. The 3.2% bear case is the parc itself: this market tracks vehicles in service and miles driven, and any sustained decline in either flows through within a year.

The Gap Nobody Has Closed

Everything commercially interesting in this category sits between two numbers. Manufacturers recommend replacement at around nine months, and drivers replace at roughly twenty six, because nobody buys a wiper blade until the existing one becomes annoying. Nearly tripling replacement frequency would transform this market, and decades of advertising, dealer prompts and service reminders have moved that interval almost not at all.
TOP FIVE CONCENTRATION46%Combined unit shipments held by the leading manufacturers
RECOMMENDED REPLACEMENT INTERVAL9 monthsManufacturer guidance issued before wiping performance degrades noticeably
ACTUAL REPLACEMENT INTERVAL26 monthsTypical period consumers wait before buying a replacement
ARM CONNECTOR VARIANTS40+Distinct fittings a full aftermarket range must cover
BEAM FITMENT SHARE84%New vehicle assembly now specifying flat blade designs
CAMERA OBSTRUCTION THRESHOLD3 mmStreak width sufficient to degrade forward sensing performance
Fitment complexity then broke the retail model that used to reach those drivers. There were a handful of arm connector types in the nineteen nineties and there are more than forty now, which killed the notion that one blade fits most cars and made a physical shelf almost impossible to merchandise sensibly. Purchasing moved toward catalogue lookup, online listings and workshops, all of which favour whoever controls the fitment data.
The functional case for good blades has strengthened in a way the industry has not fully exploited. A forward facing camera behind the windscreen cannot see through a smeared arc, and streaking wide enough to matter is measured in millimetres rather than in driver irritation. That turns wiping quality into a sensing requirement, which is a considerably stronger argument than visibility comfort has ever been.
"This industry has spent forty years trying to persuade drivers to replace blades on schedule and has achieved essentially nothing. The camera behind the windscreen may do it for them without anybody being persuaded of anything."
Director, Automotive Aftermarket and Components Practice · MMA Automotive Components and Aftermarket Practice · August 2026

Market Trends

Fitment Complexity Moves Purchasing Away From Physical Shelves

More than forty distinct arm connector variants now exist against a handful three decades ago, which makes a comprehensive physical range almost impossible to stock and merchandise in a retail aisle. Drivers who once picked a blade by length now need a vehicle lookup, and that requirement pushes purchasing toward online listings, catalogue systems and workshops that hold the data. Whoever controls accurate fitment data increasingly controls the transaction, regardless of who manufactured the blade or what it costs at retail. Merchandising a category nobody can select from is the underlying problem.
Market Impact: India grows at 7.8% annually
Sensing Requirements Replace Comfort As The Quality Argument

A forward facing camera behind the windscreen cannot interpret a scene through a smeared arc, and streaking wide enough to degrade sensing is measured in millimetres rather than in how much it irritates a driver. That converts wiping quality from a comfort preference into a functional requirement affecting systems the vehicle depends on. Premium blade positioning has never had a stronger argument available to it. Very few manufacturers currently present it that way, still selling on streak free glass and quiet operation instead. That argument has never been available before now.
Market Impact: Beam covers 84% of new fitment

Market Opportunities and Growth Drivers

Indian Vehicle Parc Expansion Follows Assembly Into Service

Indian vehicle assembly has grown for years and the vehicles built are now entering the replacement cycle in volume, which makes India grow at 7.8%, faster than any market covered. Aftermarket demand lags assembly by several years in any market and India is currently at the point where that lag delivers. Domestic manufacturers compete strongly on price while international brands hold premium positions and original equipment fitment. Conventional blade designs remain more relevant here than in mature markets, because the parc is younger in specification terms. Timing rather than promotion produced this.
Market Impact: Actual interval runs 26 months

Beam Fitment On New Vehicles Pulls Aftermarket Mix Upward

Around 84% of new vehicle assembly now specifies beam blades, chosen for aerodynamic stability at speed, even pressure distribution across increasingly curved windscreens and the absence of a frame that collects ice. The aftermarket follows that fitment with a lag of several years as those vehicles reach first replacement, which is why beam blades grow at 6.6% against a market rate of 4.4%. The lag is predictable and most aftermarket ranges are still weighted toward the designs leaving the parc. Stocking against yesterday's fitment is the most common error in this category.
Market Impact: Range covers over 40 variants

Market Restraints and Challenges

Replacement Behaviour Has Resisted Every Attempt To Change It

Drivers replace blades at roughly twenty six months against manufacturer guidance of about nine, because the failure signal is gradual, subjective and easy to tolerate for another few weeks each time. The root cause is that degradation is continuous rather than sudden, so no moment ever demands action. Commercially this holds unit volumes at a fraction of what the installed parc could support. Participants have tried advertising, service reminders and colour changing indicators, none of which has shifted the interval measurably. Roughly three times current volume sits unclaimed inside the existing parc.
Market Impact: Over 40 connector variants now exist

Range Complexity Raises Working Capital Across The Channel

Covering more than forty connector variants across multiple lengths and blade types produces a stock keeping unit count that distributors and retailers struggle to carry economically. The root cause is that vehicle manufacturers specify arm connections without any standardisation pressure and have no reason to converge. Commercially this raises working capital, obsolescence risk and lost sales from stockouts across the whole channel. Participants respond with multi-fit adaptor systems, which reduce the count while adding cost and fitting complexity for the consumer. Nobody in the vehicle industry has any reason to standardise this.
Market Impact: Streaks above 3 mm degrade sensing
3 additional market trends, 4 additional growth drivers, and 2 additional restraints and challenges are covered in the full report. Contact sales@marketmindsadvisory.com to access the complete intelligence.

Segment CAGR and Growth Architecture

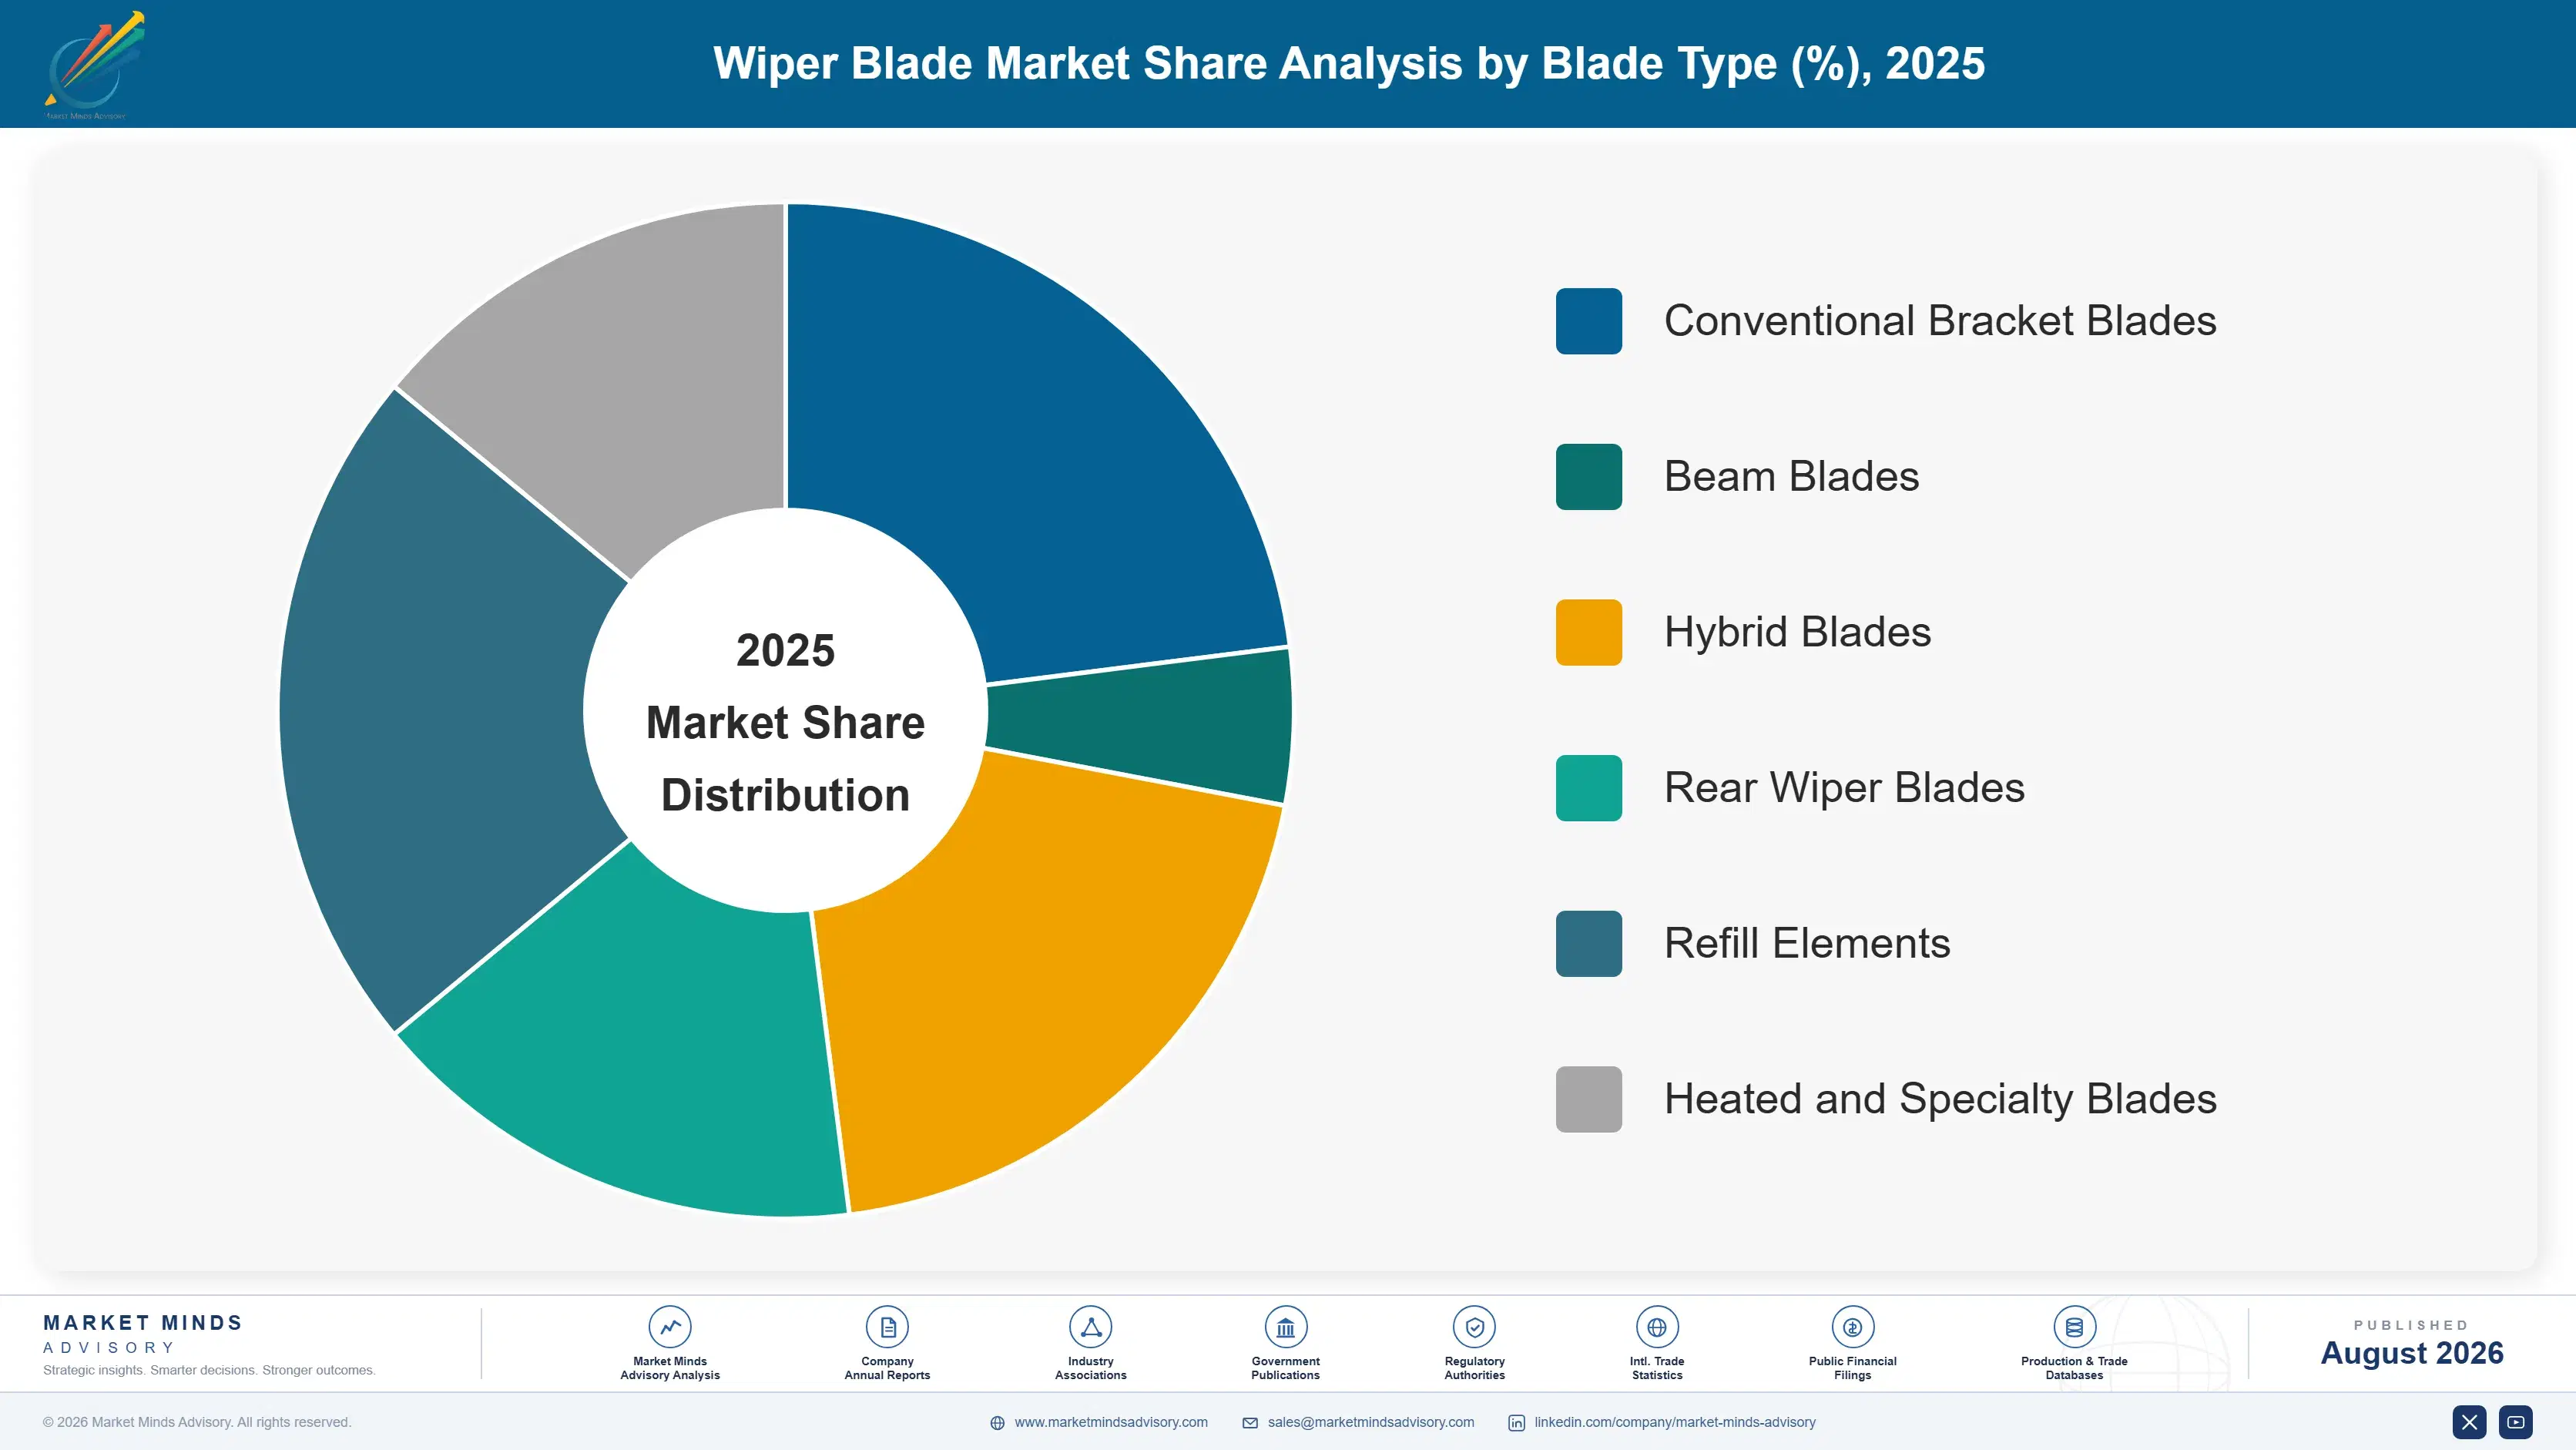
Segmentation follows blade type, since type determines fitment compatibility, wiping behaviour on curved glass, price position and which channel sells it. Six types cover the category across original equipment and aftermarket supply. Growth tracks what vehicle manufacturers fitted several years ago rather than what any aftermarket brand is currently promoting. Fitment lag governs the mix.
wiper-blade-industry-analysis-key-insight-market-share-analysis-1787665121896

Beam Blades

Frameless flat blades using an integrated tensioned spine to distribute pressure evenly across curved glass, now fitted on around 84% of new vehicle assembly. At 6.6% this is the fastest growing type, half again the market rate of 4.4%, and original equipment fitment rather than aftermarket promotion explains it entirely. Vehicles built with beam blades reach first replacement several years later, which makes aftermarket growth here predictable from assembly data nobody needs to forecast. Aerodynamic stability at speed and the absence of a frame that collects ice are why manufacturers specified them originally. Aftermarket ranges weighted toward conventional designs are stocking for a parc that keeps shrinking underneath them every year.
CAGR 6.6%

Hybrid Blades

Designs combining a beam style spine with an aerodynamic shell, offering beam performance in a form that suits vehicles and arm geometries where a pure beam does not fit or does not look right. Growth of 5.8% is second fastest in the category, driven largely by aftermarket positioning between conventional and beam price points. This is where much of the premium aftermarket margin sits, since consumers upgrading from a conventional blade find the hybrid an easier decision than a full beam replacement. Fitment compatibility is broader, which reduces range complexity for the channel. The upgrade feels smaller to a consumer, which is a positioning advantage rather than a technical one.
CAGR 5.8%
Full segment breakdown across 6 segments available in the complete report.

Regional Architecture and Country Demand Map

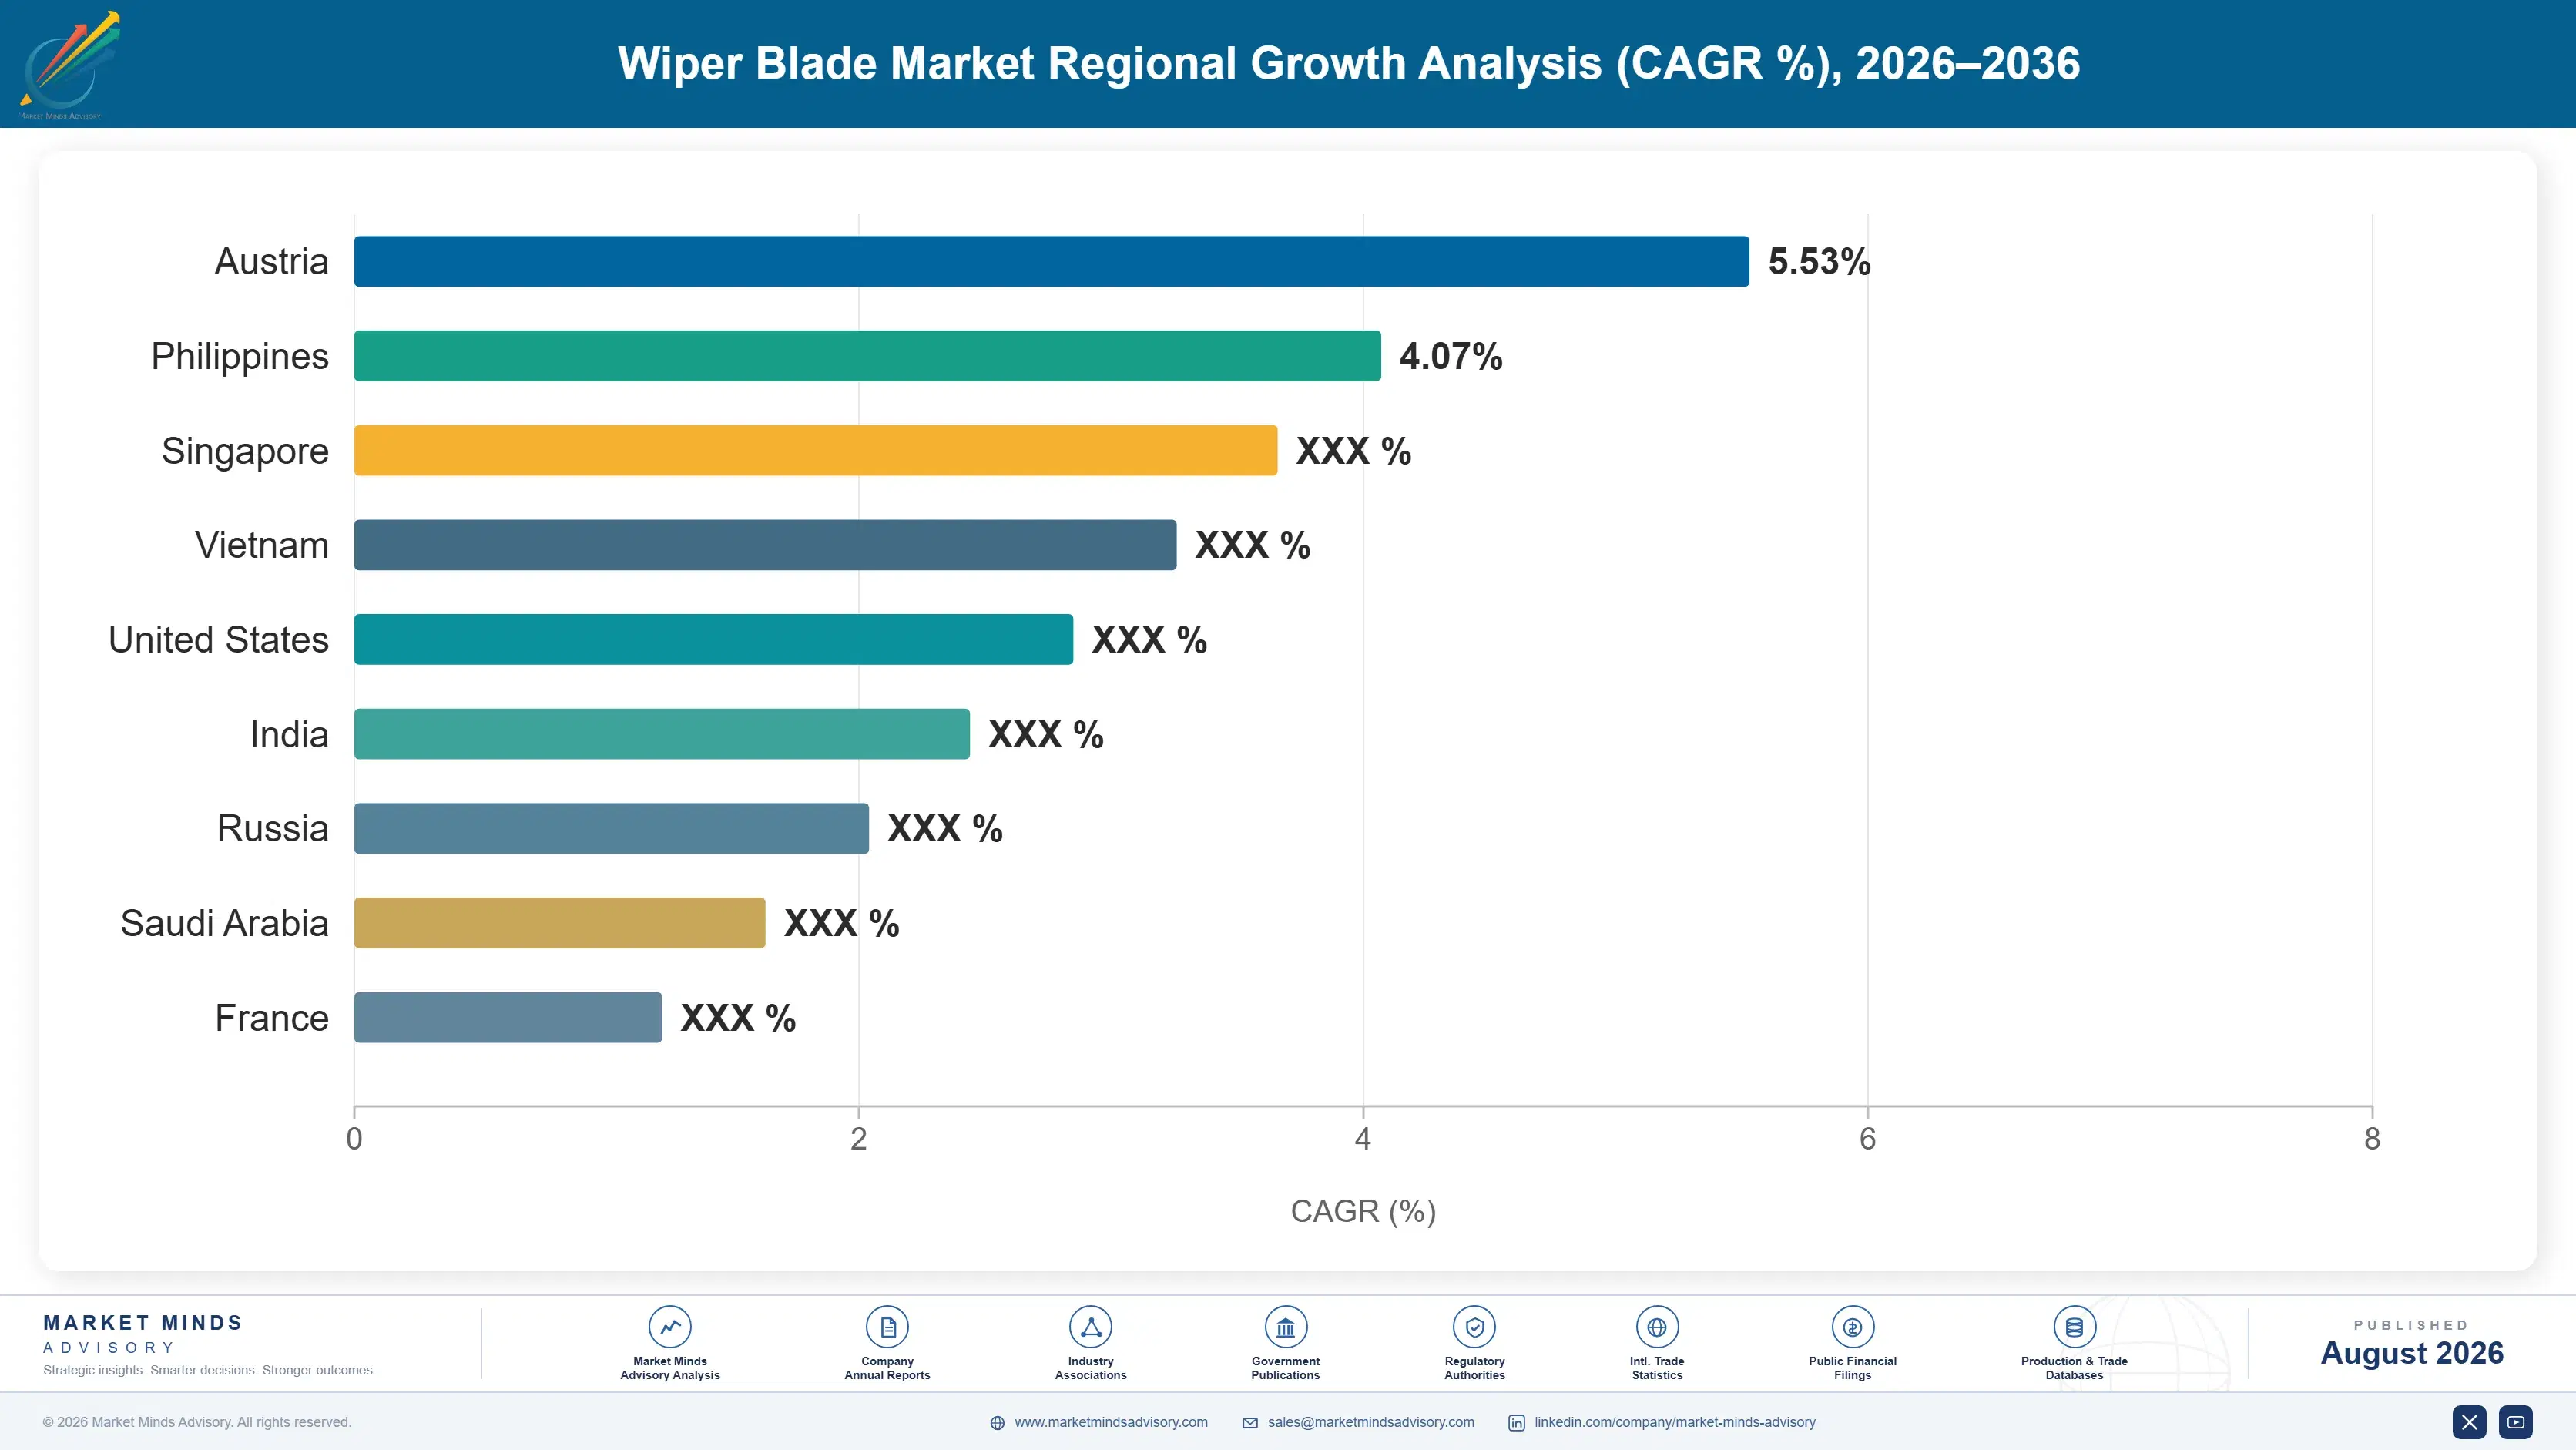
East Asia holds 30% on the largest vehicle parc and assembly base in the world, with most global blade manufacturing capacity located there. North America follows at 26% and Western Europe at 20%. India grows fastest at 7.8%. Parc size and miles driven set these shares.

North America

Miles driven rather than parc size carries this 26% share, since American vehicles cover considerably more distance annually than European ones and wiper wear tracks use as much as age. Retail purchasing through parts chains remains stronger here than in most regions, though fitment complexity has pushed a growing share online where lookup is straightforward. Premium blade positioning works better in this market than almost anywhere, with consumers willing to pay for named brands. Growth of 3.4% reflects mix improvement toward beam and hybrid designs rather than any change in replacement frequency. Use rather than fleet size is what makes this the second largest position here. Brand still works in this market.
Share: 26% | CAGR: 3.4% (2026 to 2036)

Western Europe

A 20% share reflects a large parc driven fewer miles per vehicle than in North America, with replacement frequency correspondingly lower. Workshop fitting during routine service is more common here, which means a substantial share of blades are specified by a technician rather than chosen by a driver at a shelf. That channel favours suppliers with strong workshop distribution and accurate fitment data. Original equipment fitment converted to beam designs earlier here than in most markets. Growth of 2.8% is the lowest of the seven regions and reflects a mature parc and modest annual mileage. Technician specification rather than consumer choice governs a growing share of this replacement volume. Data reaches those channels.
Share: 20% | CAGR: 2.8% (2026 to 2036)
Regional intelligence for 5 additional markets available in the complete report: East Asia, South Asia and Pacific, Latin America, Middle East and Africa, Eastern Europe. Contact sales@marketmindsadvisory.com.
wiper-blade-industry-analysis-key-insight-country-cagr-analysis-1787665122438

Where This Category Actually Earns

Nothing here is won on rubber compound, because every credible blade wipes acceptably when new and consumers cannot evaluate durability at purchase. Value accrues to whoever moves the replacement interval, whoever owns fitment data, whoever sells sensing performance, and whoever anticipates the aftermarket lag. Four routes carry weight and none is a materials argument.

Close The Gap Between Nine And Twenty Six

Manufacturers recommend replacement at around 9 months and drivers replace at roughly 26, which means the installed parc could support nearly three times current unit volume without a single additional vehicle. Advertising, service reminders and colour changing indicators have all failed to move it, because degradation is gradual and no moment ever demands action. Any mechanism that produces a definite signal rather than a subjective judgement is worth more than every product improvement this category has made combined. Roughly 3 times the current unit volume is sitting inside a parc that already exists.
Market Impact: The gap runs 9 months against 26 actual

Own The Connector Lookup Not The Shelf

More than 40 arm connector variants now exist against a handful three decades ago, which makes a physical retail range nearly impossible to merchandise and pushes purchasing toward lookup driven channels. Whoever holds accurate, complete fitment data increasingly controls the transaction regardless of who made the blade. That data is unglamorous to maintain and expensive to keep current across new model introductions, which is exactly why holding it well is defensible against competitors who treat it as an afterthought. Over 40 connector variants is a data problem before it is a product problem.
Market Impact: Accurate data must cover over 40 connector variants

Sell Sensor Performance Rather Than Driver Visibility

A forward facing camera cannot interpret a scene through a smeared arc, and streaking wide enough to degrade sensing is measured in millimetres rather than in driver irritation. That converts wiping quality from comfort into a functional requirement supporting systems the vehicle actively depends on, which is the strongest premium argument this category has ever had available. Most manufacturers still sell streak free glass and quiet operation, which is the argument that failed to move replacement behaviour for four decades. Streaking above roughly 3 mm degrades forward sensing, which is a measurable threshold rather than an opinion.
Market Impact: Streaks over 3 mm measurably affect sensing performance

Follow Beam Fitment Into The Aftermarket Lag

Around 84% of new vehicle assembly specifies beam blades, and those vehicles reach first replacement several years later, which makes aftermarket beam demand predictable from assembly data that already exists. Beam blades grow at 6.6% against a market rate of 4.4% on exactly that mechanism. Most aftermarket ranges remain weighted toward conventional designs fitted to vehicles now leaving the parc, which is a stocking decision made against yesterday's fitment rather than tomorrow's. Assembly data already published several years ago tells any supplier exactly what the aftermarket will need over the next few seasons.
Market Impact: Beam already holds 84% of all new fitment

Who Controls the Margin Pool

Concentration is moderate and splits between original equipment and aftermarket dynamics. The top five hold 46% of unit shipments, the basis applied consistently throughout this section, with original equipment supply concentrated among a few systems suppliers while the aftermarket carries brands, private label programmes and Chinese manufacturers competing on price. Bosch leads on combined original equipment and aftermarket presence, and the gap reflects brand recognition at retail as much as manufacturing position.
Competition runs on three fronts. Systems suppliers compete for original equipment fitment alongside arms and motors, which is decided at platform level and holds for a model generation. Branded aftermarket suppliers compete for retail shelf, workshop preference and online listing quality. And private label and Chinese manufacturers compete on cost for the price led majority of replacement volume.

Rankings will move with fitment data quality and online listing performance rather than with product development, since a consumer looking up a blade sees whoever appears first and correctly. The other pressure point is sensing requirements, which could create a genuine premium tier where none has really existed and would advantage whoever established the argument before it became obvious.
wiper-blade-industry-analysis-key-insight-company-positioning-matrix-1787665122962

Competitive Moat and Risk Dimensions

BOSCH

Moat: Brand Recognition At Retail

Consumer brand recognition in a category where buyers cannot evaluate performance before purchase provides pricing power that manufacturing quality alone would never generate. Combined with original equipment fitment across many platforms, that recognition supports both the premium aftermarket position and the credibility that workshop recommendation depends on.
BOSCH

Risk: Price Led Volume Erosion

The majority of replacement volume is bought on price by consumers who consider a blade a commodity, and Chinese manufacturers supply that demand at costs branded suppliers cannot match. Online marketplaces make price comparison immediate in a way physical retail never did, which erodes the brand premium at exactly the point of purchase.
VALEO

Moat: Complete Wiper System Supply

Supplying arms, motors, linkages and blades as an integrated system wins original equipment fitment at platform level rather than component by component, which a blade only manufacturer cannot contest. That position also provides the fitment engineering knowledge that accurate aftermarket data depends on across every model supplied.
VALEO

Risk: Aftermarket Channel Weakness

Original equipment strength does not automatically translate into retail shelf presence or online listing performance, where consumer brand recognition and fitment data quality decide the transaction instead. The aftermarket is the larger and more profitable half of this category, and it rewards commercial capabilities that platform supply relationships do not develop.

Players Tracked

Prominent Players

Bosch
Valeo
Denso
Trico Products
Tenneco

Other Key Players

HELLA
Mitsuba
Illinois Tool Works
Michelin
Hyundai Mobis
KCW Corporation
CAP Corporation
Doga
Pylon Manufacturing
Champion
Nippon Wiper Blade
Guangzhou Aiwei Auto Parts
Danyang Ruiying
Metzger
Corteco

Recent Developments

FEBRUARY 2025

Vehicle system flags degraded wiping through driver display

A vehicle manufacturer introduced a system flagging degraded wiping performance to the driver through the instrument display, using camera image quality rather than elapsed time. Drivers currently replace blades at roughly twenty six months against manufacturer guidance of about nine months, entirely on subjective judgement.
Signal: A dashboard message replaces the judgement call that has never once moved this interval for four whole decades
JUNE 2025

Retailer replaces shelf range with in-store lookup terminals

A parts retailer replaced much of its physical blade range with in-store vehicle lookup terminals and next day fulfilment, citing more than forty connector variants making comprehensive shelf stocking uneconomic. Purchasing has been moving toward lookup driven channels across every developed market for several years now.
Signal: Fitment complexity is quietly converting a shelf category into a catalogue one in every developed market at once
SEPTEMBER 2025

Supplier launches blade range positioned on sensor performance

A supplier launched an aftermarket range positioned explicitly on maintaining forward camera and sensor performance rather than on driver visibility or quiet operation. Streaking wide enough to degrade sensing is measured in millimetres, which makes the argument considerably more concrete than comfort claims ever were.
Signal: Selling to the camera rather than the driver is a genuinely different premium argument for this whole category

What A Wiper Blade Costs

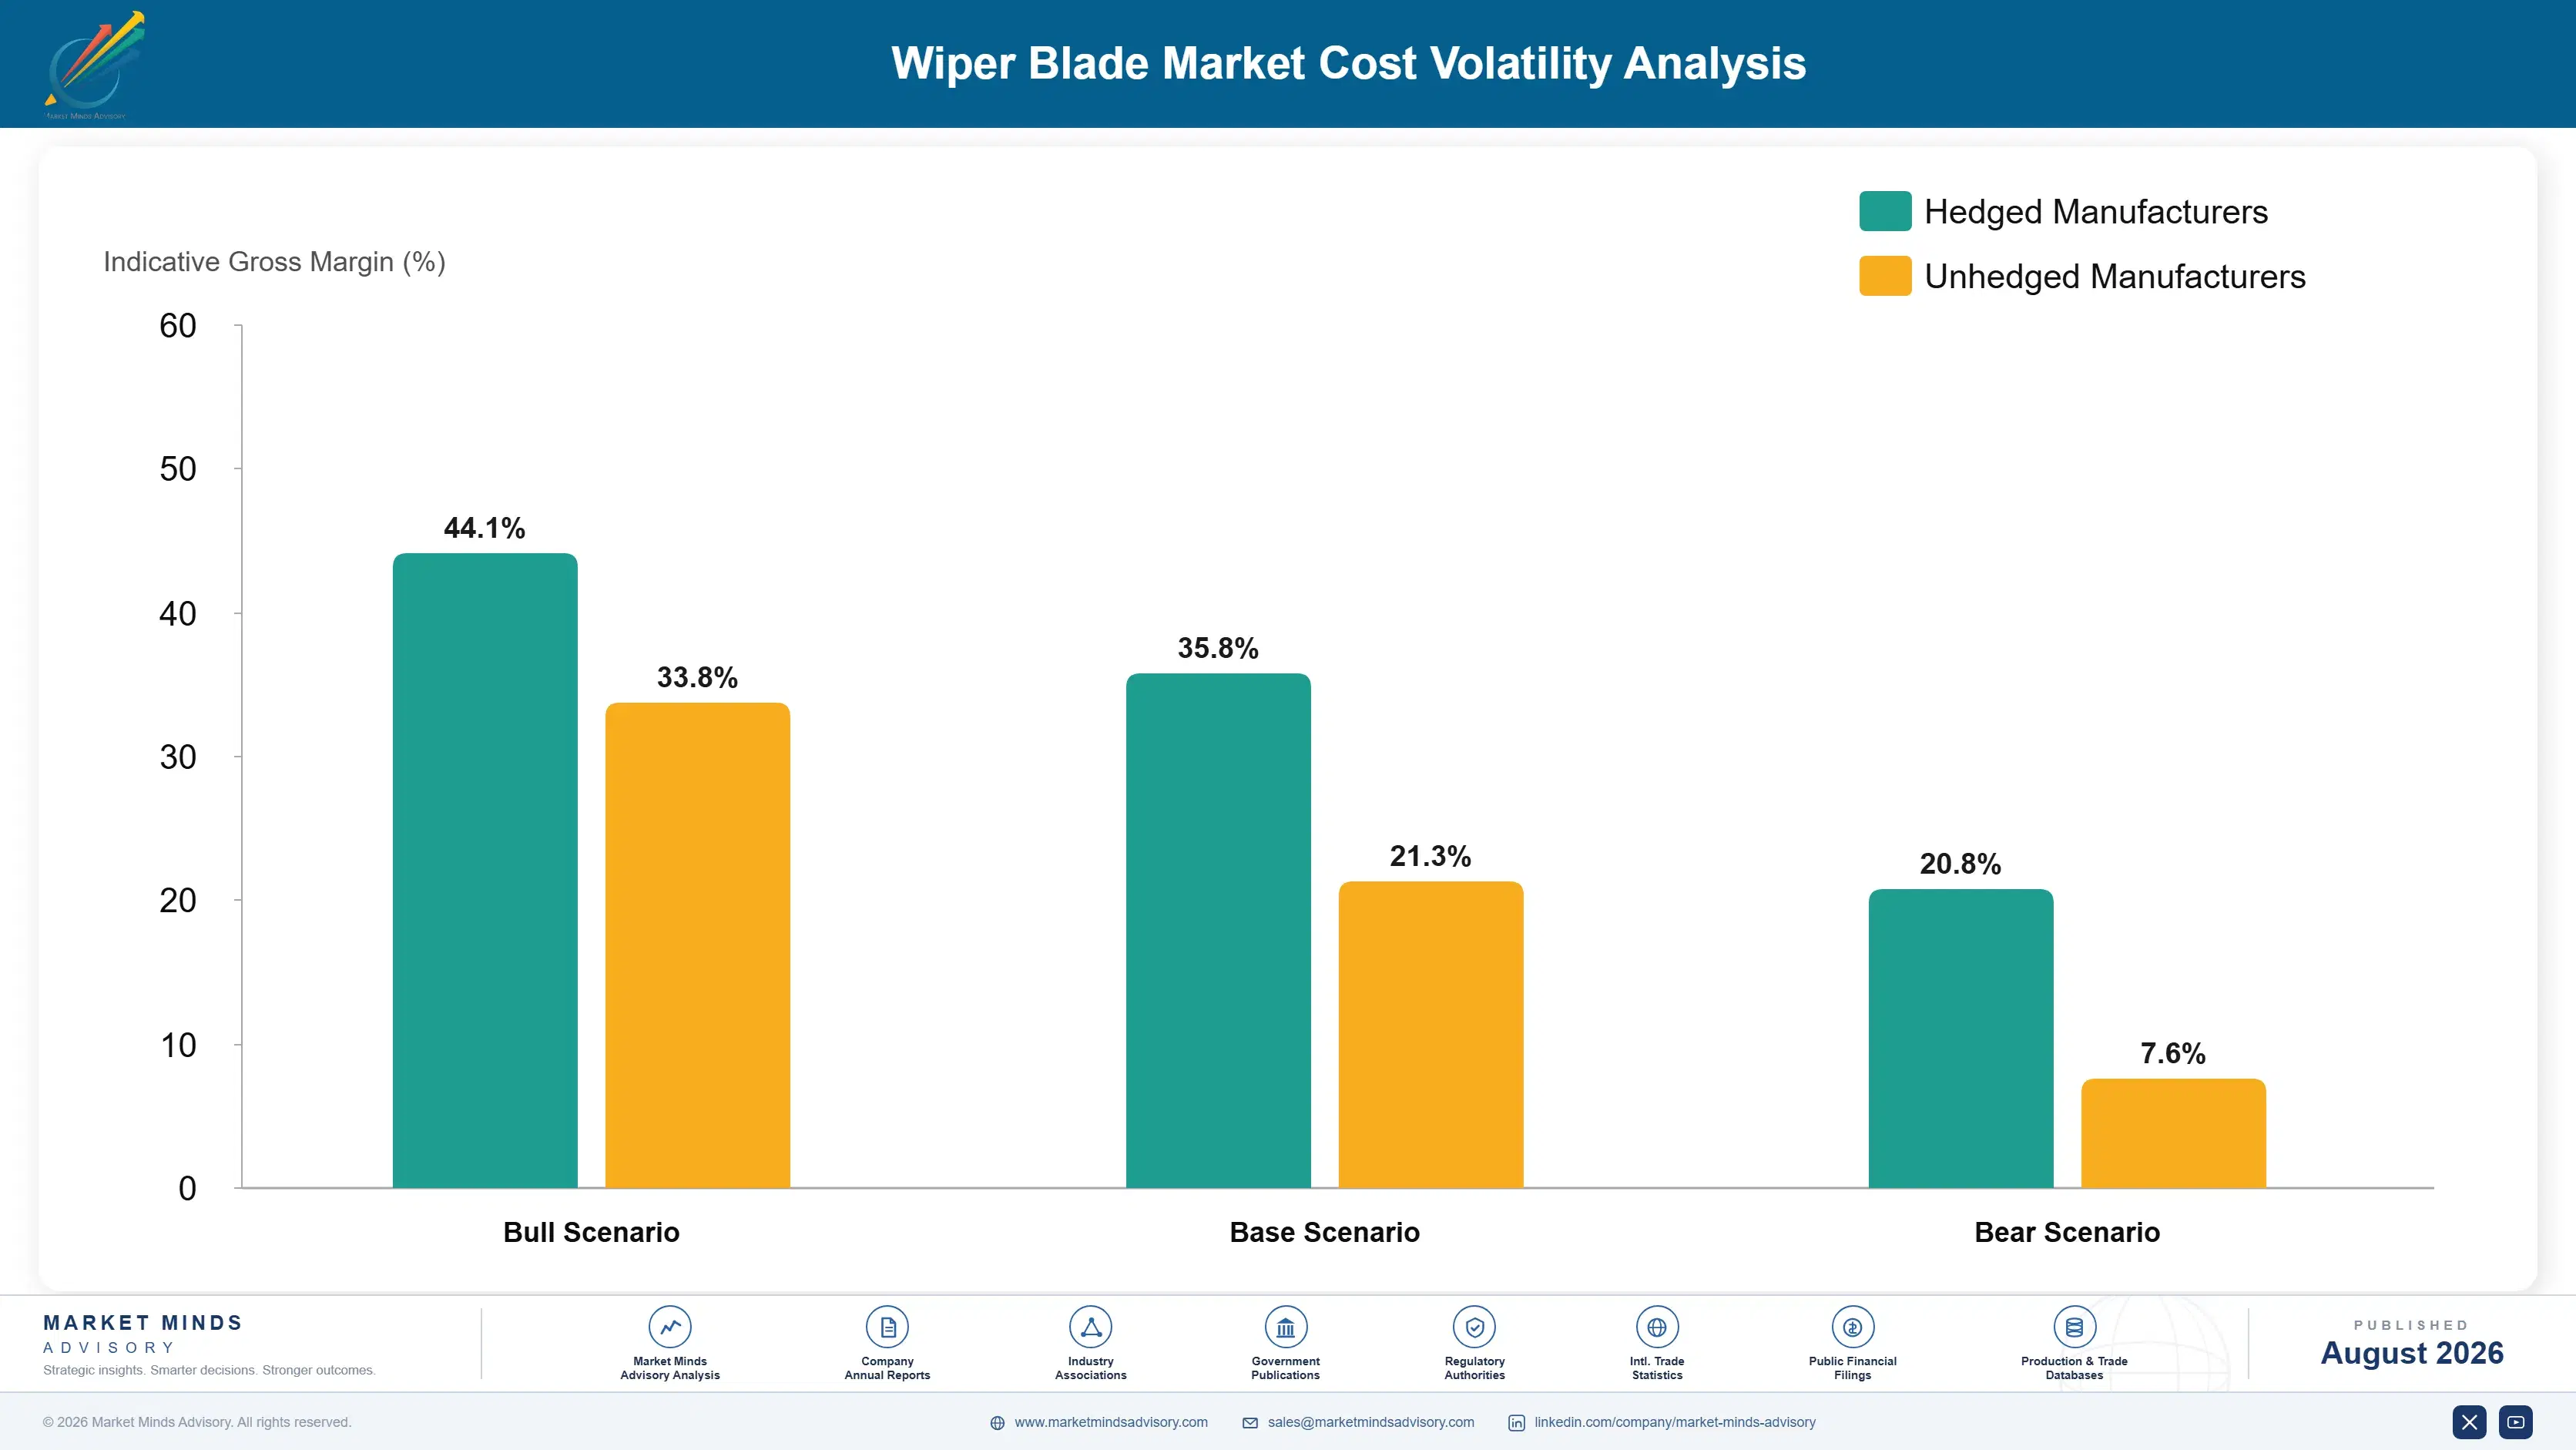
Rubber compound accounts for 29% of manufacturing cost, with spring steel at 22% and polymer spoilers, end caps, adaptors, coatings and packaging carrying the remainder. Natural rubber pricing follows plantation supply across Southeast Asia while synthetic grades track butadiene and energy costs, and most blade manufacturing capacity sits in China at competitive landed cost. Adaptor tooling is a larger fixed cost than most participants expect.
Natural rubber and butadiene moved on unrelated cycles during the last disruption, which caught formulators exposed to both. EIA and IEA data recorded the energy and feedstock movements behind synthetic pricing, and automotive component annual reports documented margin compression across aftermarket ranges priced annually with retailers. Original equipment contracts absorbed movement differently, being priced on longer terms with limited adjustment mechanisms available to suppliers. Nobody escaped both.

Exposure divides by channel and by manufacturing location rather than by scale. Chinese manufacturers producing at landed cost advantage pass movements through into price led volume, while branded suppliers absorb them to hold recognised retail price points. Adaptor tooling cost spreads across the variants a range covers, which means a supplier carrying more than forty variants carries a fixed cost burden a narrow range supplier avoids.
wiper-blade-industry-analysis-key-insight-cost-volatility-analysis-1787665123158

Rationalise adaptor tooling across connector variants deliberately

Covering more than forty connector variants means tooling, inventory and obsolescence cost spread across a range where some sell in tiny volumes. Multi-fit adaptor systems reduce that count while adding fitting complexity for the consumer, which is a genuine trade. Making the decision deliberately rather than letting the range accumulate is what separates a managed cost from a growing one.

Index aftermarket retail agreements to rubber input movement

Natural rubber and butadiene move on unrelated cycles and aftermarket ranges are typically priced annually with retailers holding recognised price points. Branded suppliers absorbed the last movement to protect those points while Chinese competitors passed it through. Raising indexation at negotiation costs nothing, and retailers understand input cost arguments better than most suppliers assume they will.

Invest in fitment data quality as a commercial asset

Whoever holds accurate, complete and current fitment data increasingly controls a transaction moving toward lookup driven channels, and maintaining it across new model introductions is expensive and unglamorous work. Competitors who treat it as an administrative overhead leave a defensible position available. It costs less than a product development programme and returns more in a category where products barely differ.

Portfolio Architecture for Margin Defence

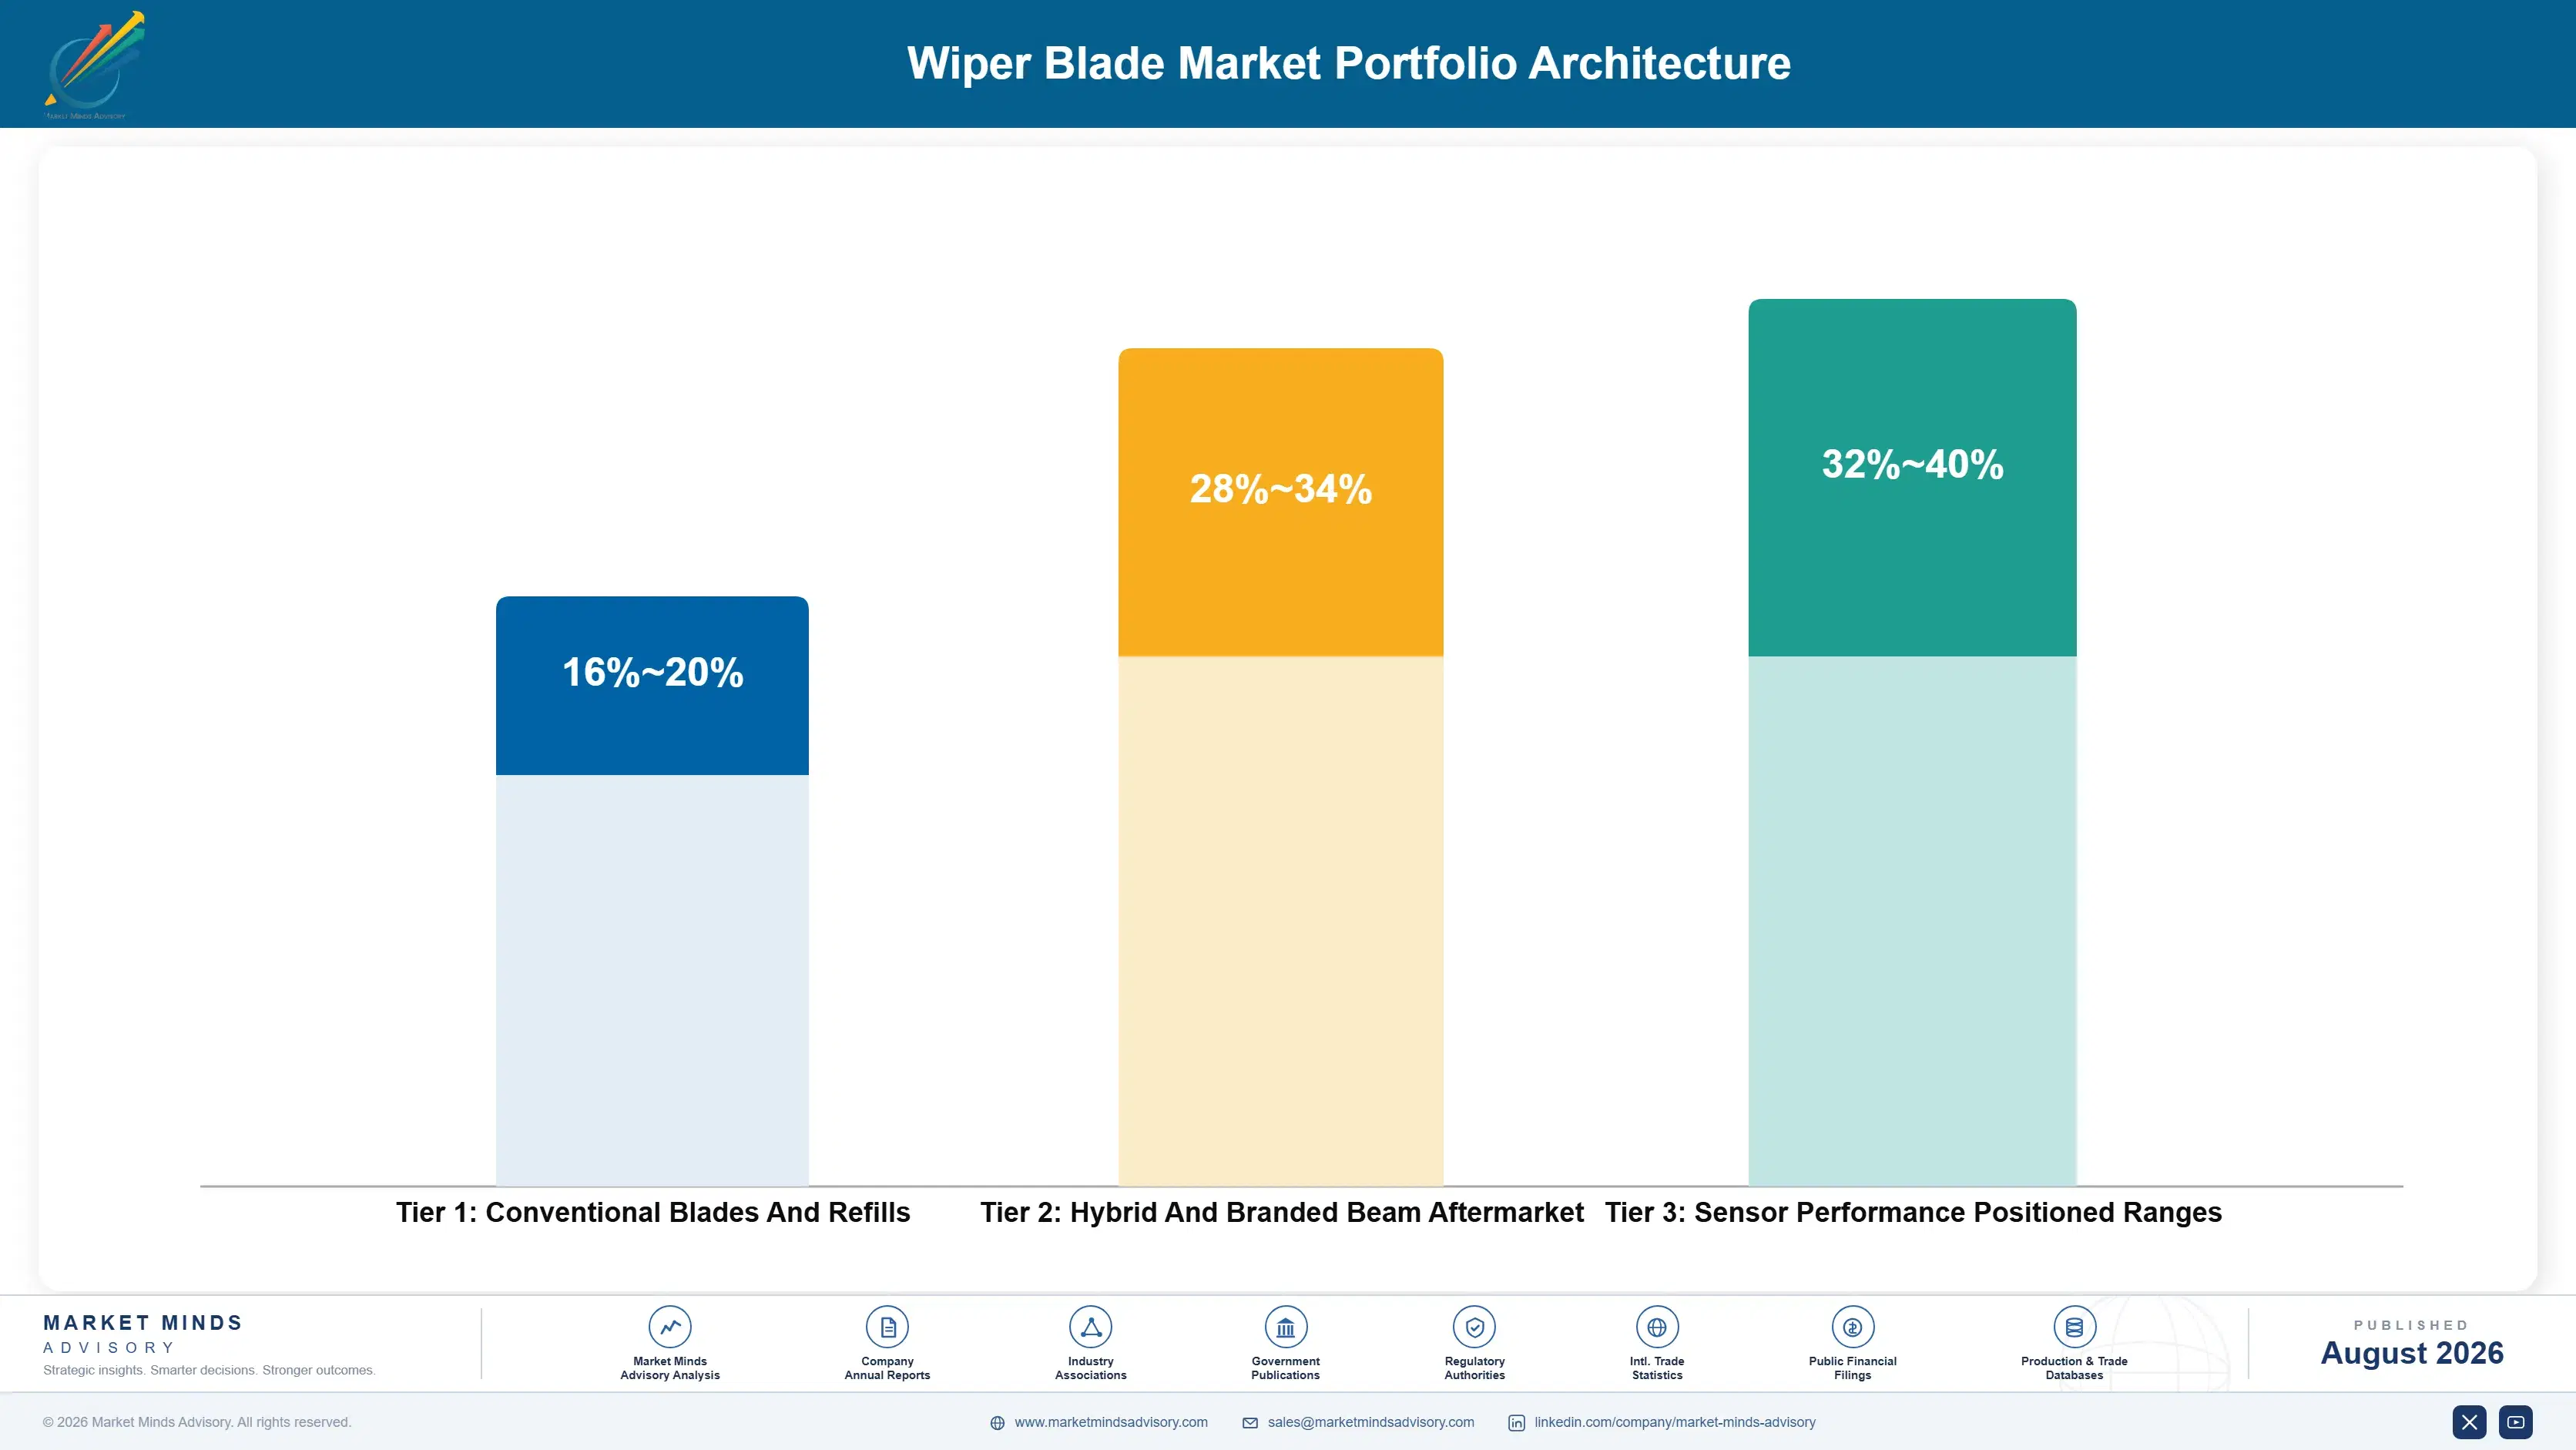
Margin architecture divides on whether the consumer can tell the difference. Conventional bracket blades and refills earn least, being commodity products bought on price by consumers treating a blade as a blade. Hybrid and premium aftermarket blades earn considerably better, since the design difference is visible and the price step feels justified at the point of purchase. Original equipment supply earns least per unit and delivers the volume everything else depends on.
The tension runs between volume and recognition. Original equipment fitment produces large predictable volumes at thin margins and creates the installed base that generates aftermarket replacement demand years later. Aftermarket branded supply earns properly but competes against Chinese manufacturers and private label programmes on a shelf where consumers cannot distinguish the products. Holding both is standard and neither half subsidises the other.

High value pools concentrate in premium aftermarket positioning and in fitment data control, neither of which is a manufacturing position. Everything sold on price competes against manufacturers with landed cost advantages that branded suppliers cannot match. The businesses worth building are those where a sensing performance argument, a visible design difference or a lookup system makes the purchase something other than a price comparison.

Conventional Blades And Refills

Bracket blades and refill elements bought on price by consumers treating the product as interchangeable. Chinese manufacturers and private label programmes compete effectively and no meaningful differentiation is available anywhere.
Gross Margin: 16-20%

Hybrid And Branded Beam Aftermarket

Branded beam and hybrid blades where the design difference is visible at the shelf and the price step feels justified to the purchaser. Brand recognition rather than measurable performance supports the premium in most cases.
Gross Margin: 28-34%

Sensor Performance Positioned Ranges

Ranges positioned explicitly on maintaining forward camera and sensor performance rather than driver comfort. The range is wide because this positioning is new and pricing has not settled across markets or channels yet.
Gross Margin: 32-40%
wiper-blade-industry-analysis-key-insight-portfolio-architecture-1787665123661

High-value Sub-segments and Strategic Watch-out

Beam Blades

Fastest growing type at 6.6% because around 84% of new assembly specifies them and the aftermarket follows with a lag of several years. Growth here is predictable from assembly data that already exists and needs no forecasting. Nothing about this requires any forecasting at all.
Gross Margin: 26-32%

Hybrid Blades

Second fastest at 5.8% and where much of the premium aftermarket margin actually sits, since upgrading from conventional feels like a smaller decision. Broader fitment compatibility also reduces range complexity for the whole channel. Compatibility breadth also reduces range complexity across the whole distribution channel.
Gross Margin: 28-34%

Conventional Bracket Blades

Growing at only 1.4% and declining with the vehicles that were originally fitted with them across every developed market. Aftermarket ranges remain overweight here, which is a stocking decision made against a parc that keeps shrinking. Working capital therefore sits precisely where demand keeps falling.
Gross Margin: 16-20%

Refill Elements

Growing at 2.2% and confined largely to commercial vehicles, older cars and markets where replacing the rubber alone remains normal practice. Beam construction makes refilling impractical, which removes the option as fitment converts. Nothing is likely to reverse that trajectory anywhere across the forecast period.
Gross Margin: 14-18%

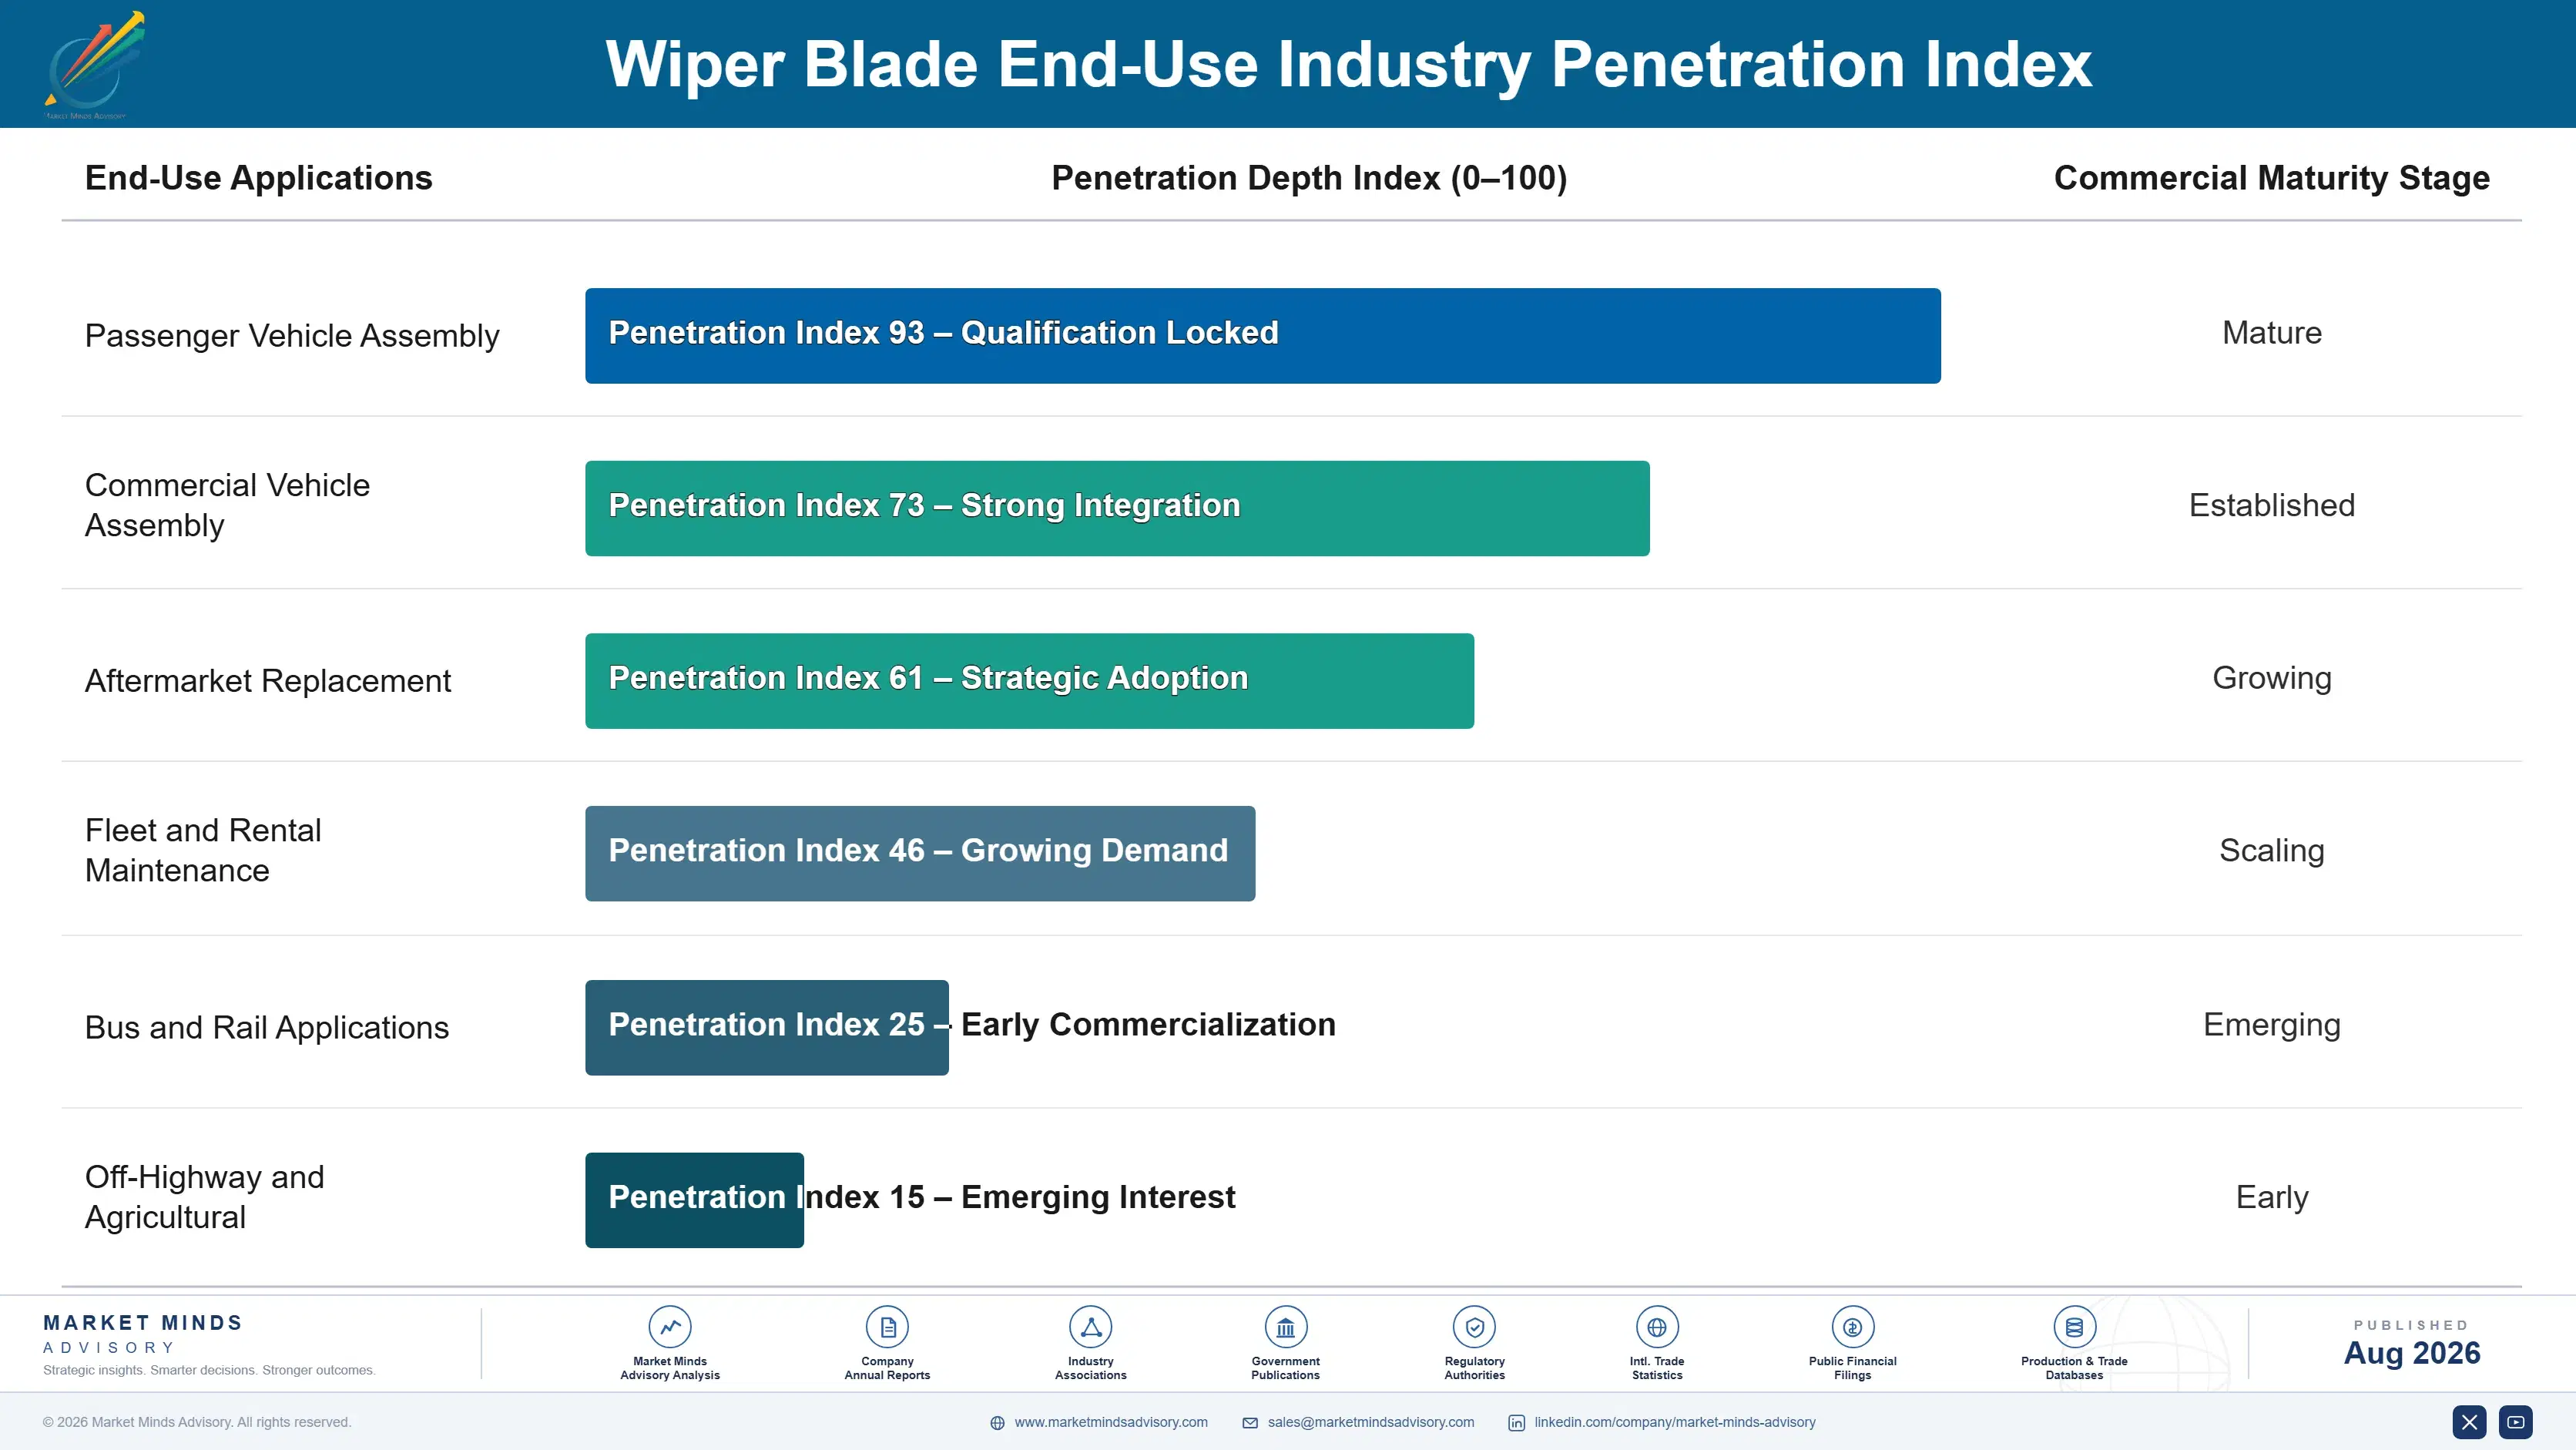
How Replacement Demand Forms

Demand here is generated by irritation rather than by schedule, which is why it has been so resistant to commercial influence. A driver notices streaking, tolerates it for a while, and eventually buys a replacement at around twenty six months against guidance of about nine. Nothing in the vehicle demands action, no service schedule mandates it, and the failure is gradual enough that there is never an obvious moment.
Channel behaviour then divides sharply by market and by driver. Some replace at a parts retailer or online and fit it themselves, some have it done at routine service where a technician specifies the product, and some ignore it until an inspection or test requires attention. Workshop fitted replacement is growing as fitment complexity makes self selection harder, which moves the specification decision away from the consumer entirely.

The potential shift is from irritation toward instruction. Vehicle systems that assess wiping quality through camera image degradation can flag replacement as a definite message rather than a judgement call, which would replace a behaviour four decades of marketing failed to change with a dashboard notification. That would restructure demand, and it would also move specification toward whoever the vehicle manufacturer nominates.
wiper-blade-industry-analysis-key-insight-end-use-penetration-index-1787665124149

Where This Category Rewards Focus

These are among the four positions where our research anticipates prominent divergence between winners and laggards over the coming forecast period. Each is grounded in the demand model, the regulatory perimeter, and the announced capacity pipeline.
01 / REPLACEMENT INTERVAL ECONOMICS

The parc could support three times the volume

Manufacturers recommend replacement at around nine months while drivers actually replace at roughly twenty six, which means the existing installed parc could support nearly three times current unit volume without a single additional vehicle entering service. Advertising, service reminders and colour changing wear indicators have all failed to move that interval, because degradation is gradual and no single moment ever demands action from anybody. Any mechanism producing a definite signal is worth more than every product improvement this category has made.
02 / FITMENT COMPLEXITY CONTROL

Whoever holds the data holds the sale

More than forty distinct arm connector variants now exist against a handful three decades ago, which makes a comprehensive physical retail range nearly impossible to merchandise sensibly in an aisle. Purchasing has moved toward online listings, catalogue systems and workshops that hold accurate fitment data, and that data increasingly controls the transaction regardless of who manufactured the blade. Maintaining it across new model introductions is expensive and unglamorous, which is precisely why doing it well remains a genuinely defensible commercial position.
03 / SENSING PERFORMANCE POSITIONING

Sell to the camera, not the driver

A forward facing camera behind the windscreen cannot interpret a scene through a smeared arc, and streaking wide enough to degrade sensing performance is measured in millimetres rather than in driver irritation levels. That converts wiping quality from a comfort preference into a functional requirement supporting systems the vehicle actively depends on to operate safely. Most suppliers still sell streak free glass and quiet operation, which is exactly the argument that failed to change replacement behaviour across four decades of trying.
04 / FITMENT LAG TIMING

Stock what was fitted, not what sold

Around 84% of new vehicle assembly now specifies beam blades, and those vehicles reach first replacement several years afterwards, which makes aftermarket beam demand predictable from assembly data that already exists today. Beam blades grow at 6.6% against a market rate of 4.4% on exactly that mechanism and nothing else. Most aftermarket ranges remain weighted toward conventional designs fitted to vehicles now leaving the parc, which is a stocking decision made against yesterday's fitment rather than against tomorrow's replacement demand.

Engagement Snapshot From the Field

A live engagement with an industry participant carrying material or product regulatory and market exposure ahead of a defining policy shift, showing how our research translates into a defensible multi-year portfolio strategy.
MARKET MINDS ADVISORY · CLIENT ENGAGEMENT SUMMARY
Wiper Blade Producer Strategic Portfolio Review and Transition Roadmap 2026·Investment Scenario on Wiper Blade Exposure Evaluation 2025-26
CLIENT PROFILE
An aftermarket wiper blade supplier selling branded and private label ranges through parts retailers and distributors across North America and Western Europe. Annual revenue was approximately 190 million dollars (client-reported, unverified by MMA), predominantly conventional and hybrid blades. Fitment data was maintained by a small administrative team and had not been reviewed as a commercial asset at that stage.
STRATEGIC CHALLENGE
Retail shelf space had been reduced as fitment complexity made comprehensive ranges uneconomic to stock, and online listings were converting poorly against competitors whose vehicle lookup returned results the client's did not. Management was weighing a premium product launch against investment in data and channel capability. Nobody had measured lost online sales from fitment gaps.
MMA APPROACH
MMA audited the client's fitment data completeness and accuracy against current model coverage and tested online lookup outcomes against competitors on identical vehicle queries. Premium range development was costed against data and listing investment. Forty-seven expert interviews with retailers, workshop managers, online marketplace category leads and consumers established how purchases now happen, alongside survey work across six countries.
KEY FINDINGS
  1. Fitment data covered around 78% of the current parc accurately, and lookup failures on the remainder were pushing consumers to competitor listings rather than to alternative products.
  2. Online conversion ran at roughly half the competitor benchmark on identical vehicle queries, almost entirely attributable to lookup accuracy rather than price or brand.
  3. Range analysis showed 34% of stock keeping units covered conventional blades for vehicles leaving the parc, tying working capital to declining demand.
  4. Consumers in 5 of the 6 markets surveyed said a dashboard warning would prompt replacement, against 1 in 6 saying advertising ever had.
CLIENT PROFILE
An aftermarket wiper blade supplier selling branded and private label ranges through parts retailers and distributors across North America and Western Europe. Annual revenue was approximately 190 million dollars (client-reported, unverified by MMA), predominantly conventional and hybrid blades. Fitment data was maintained by a small administrative team and had not been reviewed as a commercial asset at that stage.
STRATEGIC CHALLENGE
Retail shelf space had been reduced as fitment complexity made comprehensive ranges uneconomic to stock, and online listings were converting poorly against competitors whose vehicle lookup returned results the client's did not. Management was weighing a premium product launch against investment in data and channel capability. Nobody had measured lost online sales from fitment gaps.
MMA APPROACH
MMA audited the client's fitment data completeness and accuracy against current model coverage and tested online lookup outcomes against competitors on identical vehicle queries. Premium range development was costed against data and listing investment. Forty-seven expert interviews with retailers, workshop managers, online marketplace category leads and consumers established how purchases now happen, alongside survey work across six countries.
KEY FINDINGS
  1. Fitment data covered around 78% of the current parc accurately, and lookup failures on the remainder were pushing consumers to competitor listings rather than to alternative products.
  2. Online conversion ran at roughly half the competitor benchmark on identical vehicle queries, almost entirely attributable to lookup accuracy rather than price or brand.
  3. Range analysis showed 34% of stock keeping units covered conventional blades for vehicles leaving the parc, tying working capital to declining demand.
  4. Consumers in 5 of the 6 markets surveyed said a dashboard warning would prompt replacement, against 1 in 6 saying advertising ever had.
RECOMMENDED STRATEGY
Phase 1: Phase one: rebuild fitment data to full current parc coverage, since accuracy at around 78% was halving online conversion against competitors. Phase 2: Phase two: rebalance the range away from the 34% of units covering vehicles leaving the parc toward beam and hybrid designs. Phase 3: Phase three: develop sensor performance positioning, since 5 of 6 markets responded to functional prompts where advertising has never once worked.
OUTCOME
The client rebuilt fitment data across current model coverage and online conversion improved materially within two quarters without any price change. Range rebalancing released working capital tied to declining conventional demand, and a sensor performance positioned range entered development as the first genuinely new argument the category had been given (client-reported, unverified by MMA).

Frequently Asked Questions

Foundational context covering the market sizes, CAGR, scope, country, region and competition that inform every finding below. This section is provided to cover basics and most often pre-purchase conversations, answered from the MMA Primary Research Dataset.

What is the current size of the Wiper Blade Market?

The market was valued at 4.6 billion dollars in 2025, covering windscreen and rear wiper blades for original equipment fitment and aftermarket replacement worldwide. It reaches an estimated 4.80 billion dollars during 2026.

How large will the Wiper Blade Market be by 2036?

MMA forecasts 7.38 billion dollars by 2036, an increase of 2.58 billion dollars over the 2026 base. That represents an expansion multiple of 1.54 times across the forecast period.

What is the CAGR for the Wiper Blade Market 2026 to 2036?

The base case compound annual growth rate is 4.4%, with a bull case of 5.6% and a bear case of 3.2%. Replacement interval behaviour and vehicle parc growth separate those scenarios.

Which segment is growing fastest?

Beam blades grow at 6.6%, half again the market rate of 4.4%, because around 84% of new assembly specifies them and the aftermarket follows. Hybrid blades follow at 5.8%.

Who are the major companies in the Wiper Blade Market?

Bosch, Valeo, Denso, Trico Products and Tenneco lead on unit shipments across original equipment and aftermarket supply. Together they account for 46% of the global market.

Which country is growing fastest?

India grows fastest at 7.8%, because vehicles assembled over recent years are now entering replacement cycles in volume and aftermarket demand lags assembly by several years.

Report Segmentation Architecture

The full report scope spans multiple orthogonal segmentation dimensions, with cross-tabulated demand data provided for each dimension pair. Coverage extends further to regional breakdowns, trend trajectories, and the competitive detail needed to support segment-level decision-making.

By Blade Type

  • Conventional Bracket Blades
  • Beam Blades
  • Hybrid Blades
  • Rear Wiper Blades
  • Refill Elements
  • Heated and Specialty Blades

By End-Use Industry

  • Passenger Vehicle Assembly
  • Commercial Vehicle Assembly
  • Aftermarket Replacement
  • Fleet and Rental Maintenance
  • Bus and Rail Applications
  • Off-Highway and Agricultural

By Commercial Dimension

  • Original Equipment Direct Supply
  • Automotive Parts Retail
  • Workshop and Installer Supply
  • Online and Marketplace Retail
  • Fleet Contract Supply
  • Private Label Manufacturing

By Region

  • North America
  • Western Europe
  • East Asia
  • South Asia and Pacific
  • Latin America
  • Middle East and Africa
  • Eastern Europe

Scope, Methodology, and Coverage

Every figure in this report is reproducible from documented input assumptions. The scope below maps the historical period, the forecast horizon, the segmentation dimensions, and the countries covered, alongside the underlying primary and qualitative methodology.
Historical Period
2020 to 2025
Forecast Period
2026 to 2036
Base Year
2025 (USD billions; MMA Primary Research Dataset, August 2026)
Market Definition
Windscreen and rear wiper blades supplied for original equipment fitment and aftermarket replacement worldwide, covering conventional bracket blades, beam blades, hybrid blades, rear wiper blades, refill elements, and heated or specialty blades across passenger, commercial and off-highway applications, measured at manufacturer selling value. Wiper arms, motors, linkages and mechanisms, washer pumps, reservoirs, nozzles and fluids, rain sensors, and windscreen coating or treatment products are excluded from scope entirely.
Quantitative Units
USD billions (manufacturer selling value); units shipped; USD per unit by blade type
Segmentation Dimensions
Blade type; end-use industry; commercial dimension; region
Regions Covered
North America, Western Europe, East Asia, South Asia and Pacific, Latin America, Middle East and Africa, Eastern Europe
Countries Covered
United States, Canada, Mexico, Germany, France, United Kingdom, Italy, Spain, Netherlands, China, Japan, South Korea, Taiwan, India, Thailand, Indonesia, Australia, Brazil, Argentina, Saudi Arabia, South Africa, Poland
Key Companies Profiled
Bosch, Valeo, Denso, Trico Products, Tenneco, HELLA, Mitsuba, Illinois Tool Works, Michelin, Hyundai Mobis, KCW Corporation, CAP Corporation, Doga, Pylon Manufacturing, Champion, Nippon Wiper Blade, Guangzhou Aiwei Auto Parts, Danyang Ruiying, Metzger, Corteco
Quantitative Methodology
Primary survey, n=3,800 respondents, Q4 2025, six countries; demand-side model with trade association cross-validation
Qualitative Methodology
47 expert interviews, Q4 2025; applied to validate demand model assumptions, identify emerging dynamics, and assess competitive positioning
Report Format
PDF and XLSX data workbook (Word format preview document)
Publisher
Market Minds Advisory
Report Code
MMA-2026-AUT-105
Published
August 2026
Contact
sales@marketmindsadvisory.com | www.marketmindsadvisory.com

Purchase the full Wiper Blade Market Report (2026 to 2036).

The full report is built around the gap between a nine month recommendation and a twenty six month reality, and what driver assistance systems might finally do to it. It sizes all six blade types independently through 2036, models aftermarket demand against original equipment fitment lag by region, and quantifies how fitment complexity has moved purchasing from physical shelves into lookup driven channels. Regional chapters cover all seven regions, with miles driven assessed separately from parc size throughout. Competitive profiling covers 20 participants on one consistent unit shipment measure.
Six blade types sized independently through 2036
Aftermarket demand modelled against original equipment fitment lag
Fitment complexity quantified across connector variants and channels
Sensing performance requirements assessed as a premium positioning route
Replacement interval behaviour analysed across every covered market
Twenty participants profiled on one consistent shipment measure

Built For The People Who Decide

From boardroom strategy to bench-side execution, this report is read cover-to-cover by leaders shaping the next decade of their industry, turning demand scenarios, market dynamics and valuation benchmarks into decisions.
CXOs/ Presidents/ VPs/ Managers
M&A and Corporate Development
Strategy Teams and R&D Heads
Procurement and Product Directors
Regulatory and Compliance Leaders
Investor Relations and Equity Analysts