
Market Minds Advisory
Whole Genome Amplification Market

Whole Genome Amplification Market: Whole Genome Amplification: Twenty Years Of Managing A Bias Nobody Solved

Every amplification chemistry fails in a different way, none of them fails less, and the application decides which failure a laboratory is willing to live with in its own data.

Lead Analyst

Published

September 2026

Make Smarter Decisions with Customized Research Insights

Request a free sample report and evaluate market opportunities, growth trends, and competitive dynamics relevant to your business needs.

2025 MARKET VALUE$0.4BMarket Size 2025
2036 FORECAST VALUE$1.1BBase Case , 2026 to 2036
CAGR 2026 TO 20369.4 %Bull 10.6% / Bear 8.2%
INCREMENTAL OPPORTUNITY$0.7BNet 10- year value creation
EXPANSION MULTIPLE2.46x2036 value over 2026 base
Strategic Levers
M&A Pipeline
Regional Outlook
Country Rankings
Competitive Intelligence
Segmental Deep-dive
Call-Us : 91 93563 13602

Executive Snapshot and Market Trajectory.

Amplifying a whole genome from a single cell was never solved, only managed. Displacement chemistry gives long fragments and uneven coverage, polymerase chain methods the reverse, and hybrid approaches split the difference between them. Twenty years of work produced choices between failure modes rather than a method without one.
That is why this market segments by application instead of by technology. A single-cell researcher tolerates coverage bias that a fertility laboratory cannot, because an allele dropout there means transferring an embryo carrying the condition somebody was testing for. Single-cell genomics research grows fastest at 14.1%, half again the market rate, and preimplantation testing follows at 11.2%. The chemistry follows the use case.
The real threat is disappearance rather than competition. Around 23% of single-cell workflows now proceed directly to library preparation without any discrete amplification step, and sequencing sensitivity keeps improving. Kits sold as a standalone reagent are being designed out of the process, while those integrated into a validated workflow are not. China grows at 13.8% on testing cycle volume. Integration rather than performance is what decides survival across this whole category from here onward.
Market Definition
Reagents, kits and dedicated instruments used to amplify whole genomes from limited, single-cell or degraded DNA inputs, covering multiple displacement amplification, polymerase chain reaction based amplification, hybrid chemistries and associated automation. Measured at supplier revenue. Targeted amplification of specific loci, standard library preparation reagents for abundant input, sequencing instruments and consumables, and downstream analysis software sold separately are excluded from scope.
Base Year Value
$0.4B in 2025 (MMA Primary Research Dataset, August 2026)
Forecast Period
2026 to 2036, eleven discrete annual values
CAGR
9.4% base case. Bull 10.6%. Bear 8.2%.
Fastest Growth Segment
Single-Cell Genomics Research: 14.1% CAGR
Fastest Growth Country
China: 13.8% CAGR
Fastest Growth Region
South Asia and Pacific: 11.6% CAGR
Largest Region
North America: 32% of 2025 global value
Market Leaders
QIAGEN, Thermo Fisher Scientific, Takara Bio, Bio-Rad Laboratories, Yikon Genomics. Source: MMA Primary Research Dataset, July 2026.
Primary Survey
n=3,800 procurement and R&D decision-makers, Q4 2025, six countries
Methodology
Demand-side build-up, cross-validated against public data, 47 expert interviews

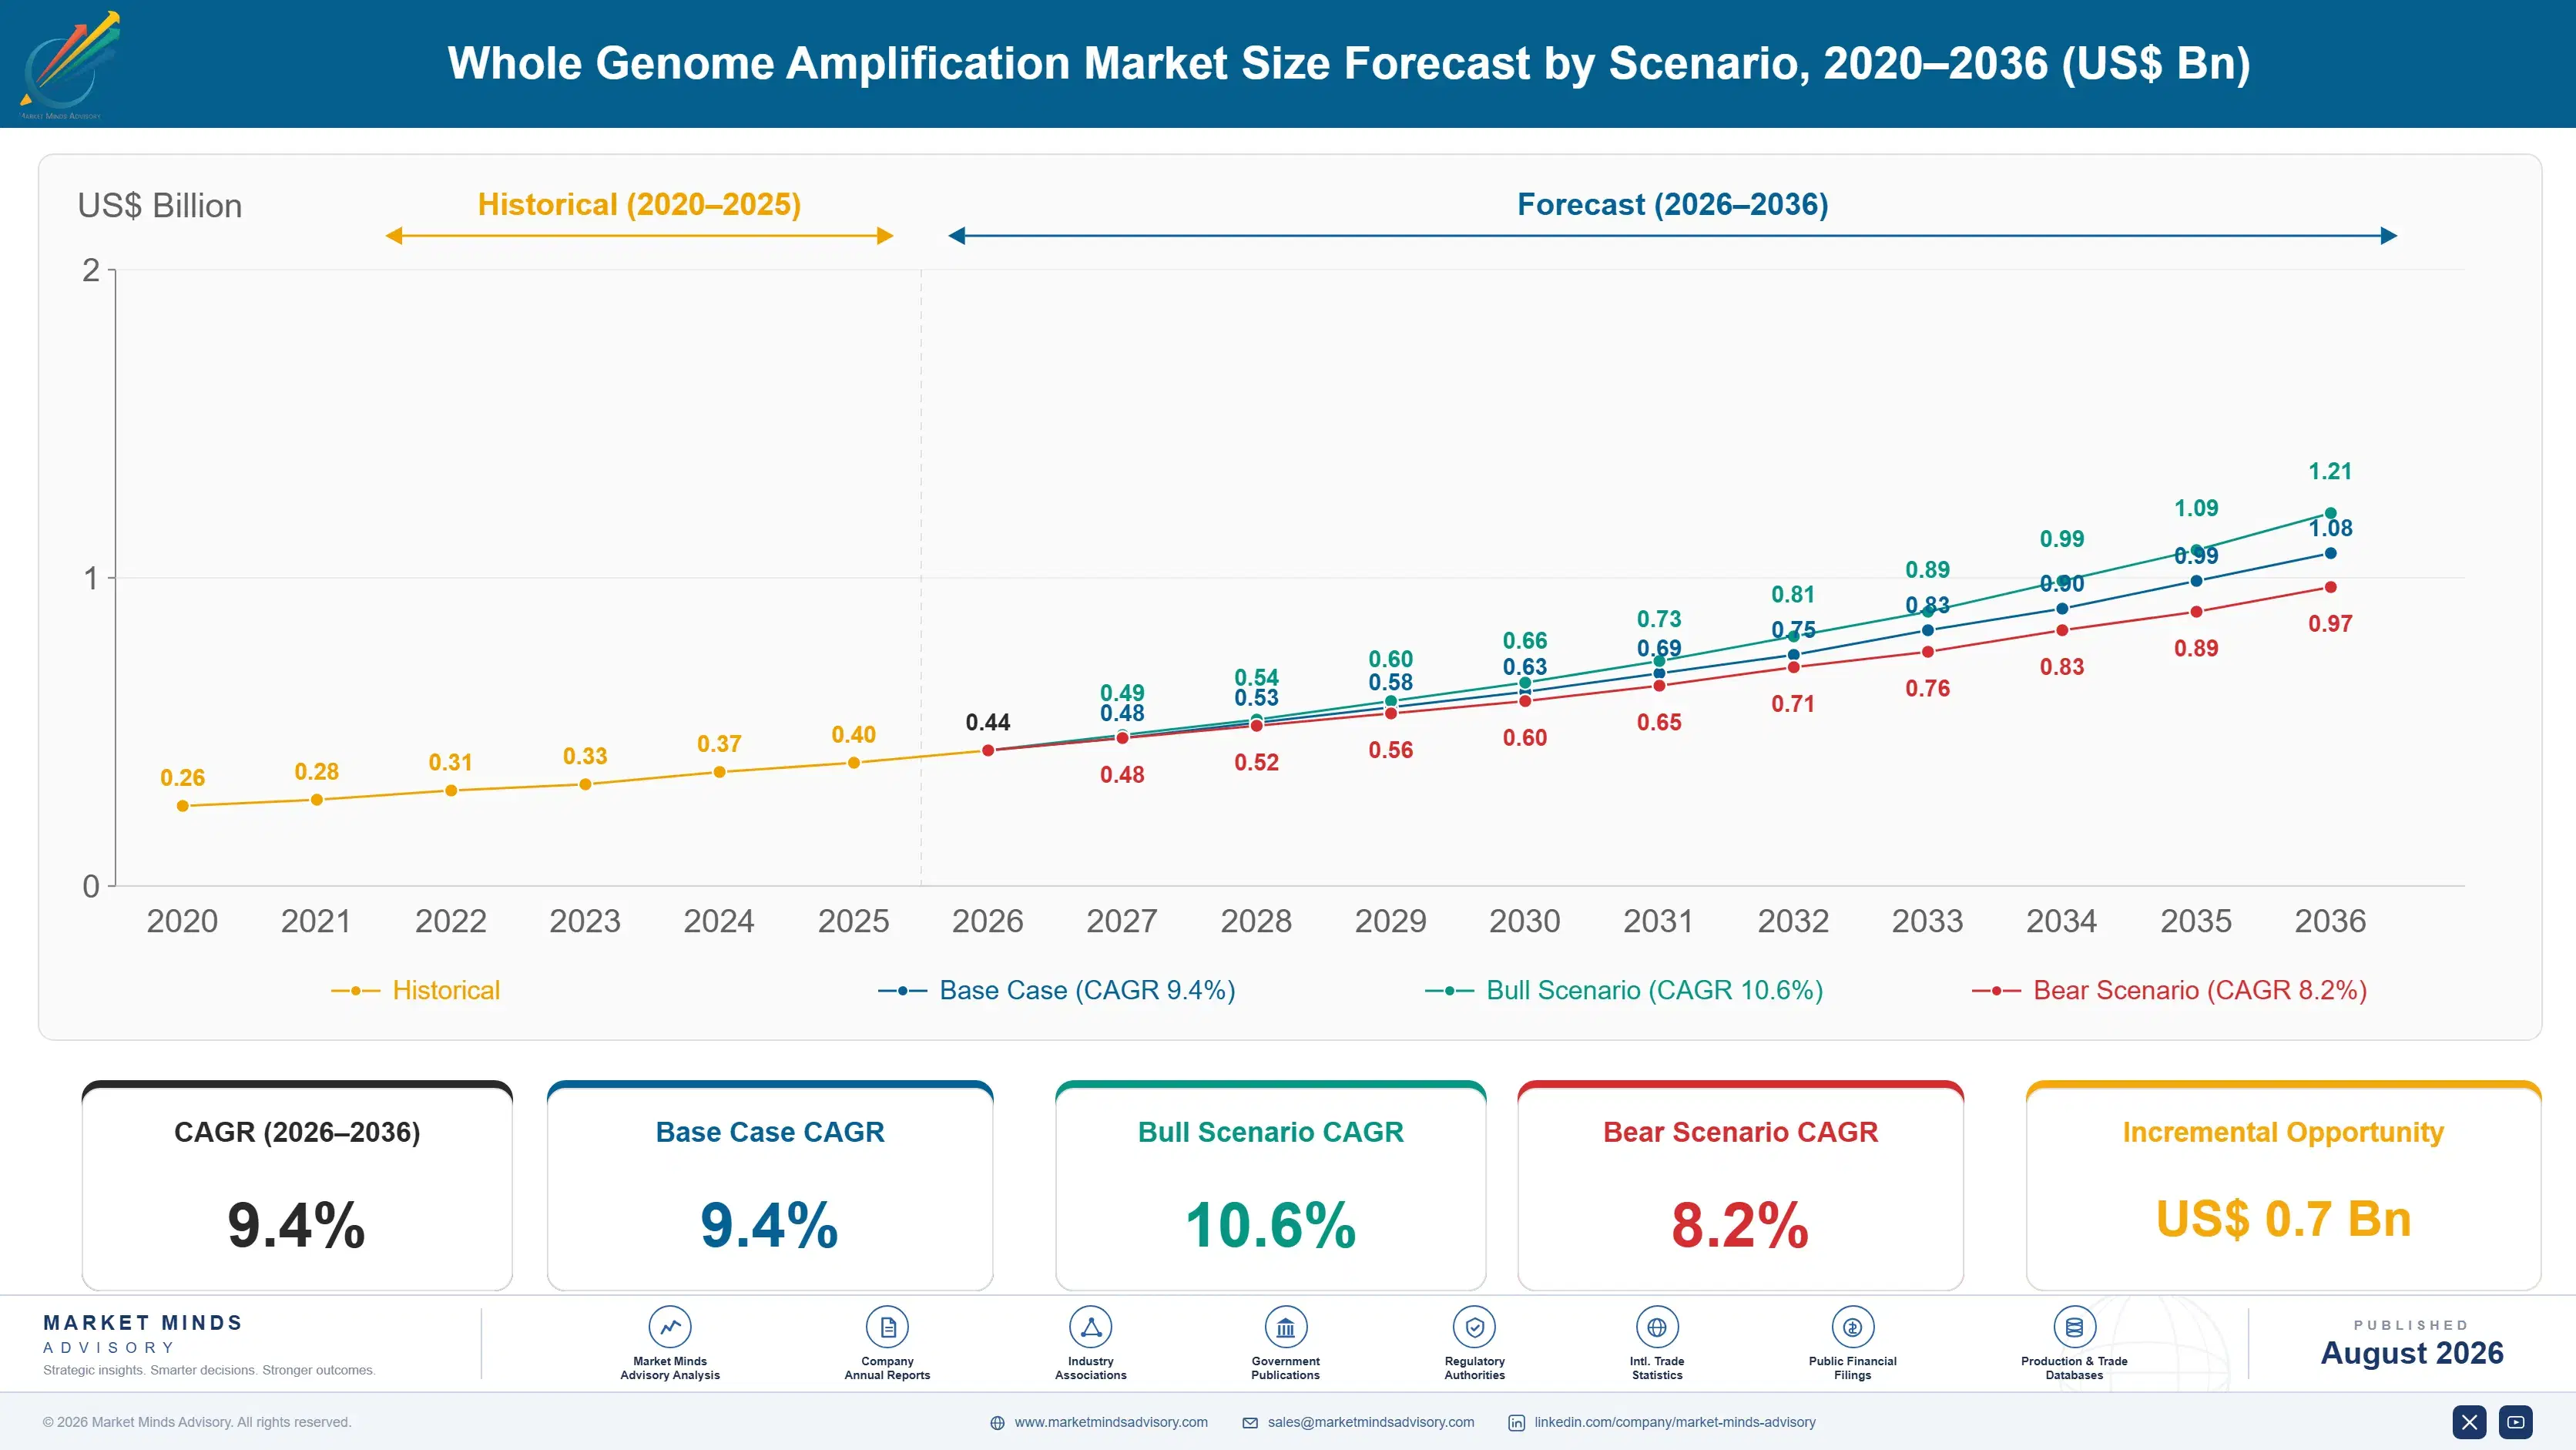
Whole Genome Amplification Market Forecast Scenarios

whole-genome-amplification-market-size-forecast-scenario-1787665060824
The five years to 2025 combined genuine single-cell expansion with a supply shock nobody had modelled. Single-cell sequencing moved from specialist laboratories into mainstream research, while enzyme and oligonucleotide capacity was diverted into pandemic testing and left research reagent supply short for two seasons. The 8.2% historical rate blends real application growth with a period of constrained availability that suppressed volume rather than raising it.
The 9.4% base case rests on three mechanisms. Single-cell genomics research grows at 14.1% as sequencing costs continue falling and experiments move to larger cell numbers. Preimplantation genetic testing grows at 11.2% on cycle volume and expanding indication use. And Chinese laboratory capacity grows at 13.8%, faster than any market covered, across both research and reproductive genetics simultaneously. Two applications and one geography together carry almost all of that growth.
The 10.6% bull case turns on single-cell whole genome sequencing entering routine clinical oncology use, which would convert a research reagent into a diagnostic consumable with entirely different volume and margin characteristics. The 8.2% bear case is displacement: 23% of single-cell workflows already skip discrete amplification, and improvements in library chemistry could remove the step from most protocols within the forecast period.

Choosing Which Way To Fail

The founding problem of this field has never been fixed, which is unusual after two decades of effort. Amplifying a single genome from a single cell means copying some regions far more than others, and every chemistry distributes that unevenness differently. Displacement amplification produces long fragments, high yield and coverage uniformity around 0.62, while polymerase chain approaches produce even coverage from fragments too short.
TOP FIVE CONCENTRATION54%Combined reagent revenue held by the leading suppliers
GENOME COVERAGE UNIFORMITY0.62Typical evenness score achieved across displacement amplification products
ALLELE DROPOUT RATE7.4%Loci lost during amplification from a single cell
REAGENT SHARE OF CYCLE4%Amplification kit against total genetic testing cycle cost
DIRECT LIBRARY DISPLACEMENT23%Single cell workflows now skipping a discrete amplification step
INPUT MATERIAL THRESHOLD6 pgStarting quantity below which conventional preparation stops working
So laboratories choose a failure mode rather than a product. A researcher profiling copy number variation across thousands of cells can accept coverage bias that would be unacceptable in a fertility laboratory, where allele dropout running near 7.4% translates directly into the possibility of transferring an embryo carrying the condition being tested for. The application decides the chemistry, which is why this market segments by use rather than method.
The uncomfortable development is that the step is becoming optional. Roughly 23% of single-cell workflows now proceed straight to library preparation without discrete amplification, because library chemistry and sequencing sensitivity have both improved to the point where the intermediate step adds bias without adding information. Kits sold as a standalone reagent are exposed to that directly, while kits embedded in a validated workflow are considerably less so.
"This is a category defined by a problem nobody solved. The suppliers that will still be here in a decade are the ones that stopped selling an amplification step and started selling a result the customer can validate."
Director, Genomics Tools and Reagents Practice · MMA Life Science Instrumentation Practice · August 2026

Market Trends

Direct Library Preparation Removes The Amplification Step

Library chemistry and sequencing sensitivity have improved enough that around 23% of single-cell workflows now proceed directly to library preparation, skipping discrete amplification entirely. The step was always a source of bias rather than information, and removing it improves data quality in the applications where it works. That leaves standalone amplification kits exposed to displacement rather than to competition, which is a different and more serious problem. Suppliers whose chemistry sits inside a validated workflow with downstream analysis are considerably better positioned than those selling the reagent alone. Pricing answers none of it.
Market Impact: China grows at 13.8% annually
Clinical Applications Force Attention Onto Allele Dropout

Allele dropout during single-cell amplification runs near 7.4% depending on chemistry and locus, and in research that is a data quality issue while in preimplantation genetic testing it is a clinical one. A dropped allele can produce a false negative that leads to transferring an embryo carrying the very condition being tested for. Accreditation bodies and reproductive genetics societies have focused on it accordingly. Suppliers able to demonstrate dropout performance across validated panels hold positions in clinical laboratories that research grade chemistries cannot approach. Revalidating an accredited workflow is expensive and slow.
Market Impact: Fastest application growing at 14.1%

Market Opportunities and Growth Drivers

Chinese Laboratory Capacity Expands Across Research And Clinic

Chinese academic institutions and clinical genetics laboratories have expanded simultaneously, with single-cell research capability growing alongside one of the largest reproductive genetics testing volumes anywhere. China grows at 13.8%, faster than any market covered. Domestic suppliers including Yikon Genomics and Vazyme compete on price and increasingly on chemistry, while international suppliers hold positions where validated clinical performance matters more than reagent cost. Both routes are expanding, and the clinical half carries considerably better economics for suppliers able to demonstrate dropout performance. Validation evidence rather than reagent price is the route into the clinical half.
Market Impact: Reagent is 4% of cycle cost

Falling Sequencing Cost Pushes Experiments To More Cells

As sequencing cost per genome continues falling, single-cell experiments move from tens of cells toward thousands, which multiplies amplification reagent consumption per study rather than per laboratory. Single-cell genomics research grows at 14.1% against a market rate of 9.4%, the fastest application in the category. Scale also changes what matters technically, since bias that averages out across thousands of cells is tolerable in ways it never was across a handful. That shift favours cheaper chemistries with worse individual performance. Volume per study rather than laboratories per market is what expands consumption here.
Market Impact: Uniformity sits near 0.62 typically

Market Restraints and Challenges

Reagent Represents A Small Share Of Testing Cycle Cost

The amplification kit accounts for roughly 4% of what a genetic testing cycle costs in reproductive medicine, which means laboratories choose on validated performance and workflow fit rather than on reagent price. The root cause is that sequencing, labour, clinical interpretation and the wider procedure dominate the cost structure completely. Commercially this caps how much a supplier can charge on a cost argument while removing price as a competitive weapon. Suppliers respond by competing on validation data and workflow integration, which suits incumbents considerably. Price is not a weapon available in this market.
Market Impact: Displacement already affects 23% of workflows

No Chemistry Performs Well Across Every Requirement

Displacement amplification delivers yield and fragment length with coverage uniformity near 0.62, polymerase chain methods deliver uniformity with fragments too short for structural analysis, and hybrid chemistries compromise on both. The root cause is physical, since amplifying from picogram inputs necessarily favours whatever primes first. Commercially this fragments demand across chemistries and prevents any supplier from consolidating the market on technical merit. Participants respond with application specific formulations and bias correction algorithms, which manage the consequences rather than the cause. Nobody has consolidated this market on technical merit and nobody is likely to.
Market Impact: Dropout runs near 7.4% per cell
3 additional market trends, 4 additional growth drivers, and 2 additional restraints and challenges are covered in the full report. Contact sales@marketmindsadvisory.com to access the complete intelligence.

Segment CAGR and Growth Architecture

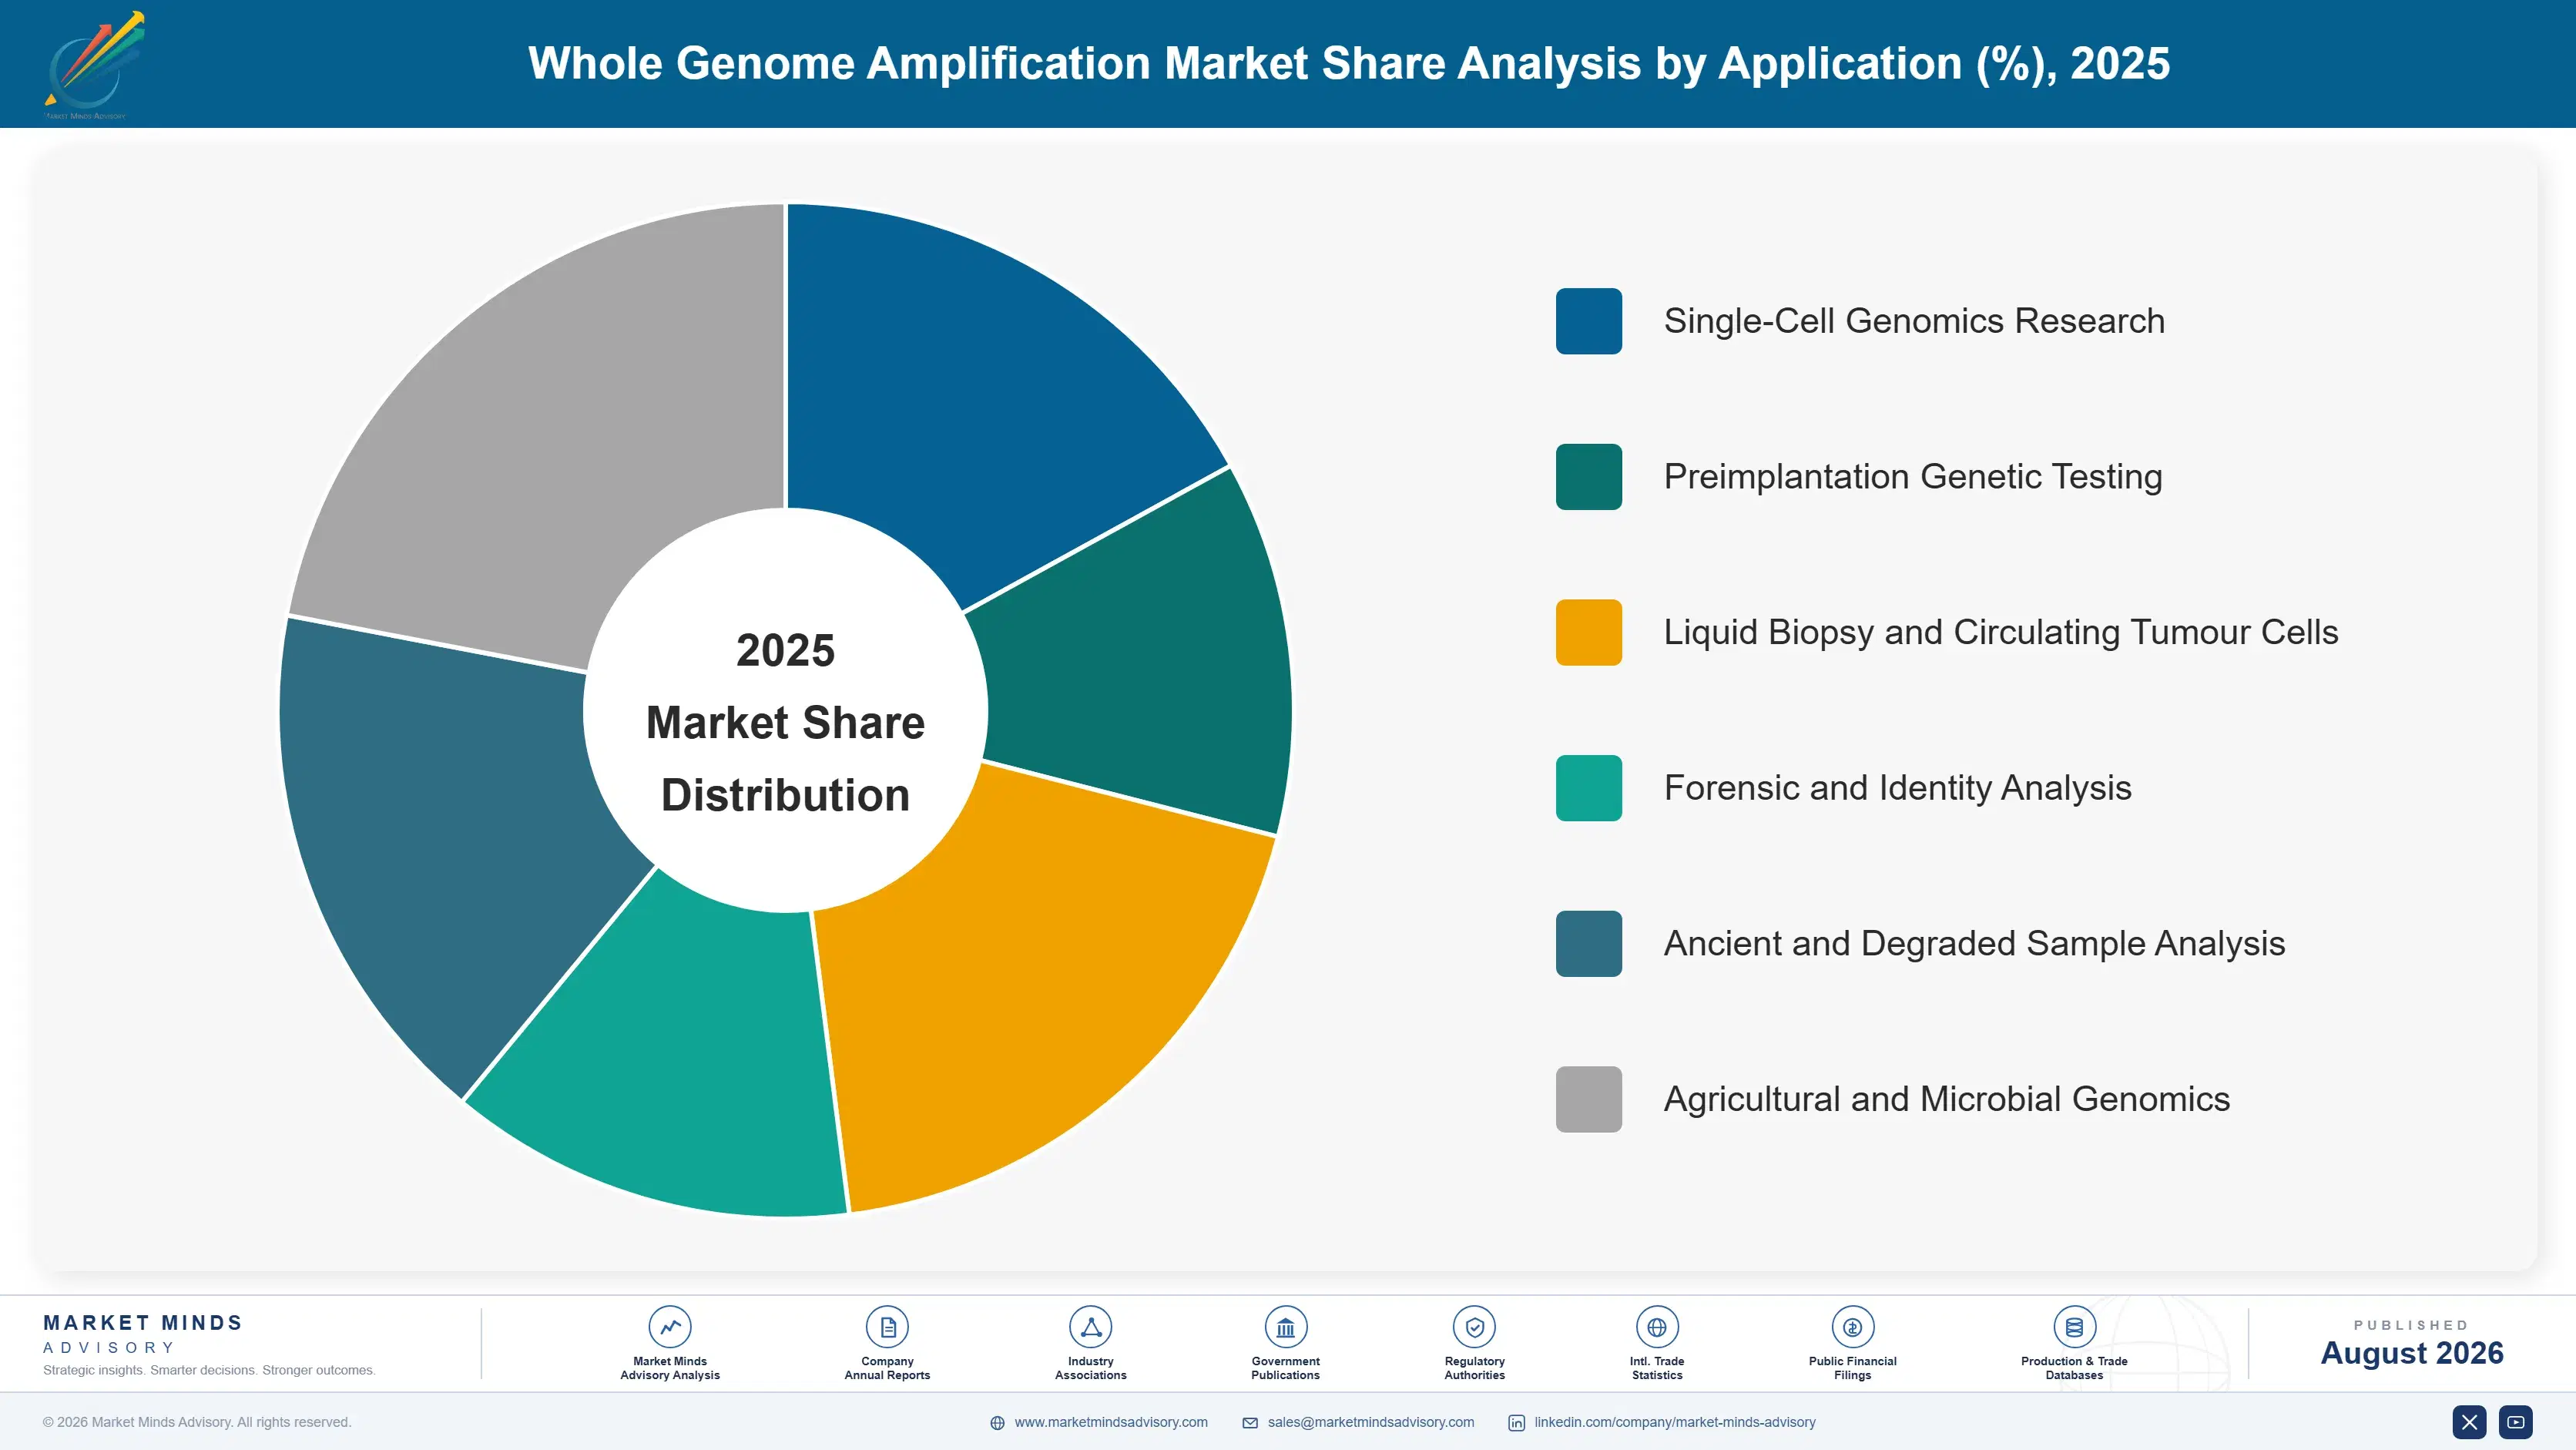
Segmentation follows application, since the application determines which amplification bias a laboratory can tolerate, what validation is required and whether the buyer is a researcher or a clinical service. Six applications cover the category as used. Growth tracks where sample input is scarce rather than where genome analysis is expanding generally. Scarce sample input decides everything.
whole-genome-amplification-market-market-share-analysis-1787665061443

Single-Cell Genomics Research

Amplification supporting single-cell genome and copy number analysis across developmental biology, neuroscience, oncology research and microbial genomics. At 14.1% this is the fastest growing application, half again the market rate of 9.4%, driven by falling sequencing cost pushing experiments from tens of cells toward thousands. Scale changes the technical requirement as well as the volume, since coverage bias that averages out across thousands of cells matters far less than it does across a handful. This is also the application most exposed to direct library preparation, which already covers around 23% of single-cell workflows and continues advancing. Growth and displacement are therefore happening inside the same application at the same time.
CAGR 14.1%

Preimplantation Genetic Testing

Amplification from embryo biopsy material supporting aneuploidy screening and monogenic disease testing in reproductive medicine laboratories worldwide. Growth of 11.2% is second fastest in the category, driven by cycle volume and by expanding use of monogenic testing alongside routine aneuploidy screening. Allele dropout near 7.4% is a clinical rather than analytical concern here, since a false negative can result in transferring an embryo carrying the condition tested for. The reagent represents roughly 4% of cycle cost, so laboratories select on validated performance and accreditation evidence rather than on price. Positions here take years to establish and persist for years afterwards, since revalidating an accredited workflow is a process nobody reopens without genuine cause.
CAGR 11.2%
Full segment breakdown across 6 segments available in the complete report.

Regional Architecture and Country Demand Map

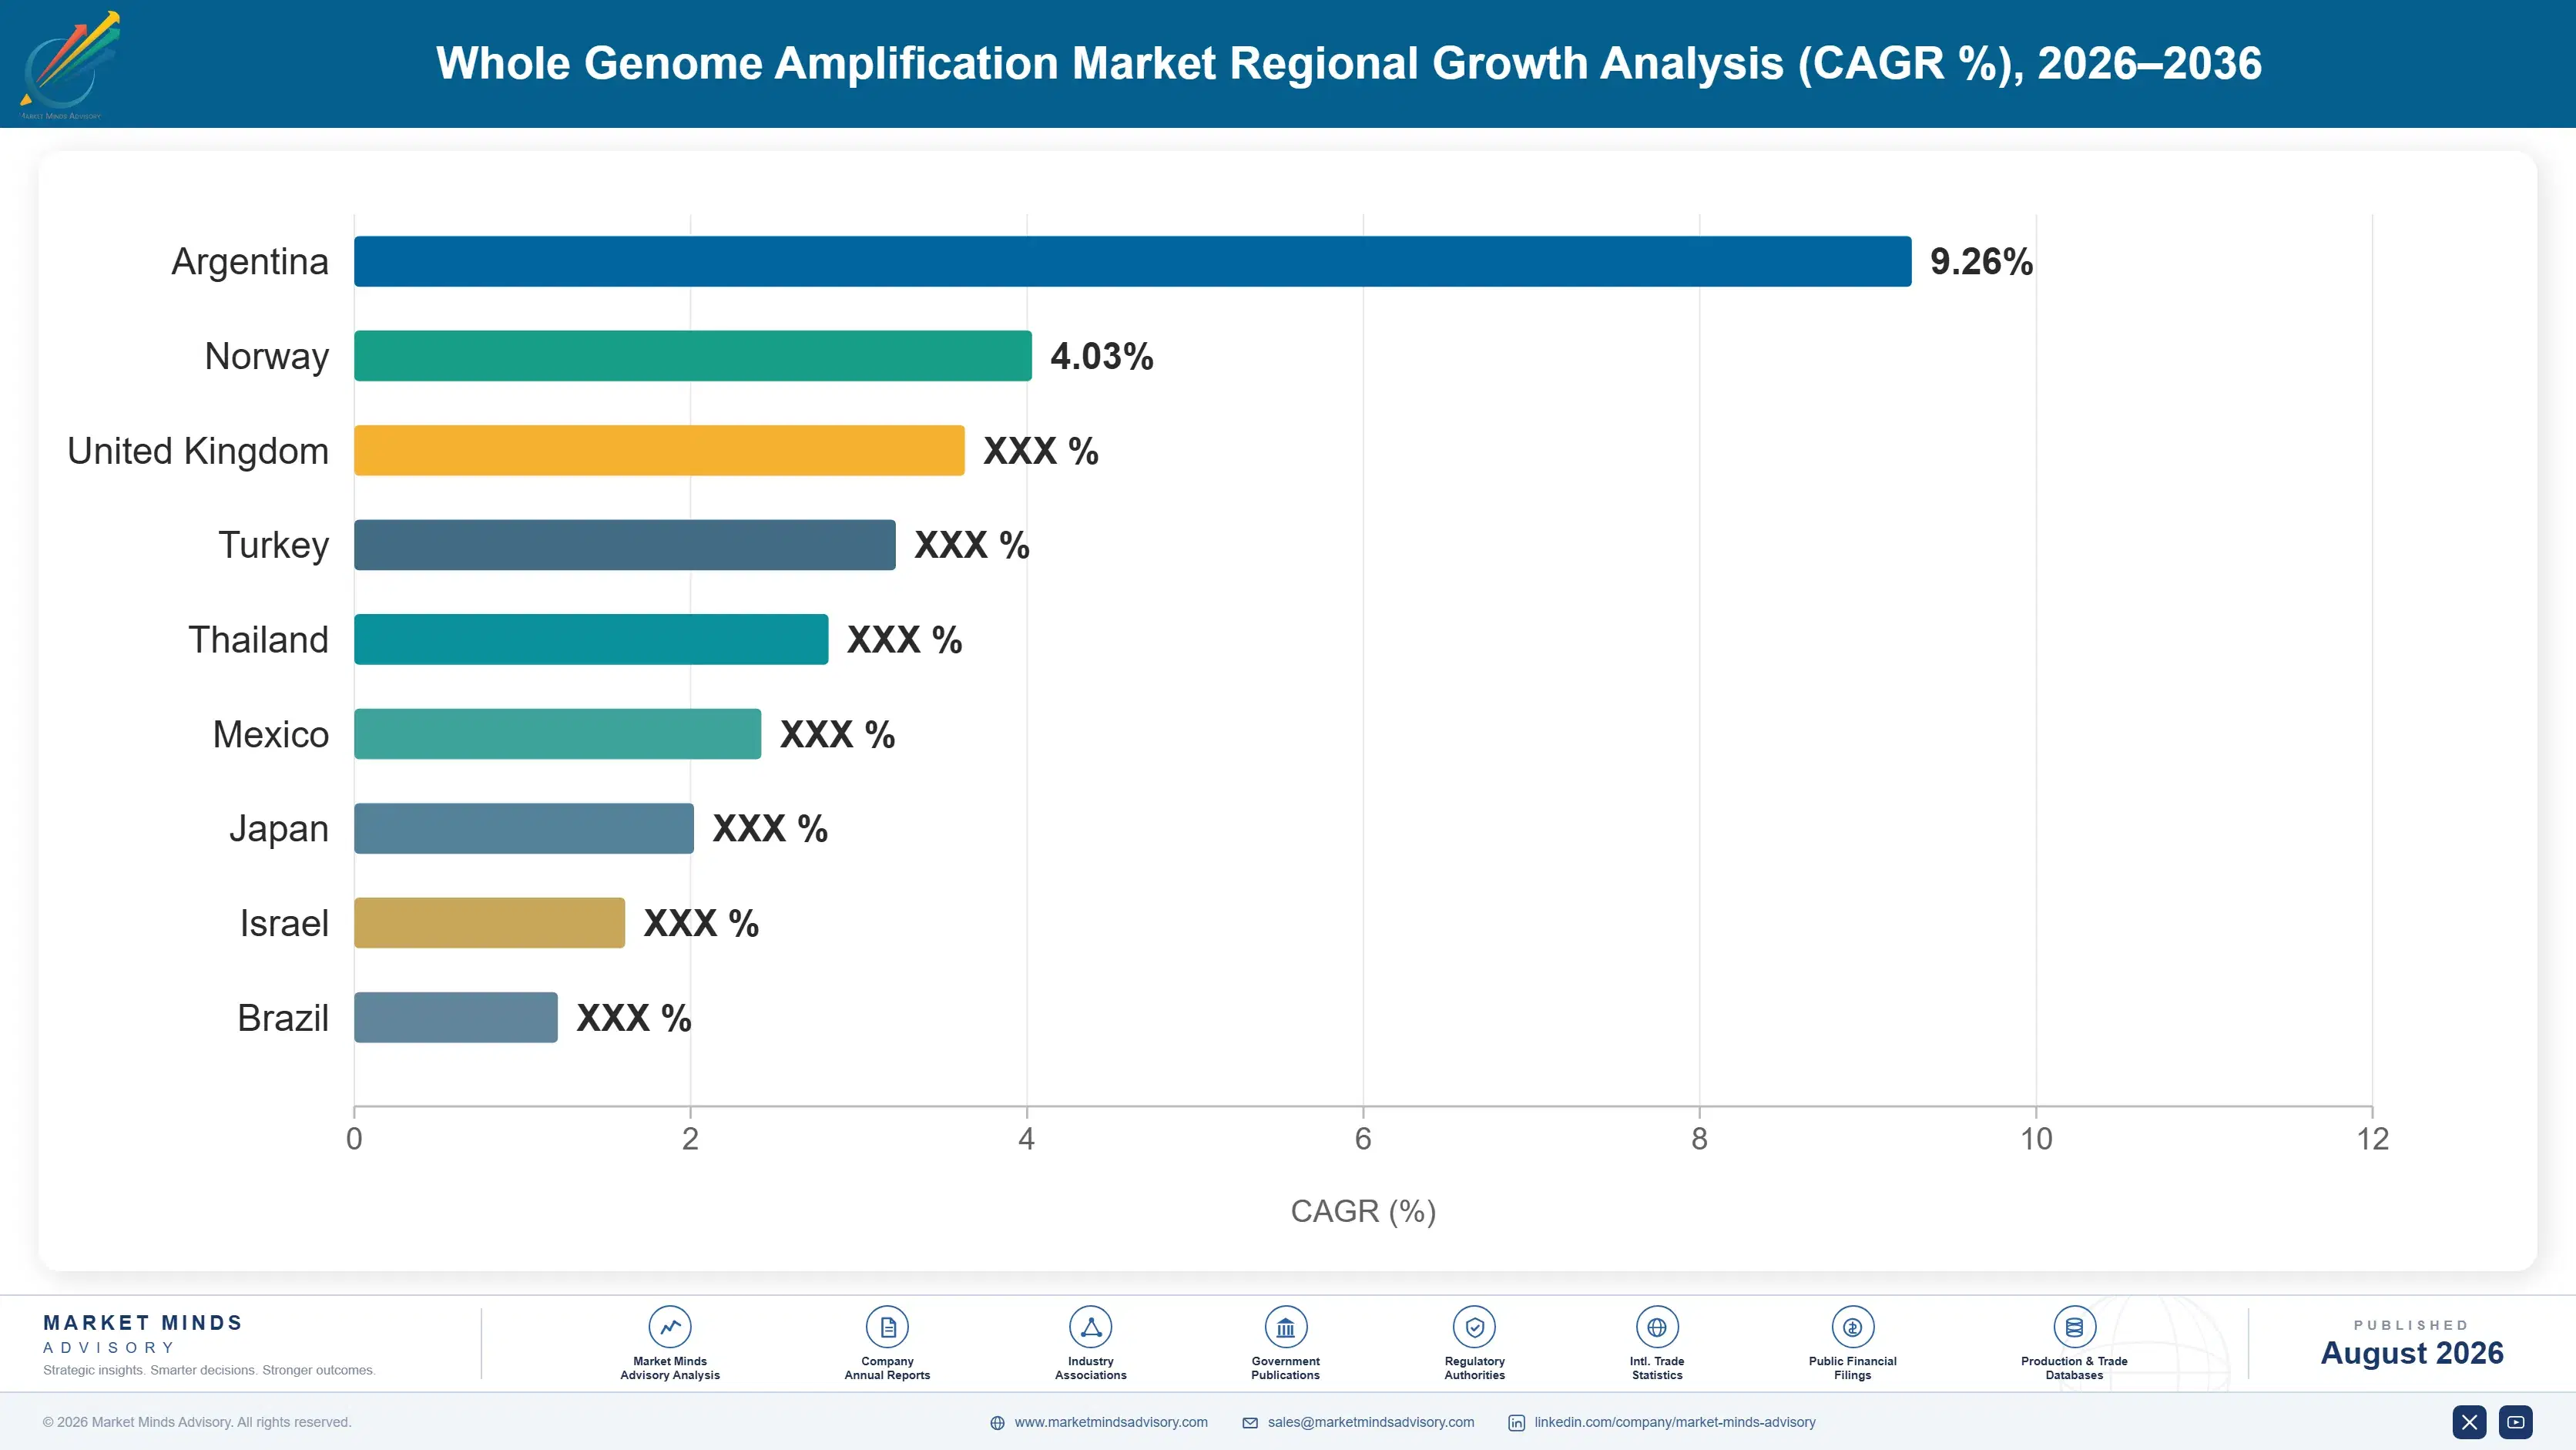
North America holds 32% on research funding density and reproductive genetics revenue, with East Asia close behind at 28% and growing considerably faster. Western Europe follows at 20%. China grows fastest at 13.8%. Research funding density and clinical testing volume pull in quite different directions here.

North America

Research funding density and reproductive genetics revenue together carry this 32% share, with academic single-cell programmes concentrated here and fertility laboratory pricing higher than anywhere else. Most of the chemistry itself was developed in this market and several suppliers retain their technical centres here. Clinical laboratory accreditation requirements have pushed attention onto allele dropout performance more formally than in most regions. Direct library preparation adoption is also furthest advanced, which makes the region a leading indicator of displacement risk. Growth of 8.4% reflects a mature base advancing rather than expanding rapidly. Displacement risk and research density arrive together in this market, which is uncomfortable. Whatever happens here happens elsewhere afterwards.
Share: 32% | CAGR: 8.4% (2026 to 2036)

Western Europe

Academic research and clinical genetics share this 20% share fairly evenly, with strong single-cell programmes in the United Kingdom, Germany, Netherlands and the Nordic countries. Reproductive genetics is regulated more tightly here than in most regions, with monogenic testing indications defined nationally and accreditation requirements that favour suppliers holding validation evidence. Public research funding cycles determine academic reagent purchasing and move on timelines suppliers cannot forecast. Growth of 7.8% is the lowest of the seven regions and reflects funding constraint rather than any technical hesitation about the applications. Regulation rather than research capability is what shapes the clinical half of this regional market. Funding cycles shape the other half entirely.
Share: 20% | CAGR: 7.8% (2026 to 2036)
Regional intelligence for 5 additional markets available in the complete report: East Asia, South Asia and Pacific, Latin America, Middle East and Africa, Eastern Europe. Contact sales@marketmindsadvisory.com.
whole-genome-amplification-market-country-cagr-analysis-1787665061963

Where This Category Actually Earns

Nothing here is won on amplification quality alone, because every chemistry fails somewhere and laboratories know exactly where. Value accrues to whoever matches failure mode to application, whoever owns dropout performance clinically, whoever integrates before being designed out, and whoever reaches expanding cycle volume. Four routes carry weight. Displacement rather than competition is the real threat.

Match The Failure Mode To The Application

Displacement chemistry delivers yield and long fragments with coverage uniformity near 0.62, polymerase chain methods deliver uniformity with fragments too short for some analysis, and no chemistry does both. Laboratories select the failure they can tolerate rather than the product that performs best, which means a supplier selling one chemistry into every application is losing most of those conversations. Application specific formulation and honest performance data reach the technical buyer, while general purpose positioning reaches nobody in particular at all. Roughly 7.4% dropout and 0.62 uniformity are the two numbers that decide most evaluations.
Market Impact: Coverage uniformity varies around 0.62 between chemistries used

Own Allele Dropout Where It Decides Outcomes

Dropout near 7.4% is a data quality issue in research and a clinical one in preimplantation testing, where a false negative can mean transferring an embryo carrying the condition being tested for. Accreditation bodies and reproductive genetics societies have focused on it directly. Suppliers demonstrating dropout performance across validated panels hold clinical laboratory positions research grade chemistries cannot approach, and those positions persist because revalidating a clinical workflow is expensive and slow for the laboratory involved. That is why the reagent representing 4% of cycle cost still decides which supplier a laboratory uses.
Market Impact: Owns documented performance on the 7.4% allele dropout

Integrate Into Workflows Before Being Designed Out

Around 23% of single-cell workflows already proceed directly to library preparation without discrete amplification, because the step contributed bias rather than information and chemistry improved enough to skip it. That is displacement rather than competition, and no amount of price or promotion answers it. Suppliers whose chemistry sits inside a validated end to end workflow with downstream analysis are substantially harder to remove than those selling a reagent that a protocol change simply deletes from the bench. Integration work is slow, unglamorous and the only defence that actually holds in this category.
Market Impact: Answers displacement now affecting 23% of single-cell workflows

Follow Cycle Volume Into Chinese Genetics Laboratories

Chinese research institutions and clinical genetics laboratories have expanded together, with single-cell capability growing alongside one of the largest reproductive testing volumes anywhere, and China grows at 13.8%. Domestic suppliers compete effectively on price in research applications, so the route in is clinical work where validated performance and accreditation evidence decide selection rather than reagent cost. The clinical half also carries considerably better economics, since the kit represents roughly 4% of what a testing cycle costs. Domestic suppliers are moving into clinical validation too, which narrows that window considerably each year.
Market Impact: Captures the 13.8% Chinese growth rate through 2036

Who Controls the Margin Pool

Concentration is moderate and divided by chemistry heritage. The top five hold 54% of reagent revenue, the basis applied consistently throughout this section, across a field mixing large tools companies that acquired amplification chemistries, specialist developers and Chinese suppliers competing on price and increasingly on performance. QIAGEN leads on breadth across sample preparation and amplification together, and the gap reflects distribution and workflow position rather than any chemistry advantage at all.
Competition runs on three fronts. Tools companies compete by embedding amplification inside broader sample preparation and sequencing workflows, which is the position that survives displacement. Specialist developers compete on chemistry performance in applications where bias genuinely matters. And single-cell platform companies compete from outside by removing the amplification step entirely from the protocols they publish.

Rankings will move with workflow integration rather than with chemistry improvement, since a supplier whose reagent is one validated step inside a longer process is far harder to displace than one selling a kit a protocol update can delete. The other pressure point is clinical validation depth, which decides reproductive genetics positions where price is almost entirely irrelevant to the outcome.
whole-genome-amplification-market-company-positioning-matrix-1787665062524

Competitive Moat and Risk Dimensions

QIAGEN

Moat: Sample Preparation Workflow Position

Holding sample preparation, extraction and amplification within one validated workflow makes the amplification step considerably harder to remove than a standalone kit, since deleting it means revalidating everything around it. Clinical laboratory relationships built through diagnostics businesses reach exactly the customers where validation evidence rather than price decides reagent selection.
QIAGEN

Risk: Single-Cell Platform Competition

Dedicated single-cell platform companies design their protocols without a discrete amplification step, which removes the product rather than competing with it. That displacement already covers around 23% of single-cell workflows and advances with each improvement in library chemistry, in the application growing fastest at 14.1% across the whole category.
THERMO FISHER SCIENTIFIC

Moat: Clinical Laboratory Distribution Reach

Distribution and service relationships across clinical genetics and reproductive medicine laboratories provide access to accounts where accreditation evidence and validated performance decide selection rather than reagent pricing. Breadth across sequencing, sample preparation and analysis lets amplification be sold as one component of a qualified process rather than as a separate purchase.
THERMO FISHER SCIENTIFIC

Risk: Limited Chemistry Differentiation

Amplification chemistry itself offers limited differentiation, since every approach carries a known bias profile and laboratories select on application fit rather than on brand. Chinese suppliers competing at lower price in research applications erode the volume half of the business while clinical positions depend on validation work that specialists also perform.

Players Tracked

Prominent Players

QIAGEN
Thermo Fisher Scientific
Takara Bio
Bio-Rad Laboratories
Yikon Genomics

Other Key Players

Illumina
10x Genomics
Cytiva
Merck KGaA
New England Biolabs
Promega
Agilent Technologies
PacBio
BGI Genomics
MGI Tech
Vazyme Biotech
Singleron Biotechnologies
Mission Bio
Standard BioTools
Parse Biosciences

Recent Developments

FEBRUARY 2025

Single-cell platform releases protocol removing discrete amplification step

A single-cell platform company released a protocol proceeding directly from cell lysis to library preparation without discrete whole genome amplification, citing improved data quality from removing an intermediate bias source. Around 23% of single-cell workflows already skip that step entirely across the field. Data quality improved without it.
Signal: Displacement removes the product rather than competing with it, which no pricing answers at any price point
MAY 2025

Reproductive genetics society issues guidance on dropout validation

A reproductive genetics society issued guidance on allele dropout validation requirements for preimplantation monogenic testing, formalising expectations laboratories had applied inconsistently. Dropout runs near 7.4% depending on chemistry and locus, and a false negative can mean transferring an affected embryo. Laboratories had applied their own standards previously.
Signal: Formal validation requirements advantage suppliers who already generated the performance evidence long before it was required
SEPTEMBER 2025

Chinese supplier expands clinical validation for reproductive genetics chemistry

A Chinese reagent supplier expanded clinical validation work for its amplification chemistry in reproductive genetics, moving beyond the research applications where domestic suppliers had competed largely on price. China grows at 13.8% annually, faster than any market covered in this report. Price had been the previous basis of competition.
Signal: Domestic suppliers moving into validated clinical work changes the competition considerably for international suppliers holding those positions

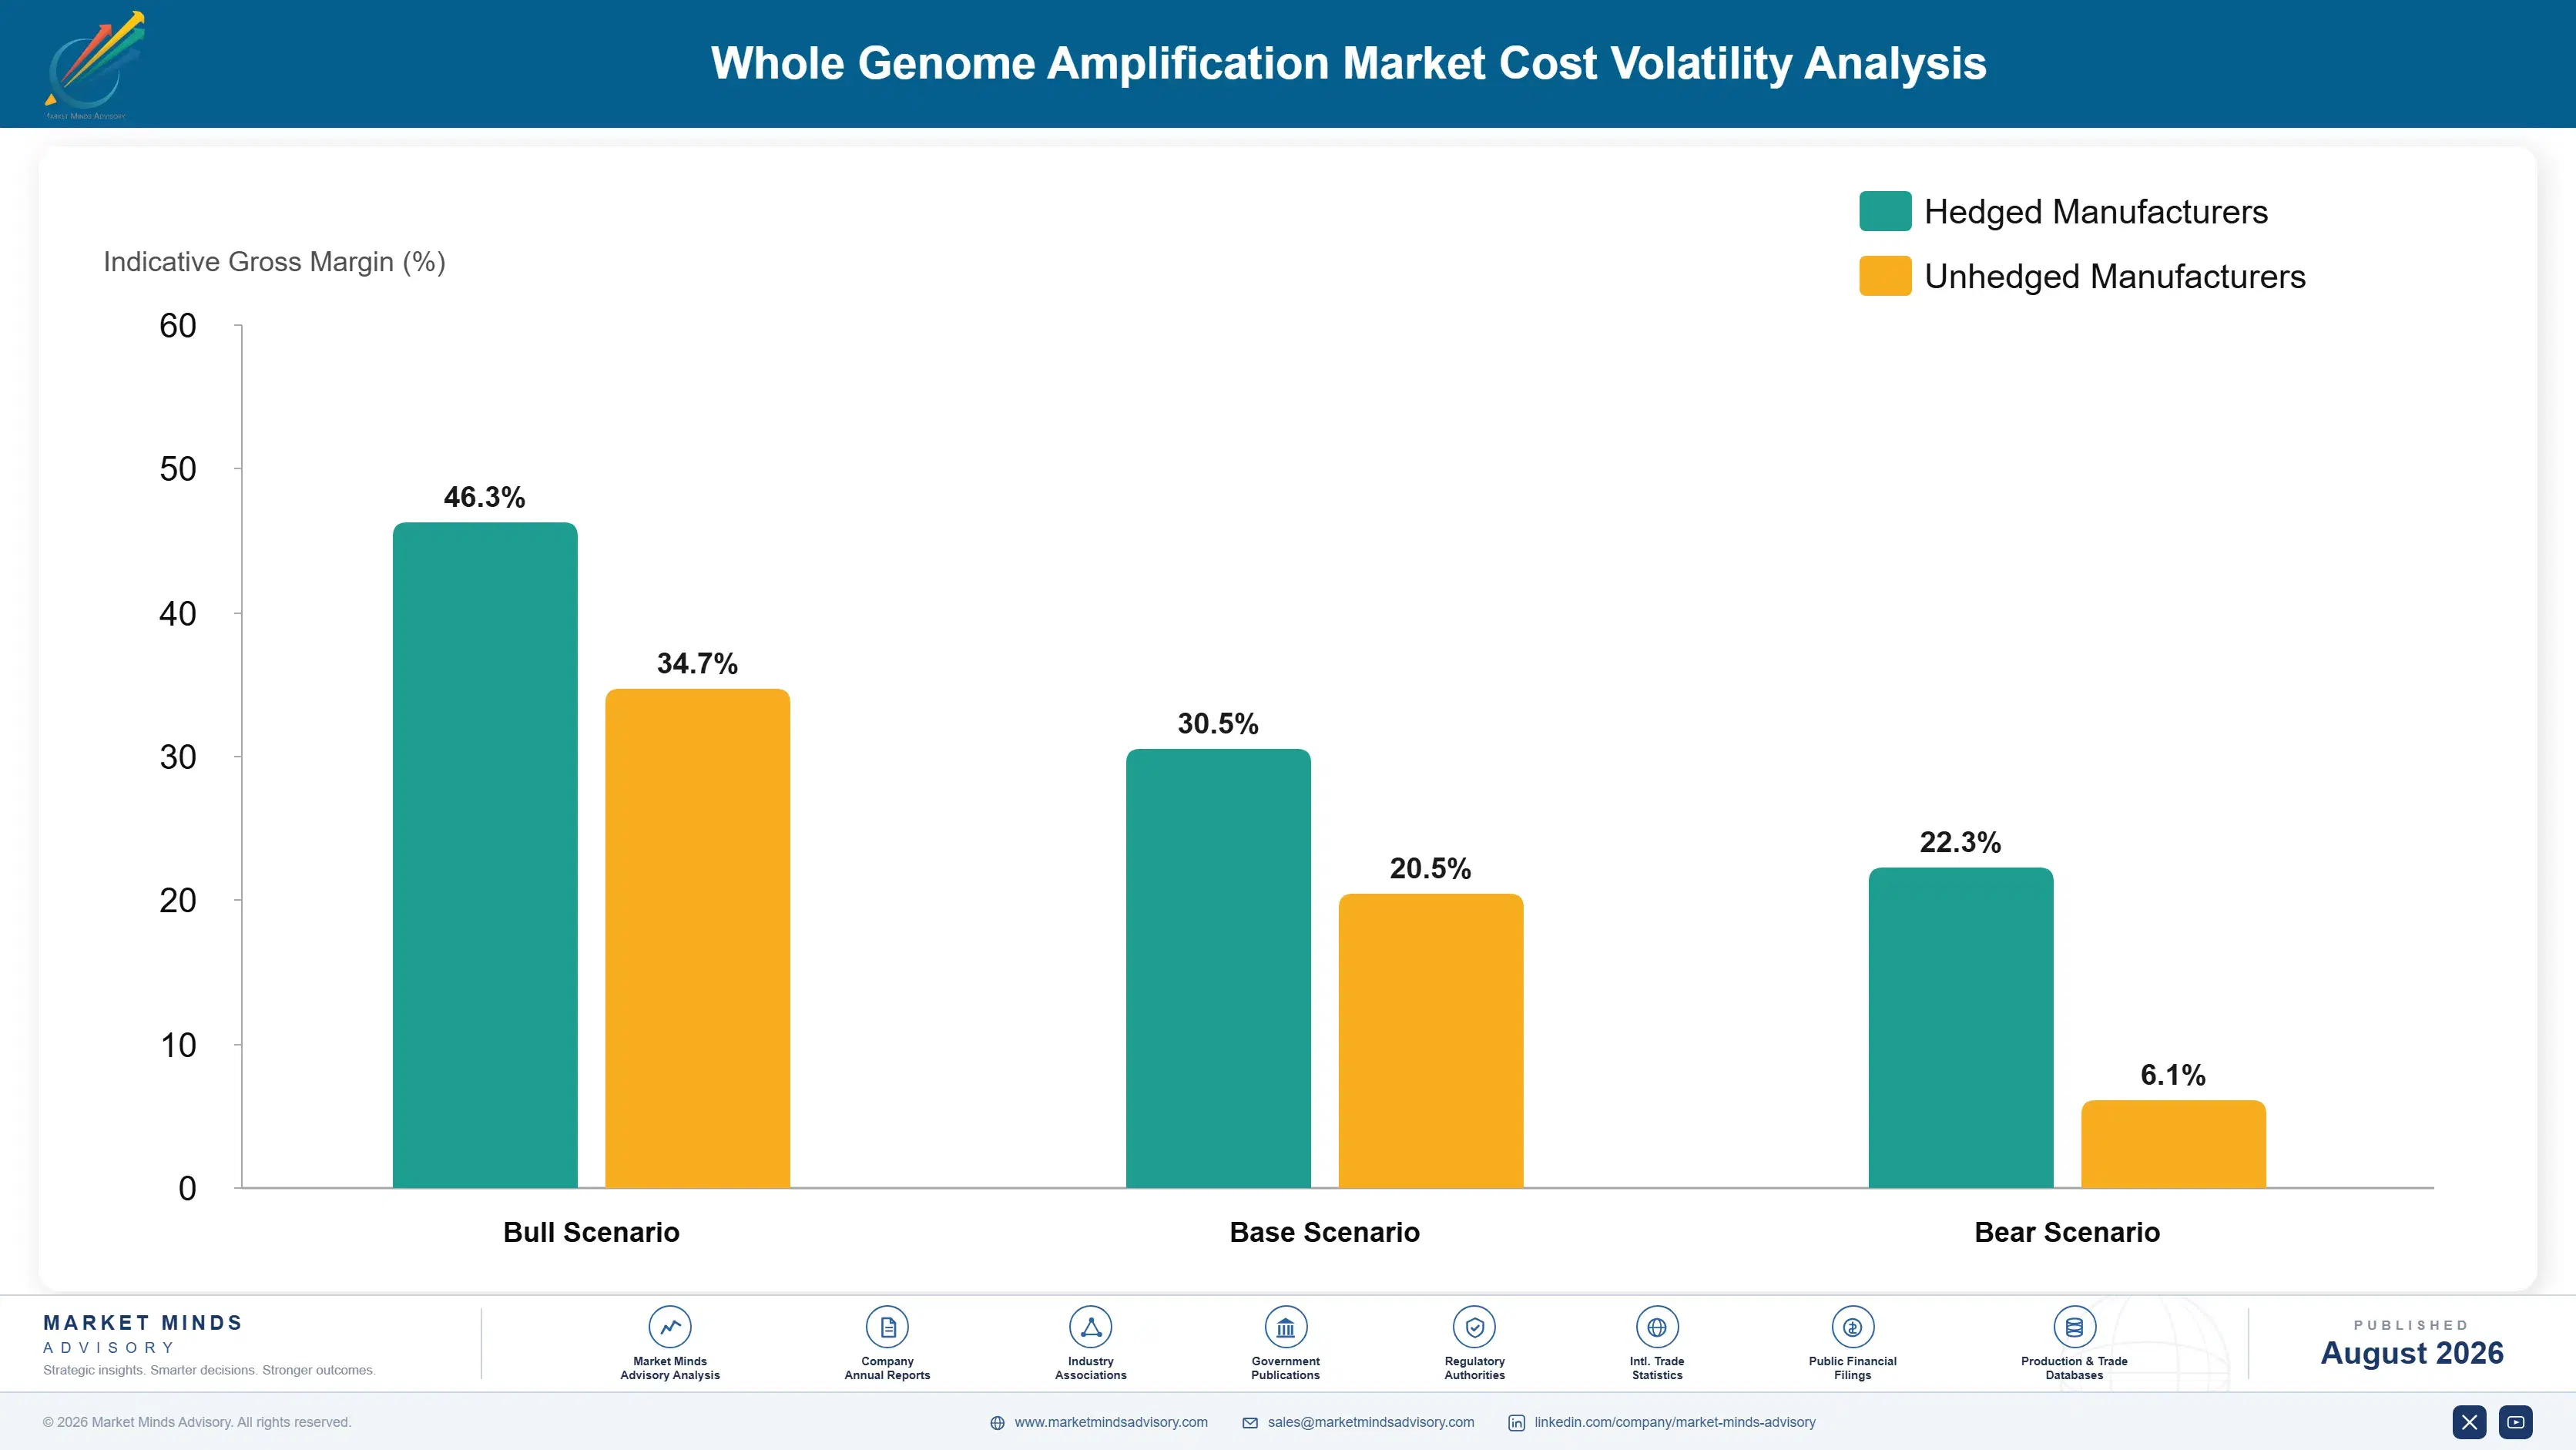
What Amplification Reagents Cost

Enzymes account for 43% of reagent cost of goods, with oligonucleotides at 21% and nucleotides, buffers, plastics and quality control carrying the remainder. Displacement chemistry depends on a specific polymerase produced by fermentation at a small number of facilities, and oligonucleotide synthesis capacity is similarly concentrated. Neither input is expensive per reaction; both are difficult to obtain quickly when demand across the wider industry moves sharply.
The pandemic demonstrated that precisely. Enzyme fermentation and oligonucleotide synthesis capacity was diverted into diagnostic testing at scale, and research reagent supply tightened for two seasons regardless of price. Life science tools company annual reports documented allocation, lead time extension and capacity investment through the period, while FDA emergency authorisations shaped where the industry's capacity actually went during the disruption itself. Nobody could buy their way past it.

Exposure divides by supply relationship rather than by scale. Suppliers producing enzymes internally or holding long term fermentation agreements continued shipping, while those buying on the merchant market queued behind diagnostic customers with far larger orders. That difference decided which research reagent brands held their positions through the shortage, and the ones that lost customers during it have generally not recovered them since.
whole-genome-amplification-market-cost-volatility-analysis-1787665062720

Secure enzyme fermentation capacity on multi-year agreements

Enzymes are 43% of reagent cost and displacement chemistry depends on a polymerase produced at a small number of fermentation facilities, which makes availability rather than price the exposure that matters. Suppliers holding long term agreements continued shipping through the last disruption while merchant buyers queued behind diagnostic customers. Customers lost during a shortage rarely come back afterwards.

Build application specific formulations rather than one general kit

Every chemistry carries a known bias profile and laboratories select the failure mode their application tolerates, which means a single general purpose product loses most technical evaluations it enters. Application specific formulations cost development effort and reach buyers who have already decided what they need. General purpose positioning appeals to nobody in particular and competes on price by default.

Embed chemistry inside a validated workflow with analysis

Around 23% of single-cell workflows already skip discrete amplification, which is displacement rather than competition and no pricing response addresses it. A reagent sitting inside a validated end to end workflow with downstream analysis cannot be deleted without revalidating everything around it. That integration work is the only durable defence available against a protocol change.

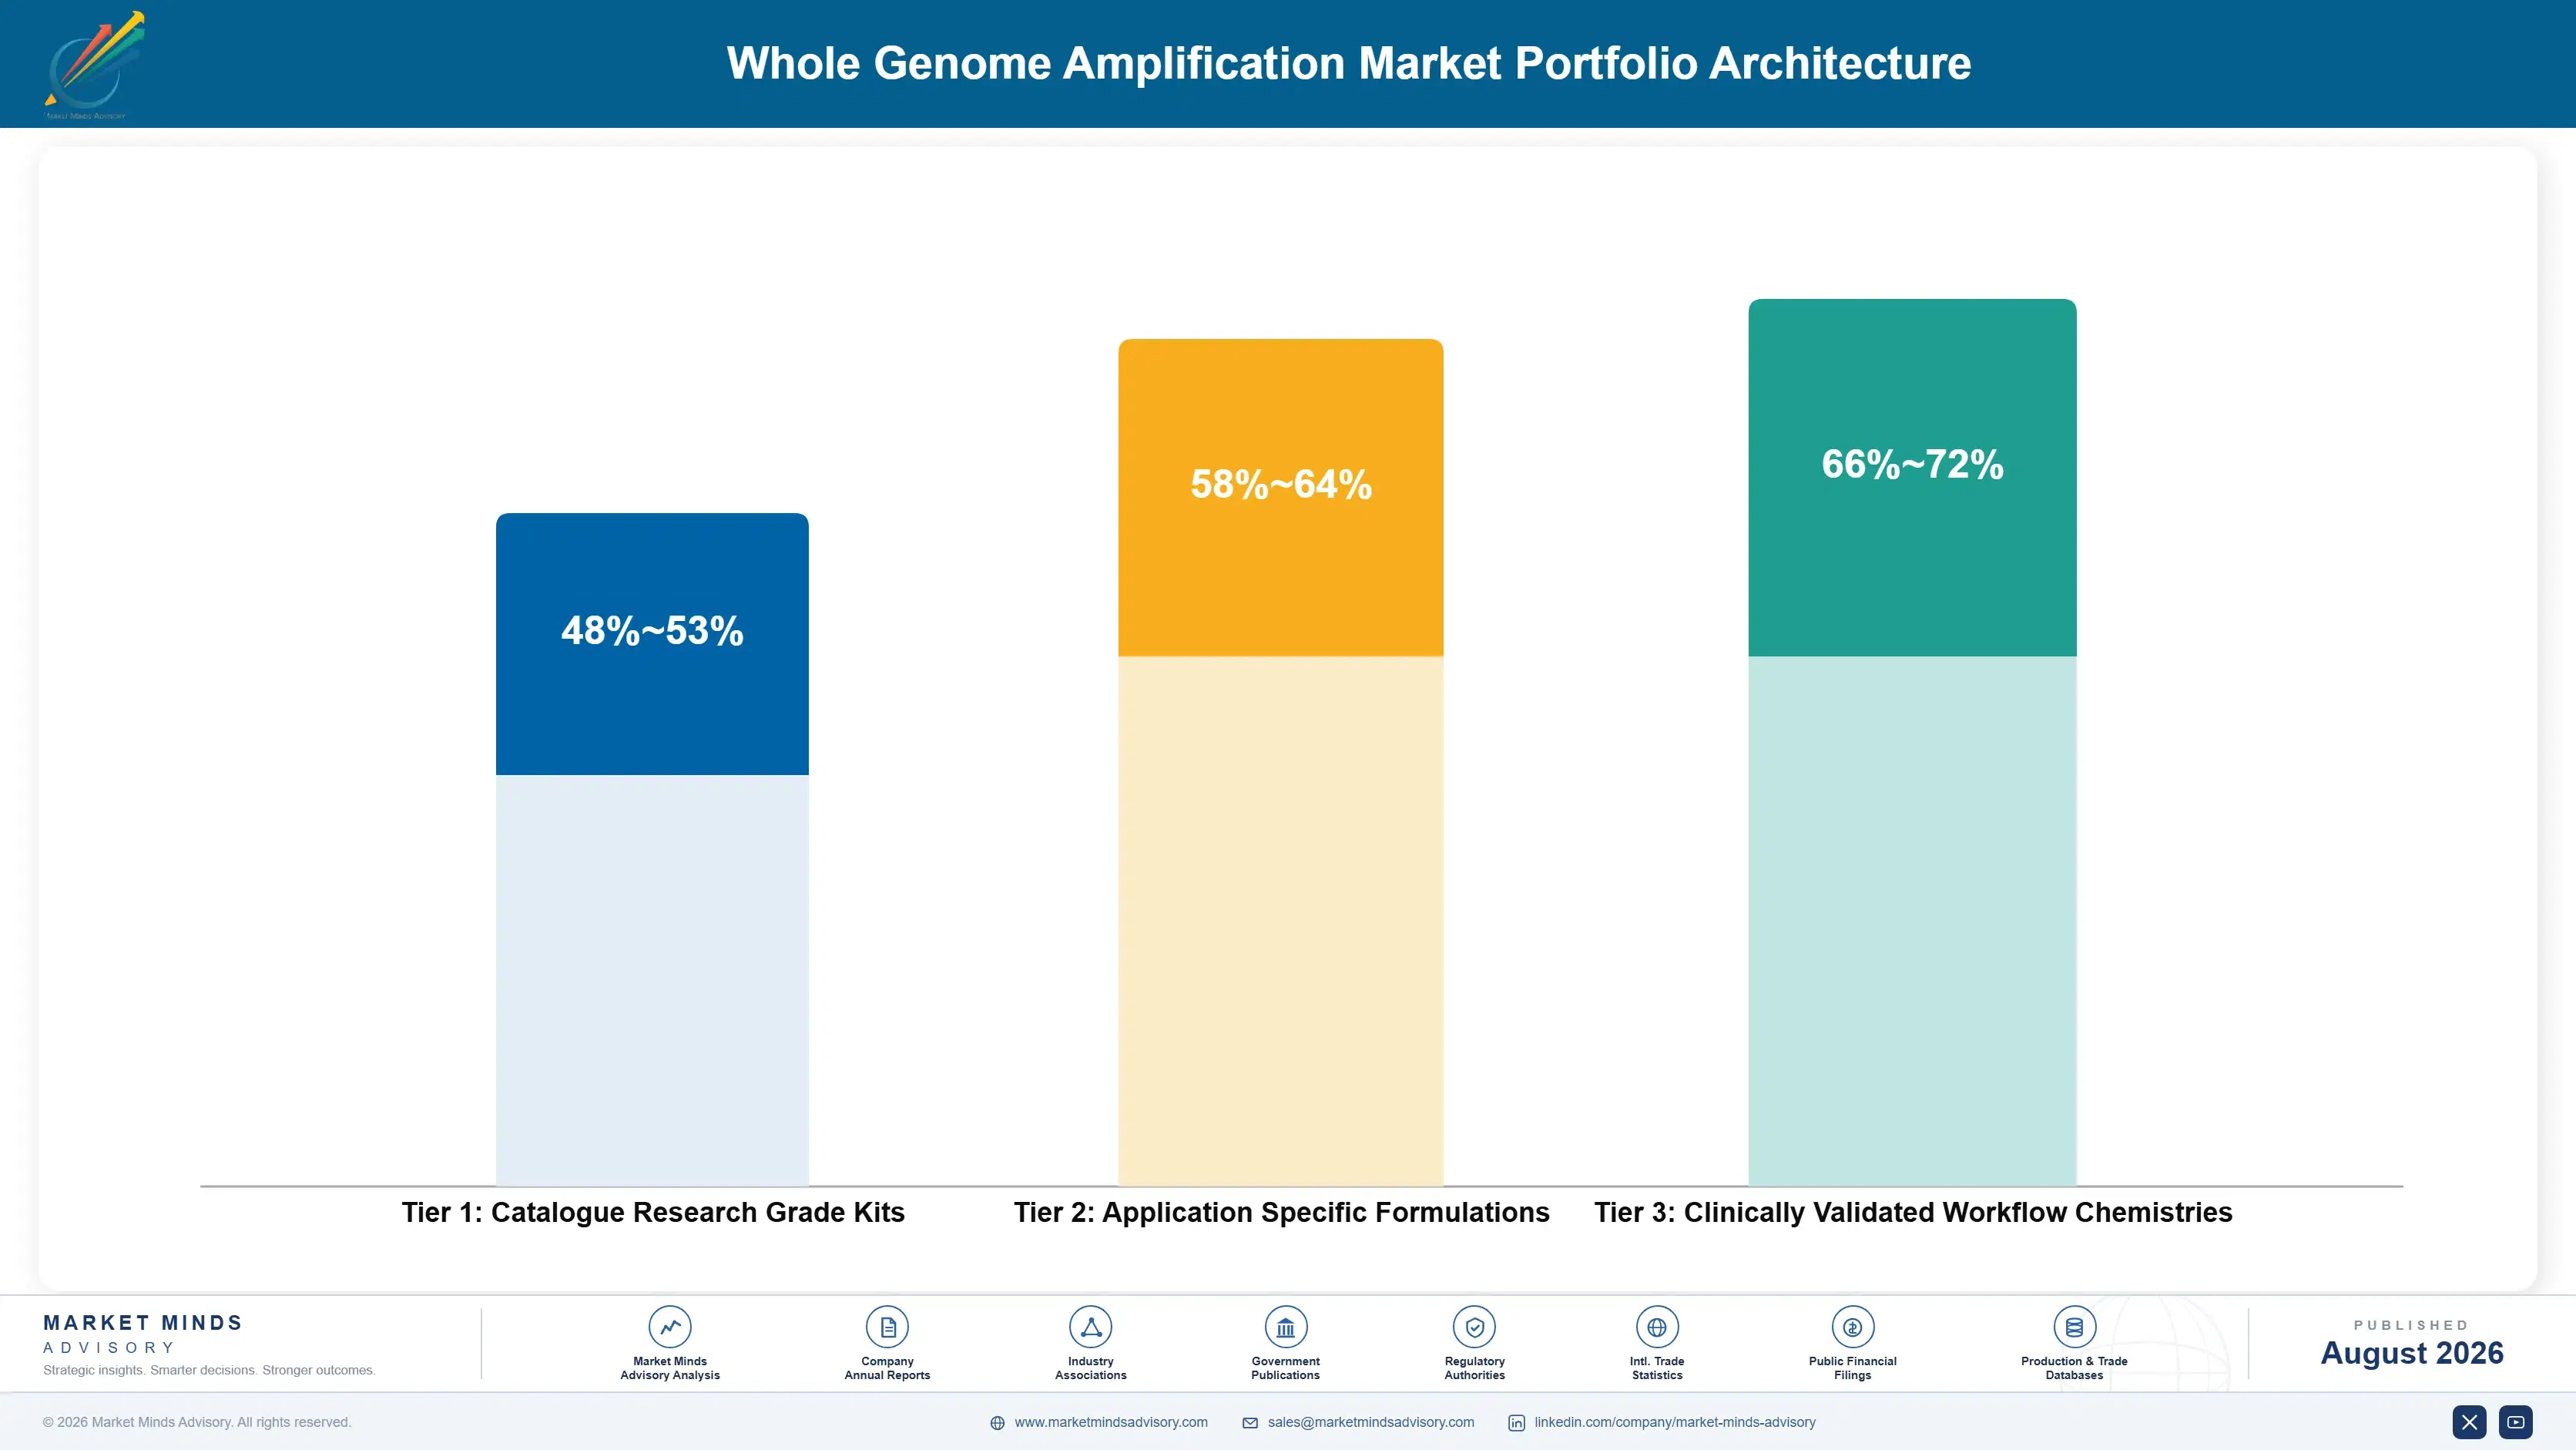
Portfolio Architecture for Margin Defence

Margin architecture divides on validation rather than on chemistry cost. Research grade kits sold on catalogue earn moderately, competing against Chinese suppliers on price in applications where laboratories tolerate wider performance variation. Application specific research formulations earn better, since technical fit rather than price decides selection. Clinically validated chemistries earn best, because accreditation evidence and revalidation cost make substitution genuinely expensive for the laboratory rather than merely inconvenient.
The tension runs between volume and durability. Research volume is larger, grows faster at 14.1% and sits directly in the path of protocol changes that remove the amplification step altogether. Clinical volume is smaller, grows at 11.2% and is protected by validation work that takes years to replicate. A supplier weighted entirely toward research is growing quickly toward a position that may not exist.

High value pools concentrate in clinically validated chemistries and in workflow integrated positions, neither of which is a chemistry advantage. Everything sold as a standalone research kit competes on price against domestic suppliers and against protocols that delete the step entirely. The businesses worth building are those where removing the reagent means revalidating a process somebody has already accredited and does not wish to reopen.

Catalogue Research Grade Kits

General purpose amplification kits sold through catalogue and distribution into research laboratories that tolerate wider performance variation. Chinese suppliers compete effectively on price here and the technical evaluation is frequently brief.
Gross Margin: 48-53%

Application Specific Formulations

Chemistries formulated for particular applications where a specific bias profile suits the analysis being performed. Technical fit rather than price decides selection, and buyers arrive knowing precisely what performance they require.
Gross Margin: 58-64%

Clinically Validated Workflow Chemistries

Chemistries validated within accredited clinical workflows where dropout performance is documented and revalidation cost prevents casual substitution. Margin is highest because the reagent is 4% of cycle cost and selection follows evidence.
Gross Margin: 66-72%
whole-genome-amplification-market-portfolio-architecture-1787665063227

High-value Sub-segments and Strategic Watch-out

Single-Cell Genomics Research

Fastest growing application at 14.1% as sequencing cost falls and experiments scale toward thousands of cells. It is also the application most exposed to direct library preparation, which already covers around 23% of single-cell workflows. Growth and displacement run together inside this single application area.
Gross Margin: 50-56%

Preimplantation Genetic Testing

Second fastest at 11.2% and the most defensible position in the category, since dropout near 7.4% is a clinical rather than analytical concern. Validation evidence and accreditation decide selection while the reagent is 4% of cycle cost. Positions here take years to build and then last.
Gross Margin: 66-72%

Liquid Biopsy and Circulating Tumour Cells

Growing at 10.4% on rare cell analysis where input material genuinely limits what is possible without amplification. Clinical translation has been slower than expected and much of this volume remains in research and translational settings rather than routine diagnostics. Translation has consistently taken longer than expected.
Gross Margin: 58-64%

Ancient and Degraded Sample Analysis

Growing at only 4.2% in a small academic community where grant funding rather than commercial demand determines purchasing entirely. Technical requirements are demanding and volumes are negligible against every other application in this category. Nothing about that position changes at all across the forecast period.
Gross Margin: 44-50%

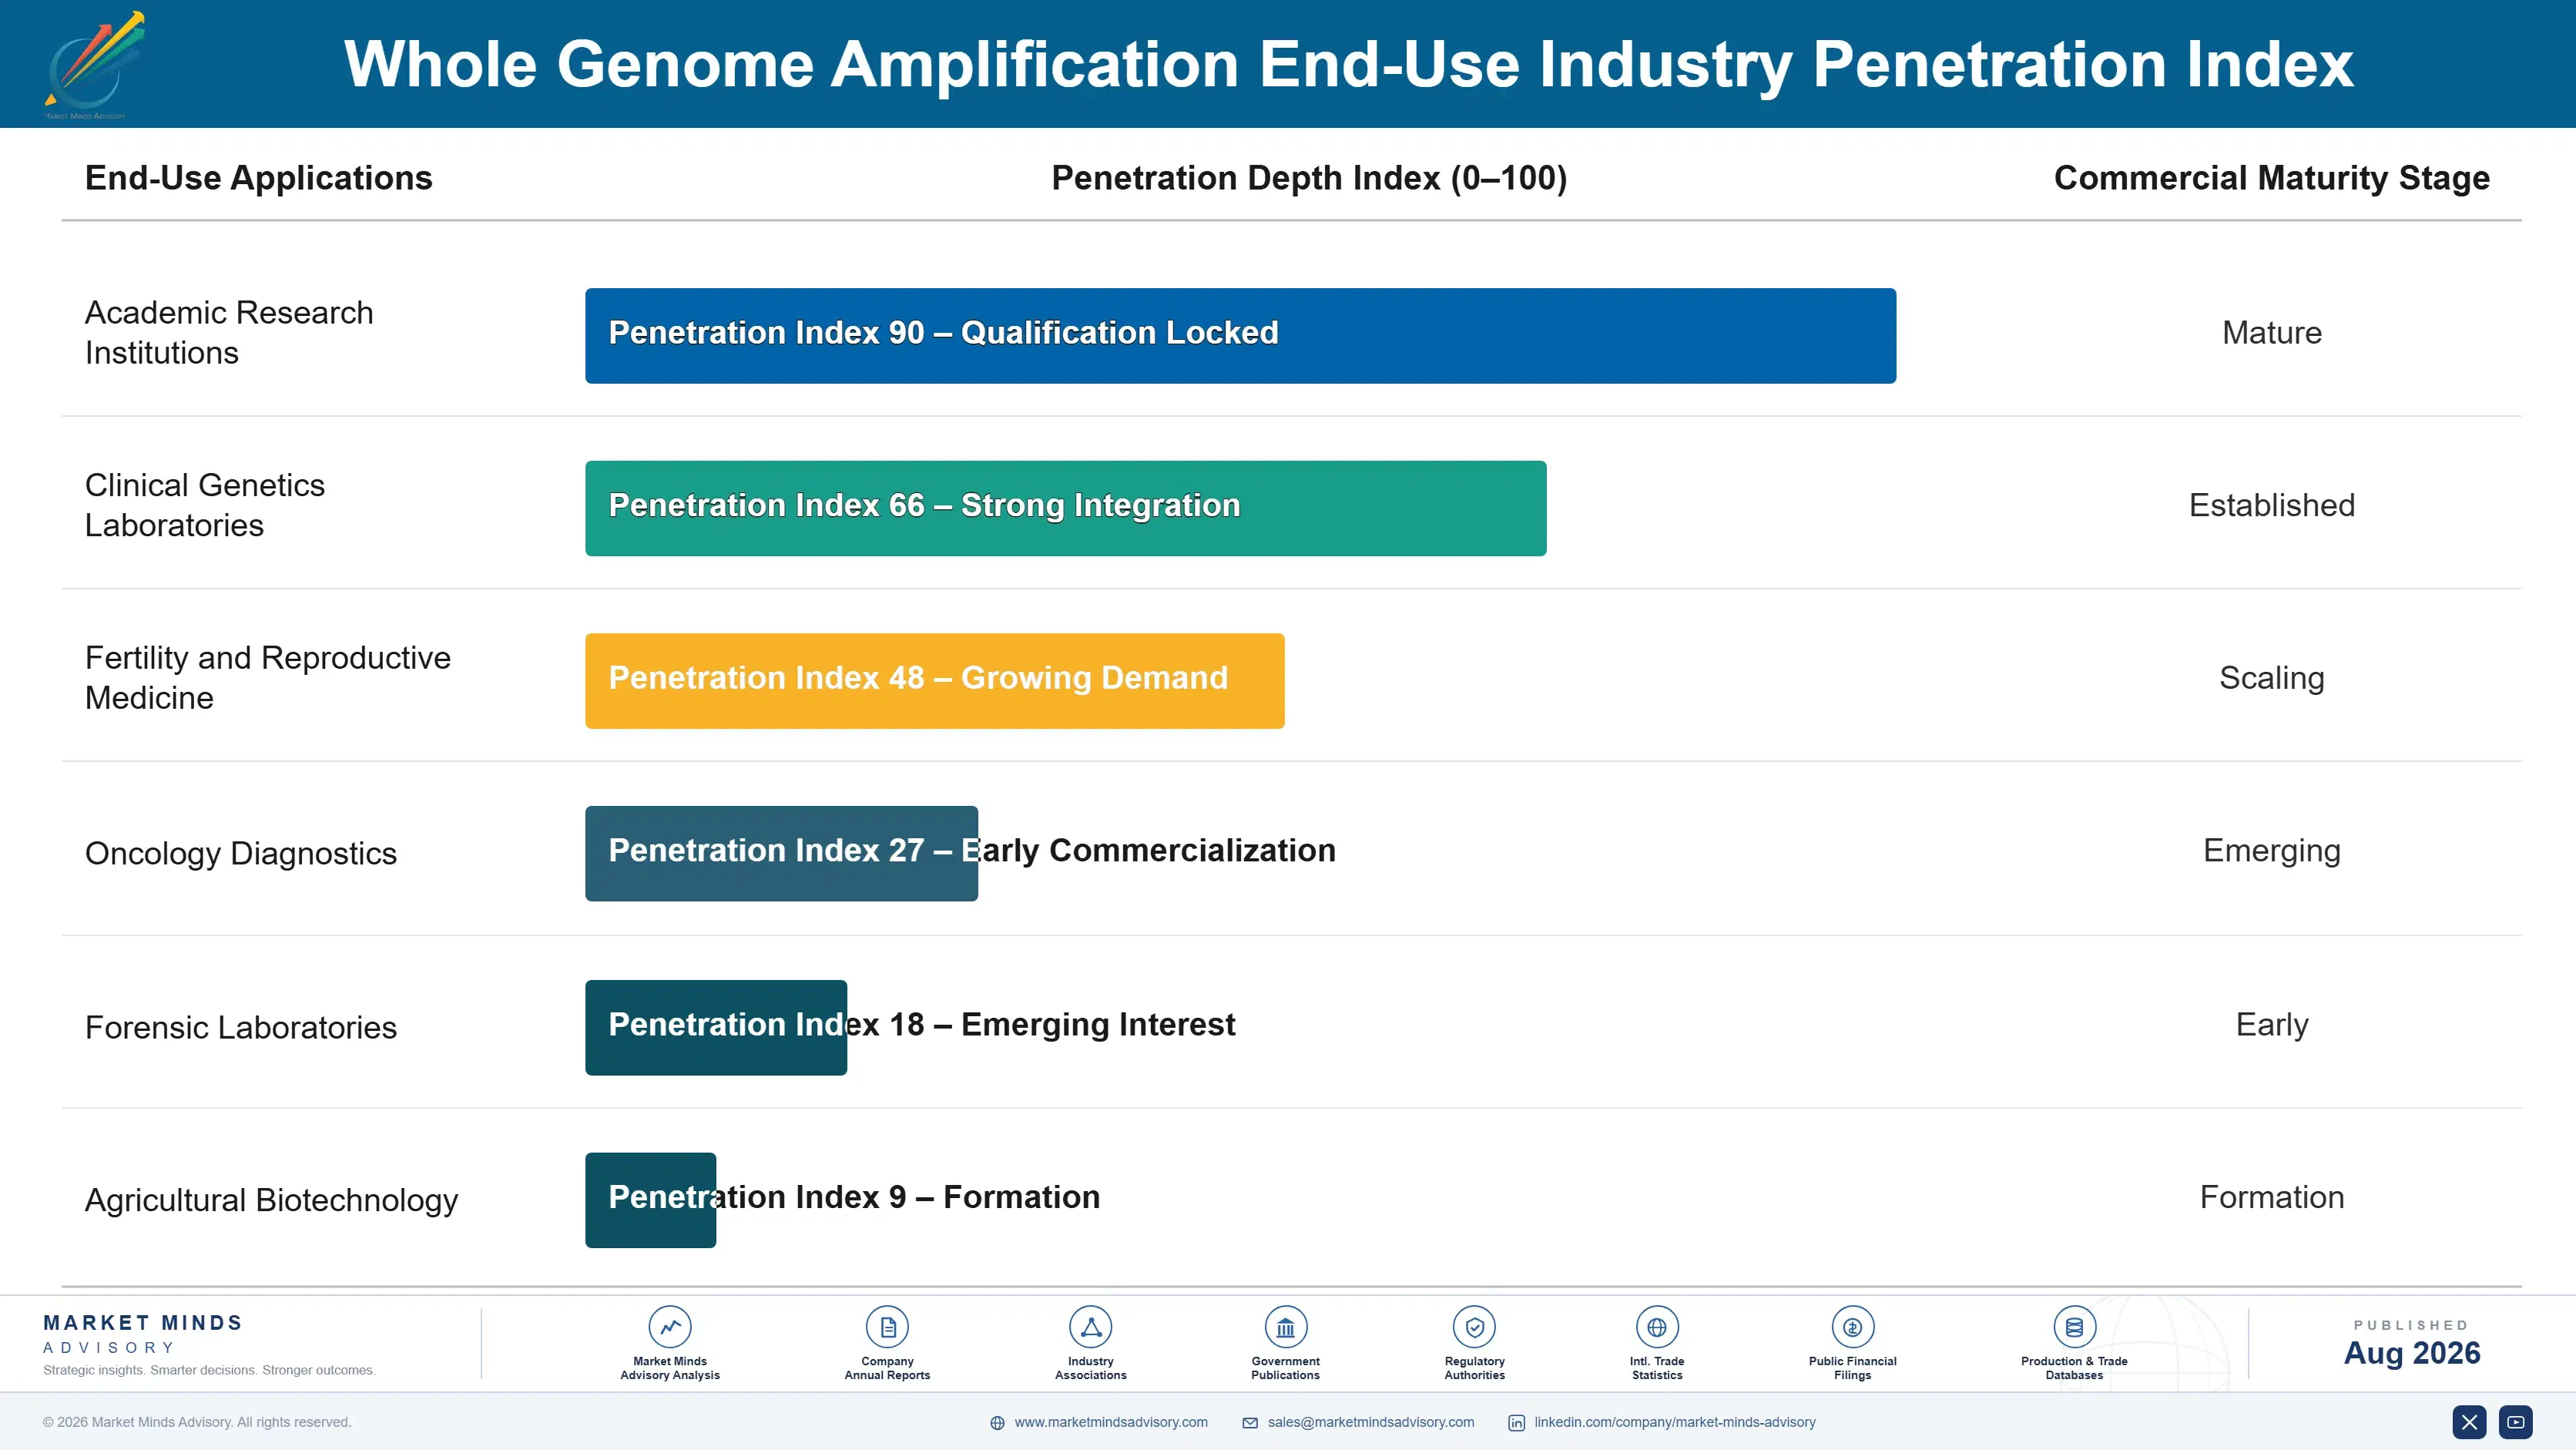
How Validated Protocols Hold Demand

Demand attaches to a written protocol rather than to a purchase preference. A laboratory validates an amplification chemistry within its own workflow, documents the performance it achieves, and then consumes that reagent for as long as the protocol runs. Changing chemistry means revalidating, which in a research setting costs weeks and in an accredited clinical laboratory costs considerably more, so protocols persist well beyond any commercial review cycle.
Stickiness therefore tracks validation depth almost exactly. Accredited clinical workflows in reproductive genetics are the most durable, since revalidation involves documented performance evidence and in some jurisdictions notification to an accrediting body. Application specific research protocols sit in the middle. Catalogue research purchasing is barely sticky at all, since a laboratory trying a cheaper kit risks only a failed experiment it would probably repeat anyway.

The buyer profile is dividing rather than shifting. Research purchasing has moved toward core facilities and platform managers who standardise across many users, while clinical purchasing sits with laboratory directors accountable for accredited performance. Those two buyers evaluate completely differently, and suppliers running one commercial approach across both consistently underperform against specialists addressing each on its own terms.
whole-genome-amplification-market-end-use-penetration-index-1787665063718

Where This Category Rewards Focus

These are among the four positions where our research anticipates prominent divergence between winners and laggards over the coming forecast period. Each is grounded in the demand model, the regulatory perimeter, and the announced capacity pipeline.
01 / BIAS PROFILE MATCHING

Sell the failure the customer can accept

Displacement chemistry delivers yield and long fragments with coverage uniformity near 0.62, polymerase chain methods deliver even coverage from fragments too short for structural analysis, and no chemistry manages both at once. Laboratories therefore select the failure mode their application tolerates rather than the product that performs best on any single measure. A supplier selling one chemistry into every application loses most technical evaluations it enters, while application specific formulation and honest performance data reach the buyer who has already decided.
02 / DROPOUT RATE OWNERSHIP

In the clinic a dropped allele is a diagnosis

Allele dropout running near 7.4% is a data quality issue in research and something considerably more serious in preimplantation testing, where a false negative can mean transferring an embryo carrying the condition being tested for. Accreditation bodies and reproductive genetics societies have formalised expectations around validating that performance specifically. Suppliers demonstrating dropout across validated panels hold clinical positions research grade chemistries cannot approach, and those positions persist because revalidating an accredited workflow is expensive and slow for the laboratory involved.
03 / WORKFLOW INTEGRATION URGENCY

A protocol update can delete your product

Around 23% of single-cell workflows already proceed directly to library preparation without discrete amplification, because the step contributed bias rather than information and library chemistry improved enough to skip it entirely. That is displacement rather than competition, and no amount of pricing or promotional activity provides any answer to it whatsoever. A reagent embedded inside a validated end to end workflow cannot be removed without revalidating everything around it, which is the only durable defence available to anybody selling into this category.
04 / CYCLE VOLUME ACCESS

Clinical volume pays where research volume grows

Chinese research institutions and clinical genetics laboratories have expanded together, with single-cell capability growing alongside one of the largest reproductive testing volumes anywhere in the world. China grows at 13.8%, faster than any market covered in this report. Domestic suppliers compete effectively on price in research applications, so the practical route in is clinical work where validated performance decides selection and the reagent represents roughly 4% of what an entire testing cycle costs a laboratory in the very first place.

Engagement Snapshot From the Field

A live engagement with an industry participant carrying material or product regulatory and market exposure ahead of a defining policy shift, showing how our research translates into a defensible multi-year portfolio strategy.
MARKET MINDS ADVISORY · CLIENT ENGAGEMENT SUMMARY
Whole Genome Amplification Producer Strategic Portfolio Review and Transition Roadmap 2026·Investment Scenario on Whole Genome Amplification Exposure Evaluation 2025-26
CLIENT PROFILE
A genomics reagent supplier selling whole genome amplification kits through catalogue and distribution to research laboratories across North America and Western Europe. Annual revenue was approximately 34 million dollars (client-reported, unverified by MMA), almost entirely research grade catalogue product. No clinical validation had been completed for reproductive genetics applications at that stage of the company's development.
STRATEGIC CHALLENGE
Catalogue revenue had flattened as single-cell platform protocols began removing the amplification step and Chinese suppliers priced aggressively into remaining research demand. Management was weighing further chemistry development against clinical validation work it considered too slow. Nobody had quantified how much research volume was exposed to protocol changes already underway in customer laboratories.
MMA APPROACH
MMA surveyed the client's research accounts on protocol direction, separating laboratories already skipping discrete amplification from those still using it. Clinical validation entry was costed against continued chemistry development. Forty-seven expert interviews with core facility managers, laboratory directors, reproductive genetics specialists and accreditation assessors established how selection actually happens, alongside survey work across six countries.
KEY FINDINGS
  1. Roughly 40% of the client's research volume sat in laboratories that had already trialled protocols removing discrete amplification, and management had assumed the figure was negligible.
  2. Clinical validation for reproductive genetics was costed at around 2 years, considerably faster than management had assumed and far more durable than any chemistry improvement.
  3. Reagent price appeared in only 2 of the 9 clinical laboratory selection processes reviewed, while validation evidence appeared in all 9 of them without exception.
  4. Core facility managers standardising across many users made 6 of every 10 research purchasing decisions, and the client's selling reached individual investigators instead.
CLIENT PROFILE
A genomics reagent supplier selling whole genome amplification kits through catalogue and distribution to research laboratories across North America and Western Europe. Annual revenue was approximately 34 million dollars (client-reported, unverified by MMA), almost entirely research grade catalogue product. No clinical validation had been completed for reproductive genetics applications at that stage of the company's development.
STRATEGIC CHALLENGE
Catalogue revenue had flattened as single-cell platform protocols began removing the amplification step and Chinese suppliers priced aggressively into remaining research demand. Management was weighing further chemistry development against clinical validation work it considered too slow. Nobody had quantified how much research volume was exposed to protocol changes already underway in customer laboratories.
MMA APPROACH
MMA surveyed the client's research accounts on protocol direction, separating laboratories already skipping discrete amplification from those still using it. Clinical validation entry was costed against continued chemistry development. Forty-seven expert interviews with core facility managers, laboratory directors, reproductive genetics specialists and accreditation assessors established how selection actually happens, alongside survey work across six countries.
KEY FINDINGS
  1. Roughly 40% of the client's research volume sat in laboratories that had already trialled protocols removing discrete amplification, and management had assumed the figure was negligible.
  2. Clinical validation for reproductive genetics was costed at around 2 years, considerably faster than management had assumed and far more durable than any chemistry improvement.
  3. Reagent price appeared in only 2 of the 9 clinical laboratory selection processes reviewed, while validation evidence appeared in all 9 of them without exception.
  4. Core facility managers standardising across many users made 6 of every 10 research purchasing decisions, and the client's selling reached individual investigators instead.
RECOMMENDED STRATEGY
Phase 1: Phase one: begin clinical validation for reproductive genetics, costed at about 2 years and more durable than any chemistry improvement available. Phase 2: Phase two: redirect research selling toward core facility managers, who make 6 of every 10 purchasing decisions the client was missing. Phase 3: Phase three: accept research volume decline, since roughly 40% already sits with laboratories already trialling protocols that omit amplification entirely.
OUTCOME
The client began clinical validation and completed the first accredited laboratory qualification inside the projected window, opening a customer type it had never previously served. Research revenue declined as expected while gross margin improved, and selling to core facilities recovered some standardised volume the individual investigator approach had been missing entirely (client-reported, unverified by MMA).

Frequently Asked Questions

Foundational context covering the market sizes, CAGR, scope, country, region and competition that inform every finding below. This section is provided to cover basics and most often pre-purchase conversations, answered from the MMA Primary Research Dataset.

What is the current size of the Whole Genome Amplification Market?

The market was valued at 0.42 billion dollars in 2025, covering reagents, kits and dedicated instruments for amplifying genomes from limited inputs worldwide. It reaches an estimated 0.46 billion dollars during 2026.

How large will the Whole Genome Amplification Market be by 2036?

MMA forecasts 1.13 billion dollars by 2036, an increase of 0.67 billion dollars over the 2026 base. That represents an expansion multiple of 2.46 times across the forecast period.

What is the CAGR for the Whole Genome Amplification Market 2026 to 2036?

The base case compound annual growth rate is 9.4%, with a bull case of 10.6% and a bear case of 8.2%. Clinical translation and workflow displacement separate those two scenarios.

Which segment is growing fastest?

Single-cell genomics research grows at 14.1%, half again the market rate of 9.4%, as sequencing costs fall and experiments scale. Preimplantation genetic testing follows at 11.2%.

Who are the major companies in the Whole Genome Amplification Market?

QIAGEN, Thermo Fisher Scientific, Takara Bio, Bio-Rad Laboratories and Yikon Genomics lead on reagent revenue across research and clinical applications. Together they account for 54% of the market.

Which country is growing fastest?

China grows fastest at 13.8%, because research institutions and clinical genetics laboratories have expanded together alongside one of the largest reproductive testing volumes anywhere in the world.

Report Segmentation Architecture

The full report scope spans multiple orthogonal segmentation dimensions, with cross-tabulated demand data provided for each dimension pair. Coverage extends further to regional breakdowns, trend trajectories, and the competitive detail needed to support segment-level decision-making.

By Application

  • Single-Cell Genomics Research
  • Preimplantation Genetic Testing
  • Liquid Biopsy and Circulating Tumour Cells
  • Forensic and Identity Analysis
  • Ancient and Degraded Sample Analysis
  • Agricultural and Microbial Genomics

By End-Use Industry

  • Academic Research Institutions
  • Clinical Genetics Laboratories
  • Fertility and Reproductive Medicine
  • Oncology Diagnostics
  • Forensic Laboratories
  • Agricultural Biotechnology

By Commercial Dimension

  • Direct Laboratory Supply
  • Distributor and Dealer Supply
  • Instrument Bundled Reagents
  • Contract Testing Service Supply
  • Kit Licensing and Original Equipment Supply
  • Research Consortium Supply

By Region

  • North America
  • Western Europe
  • East Asia
  • South Asia and Pacific
  • Latin America
  • Middle East and Africa
  • Eastern Europe

Scope, Methodology, and Coverage

Every figure in this report is reproducible from documented input assumptions. The scope below maps the historical period, the forecast horizon, the segmentation dimensions, and the countries covered, alongside the underlying primary and qualitative methodology.
Historical Period
2020 to 2025
Forecast Period
2026 to 2036
Base Year
2025 (USD billions; MMA Primary Research Dataset, August 2026)
Market Definition
Reagents, kits and dedicated instruments used to amplify whole genomes from limited, single-cell or degraded DNA inputs worldwide, covering multiple displacement amplification, polymerase chain reaction based amplification, hybrid chemistries and the automation dedicated to those workflows, measured at supplier revenue. Targeted amplification of specific loci or panels, standard library preparation reagents for abundant input material, sequencing instruments and their consumables, and downstream analysis software sold separately are excluded from scope entirely.
Quantitative Units
USD billions (supplier revenue); reactions; USD per reaction by application and chemistry
Segmentation Dimensions
Application; end-use industry; commercial dimension; region
Regions Covered
North America, Western Europe, East Asia, South Asia and Pacific, Latin America, Middle East and Africa, Eastern Europe
Countries Covered
United States, Canada, United Kingdom, Germany, France, Netherlands, Sweden, Denmark, Italy, Spain, China, Japan, South Korea, Taiwan, India, Australia, Singapore, Brazil, Mexico, Saudi Arabia, Israel, Poland
Key Companies Profiled
QIAGEN, Thermo Fisher Scientific, Takara Bio, Bio-Rad Laboratories, Yikon Genomics, Illumina, 10x Genomics, Cytiva, Merck KGaA, New England Biolabs, Promega, Agilent Technologies, PacBio, BGI Genomics, MGI Tech, Vazyme Biotech, Singleron Biotechnologies, Mission Bio, Standard BioTools, Parse Biosciences
Quantitative Methodology
Primary survey, n=3,800 respondents, Q4 2025, six countries; demand-side model with trade association cross-validation
Qualitative Methodology
47 expert interviews, Q4 2025; applied to validate demand model assumptions, identify emerging dynamics, and assess competitive positioning
Report Format
PDF and XLSX data workbook (Word format preview document)
Publisher
Market Minds Advisory
Report Code
MMA-2026-MED-137
Published
August 2026
Contact
sales@marketmindsadvisory.com | www.marketmindsadvisory.com

Purchase the full Whole Genome Amplification Market Report (2026 to 2036).

The full report treats whole genome amplification as a category built around a problem nobody solved, where laboratories choose between failure modes and the application decides which one is tolerable. It sizes all six applications independently through 2036, quantifies displacement by direct library preparation across single-cell workflows, and separates clinically validated positions from catalogue research volume. Regional chapters cover all seven regions, with Chinese research and clinical expansion assessed separately from North American research funding density. Competitive profiling covers 20 participants on one consistent reagent revenue measure.
Six applications sized independently through 2036
Displacement by direct library preparation quantified across single-cell workflows
Allele dropout performance assessed against clinical validation requirements
Clinically validated positions separated from catalogue research volume
Enzyme and oligonucleotide supply concentration examined as category risk
Twenty participants profiled on one consistent revenue measure

Built For The People Who Decide

From boardroom strategy to bench-side execution, this report is read cover-to-cover by leaders shaping the next decade of their industry, turning demand scenarios, market dynamics and valuation benchmarks into decisions.
CXOs/ Presidents/ VPs/ Managers
M&A and Corporate Development
Strategy Teams and R&D Heads
Procurement and Product Directors
Regulatory and Compliance Leaders
Investor Relations and Equity Analysts