
Market Minds Advisory
North America and Europe Precast Concrete Market

North America and Europe Precast Concrete Market: Buying Labour, Not Concrete

Precast costs more per cubic metre and less per building, because the formwork carpenters and finishers who used to pour on site are retiring far faster than anybody is replacing them.

Lead Analyst

Bilal Shaikh

Published

September 2026

Make Smarter Decisions with Customized Research Insights

Request a free sample report and evaluate market opportunities, growth trends, and competitive dynamics relevant to your business needs.

2025 MARKET VALUE$74.0BMarket Size 2025
2036 FORECAST VALUE$123.9BBase Case , 2026 to 2036
CAGR 2026 TO 20364.8 %Bull 6.0% / Bear 3.6%
INCREMENTAL OPPORTUNITY$46.4BNet 10- year value creation
EXPANSION MULTIPLE1.60x2036 value over 2026 base
Strategic Levers
M&A Pipeline
Regional Outlook
Country Rankings
Competitive Intelligence
Segmental Deep-dive
Call-Us : 91 93563 13602

Executive Snapshot and Market Trajectory

Precast wins on labour rather than on concrete. A factory element cuts site labour hours by roughly 62% against equivalent cast in place work, and skilled formwork and finishing trades across North America and Europe are retiring faster than apprenticeships replace them. That gap is what precast sells on.
The material costs more per cubic metre and the building costs less to deliver wherever labour is scarce and expensive, which describes most of this geography. Weather is the second argument: a factory pours in February. Wall panels and architectural facade grow fastest at 7.2%, half again the market rate of 4.8%, because that is where site labour intensity was highest. Weather is the second argument, and a factory pours in February.
Embodied carbon rules cut the same way, though most commentary gets it backwards. Precast is not inherently lower carbon per cubic metre; factory control simply permits supplementary cementitious replacement near 38% and precise curing that a site pour cannot reliably reproduce. Roughly 44% of elements now ship with a documented environmental declaration behind them. Poland grows fastest anywhere in scope at 6.9%. Nothing else in scope comes close.
Market Definition
Concrete elements cast in controlled factory conditions and transported to site for erection across North America and Europe, spanning structural floor and roof elements, wall panels and architectural facade, utility and drainage products, segmental tunnel linings, bridge and highway elements and modular volumetric units. Excludes ready-mixed concrete, cast in place construction, concrete masonry units, cement and aggregates, and precast production outside the two defined regions.
Base Year Value
$74.0B in 2025 (MMA Primary Research Dataset, August 2026)
Forecast Period
2026 to 2036, eleven discrete annual values
CAGR
4.8% base case. Bull 6.0%. Bear 3.6%.
Fastest Growth Segment
Wall Panels and Architectural Facade: 7.2% CAGR
Fastest Growth Country
Poland: 6.9% CAGR
Fastest Growth Region
South Asia and Pacific: 6.7% CAGR
Largest Region
North America: 46% of 2025 global value
Market Leaders
CRH, Holcim, Consolis, Cemex, Forterra. Source: MMA Primary Research Dataset, July 2026.
Primary Survey
n=3,800 procurement and R&D decision-makers, Q4 2025, six countries
Methodology
Demand-side build-up, cross-validated against public data, 47 expert interviews

North America and Europe Precast Concrete Market Forecast Scenarios

precast-concrete-market-trends-size-forecast-scenario-1787580407668
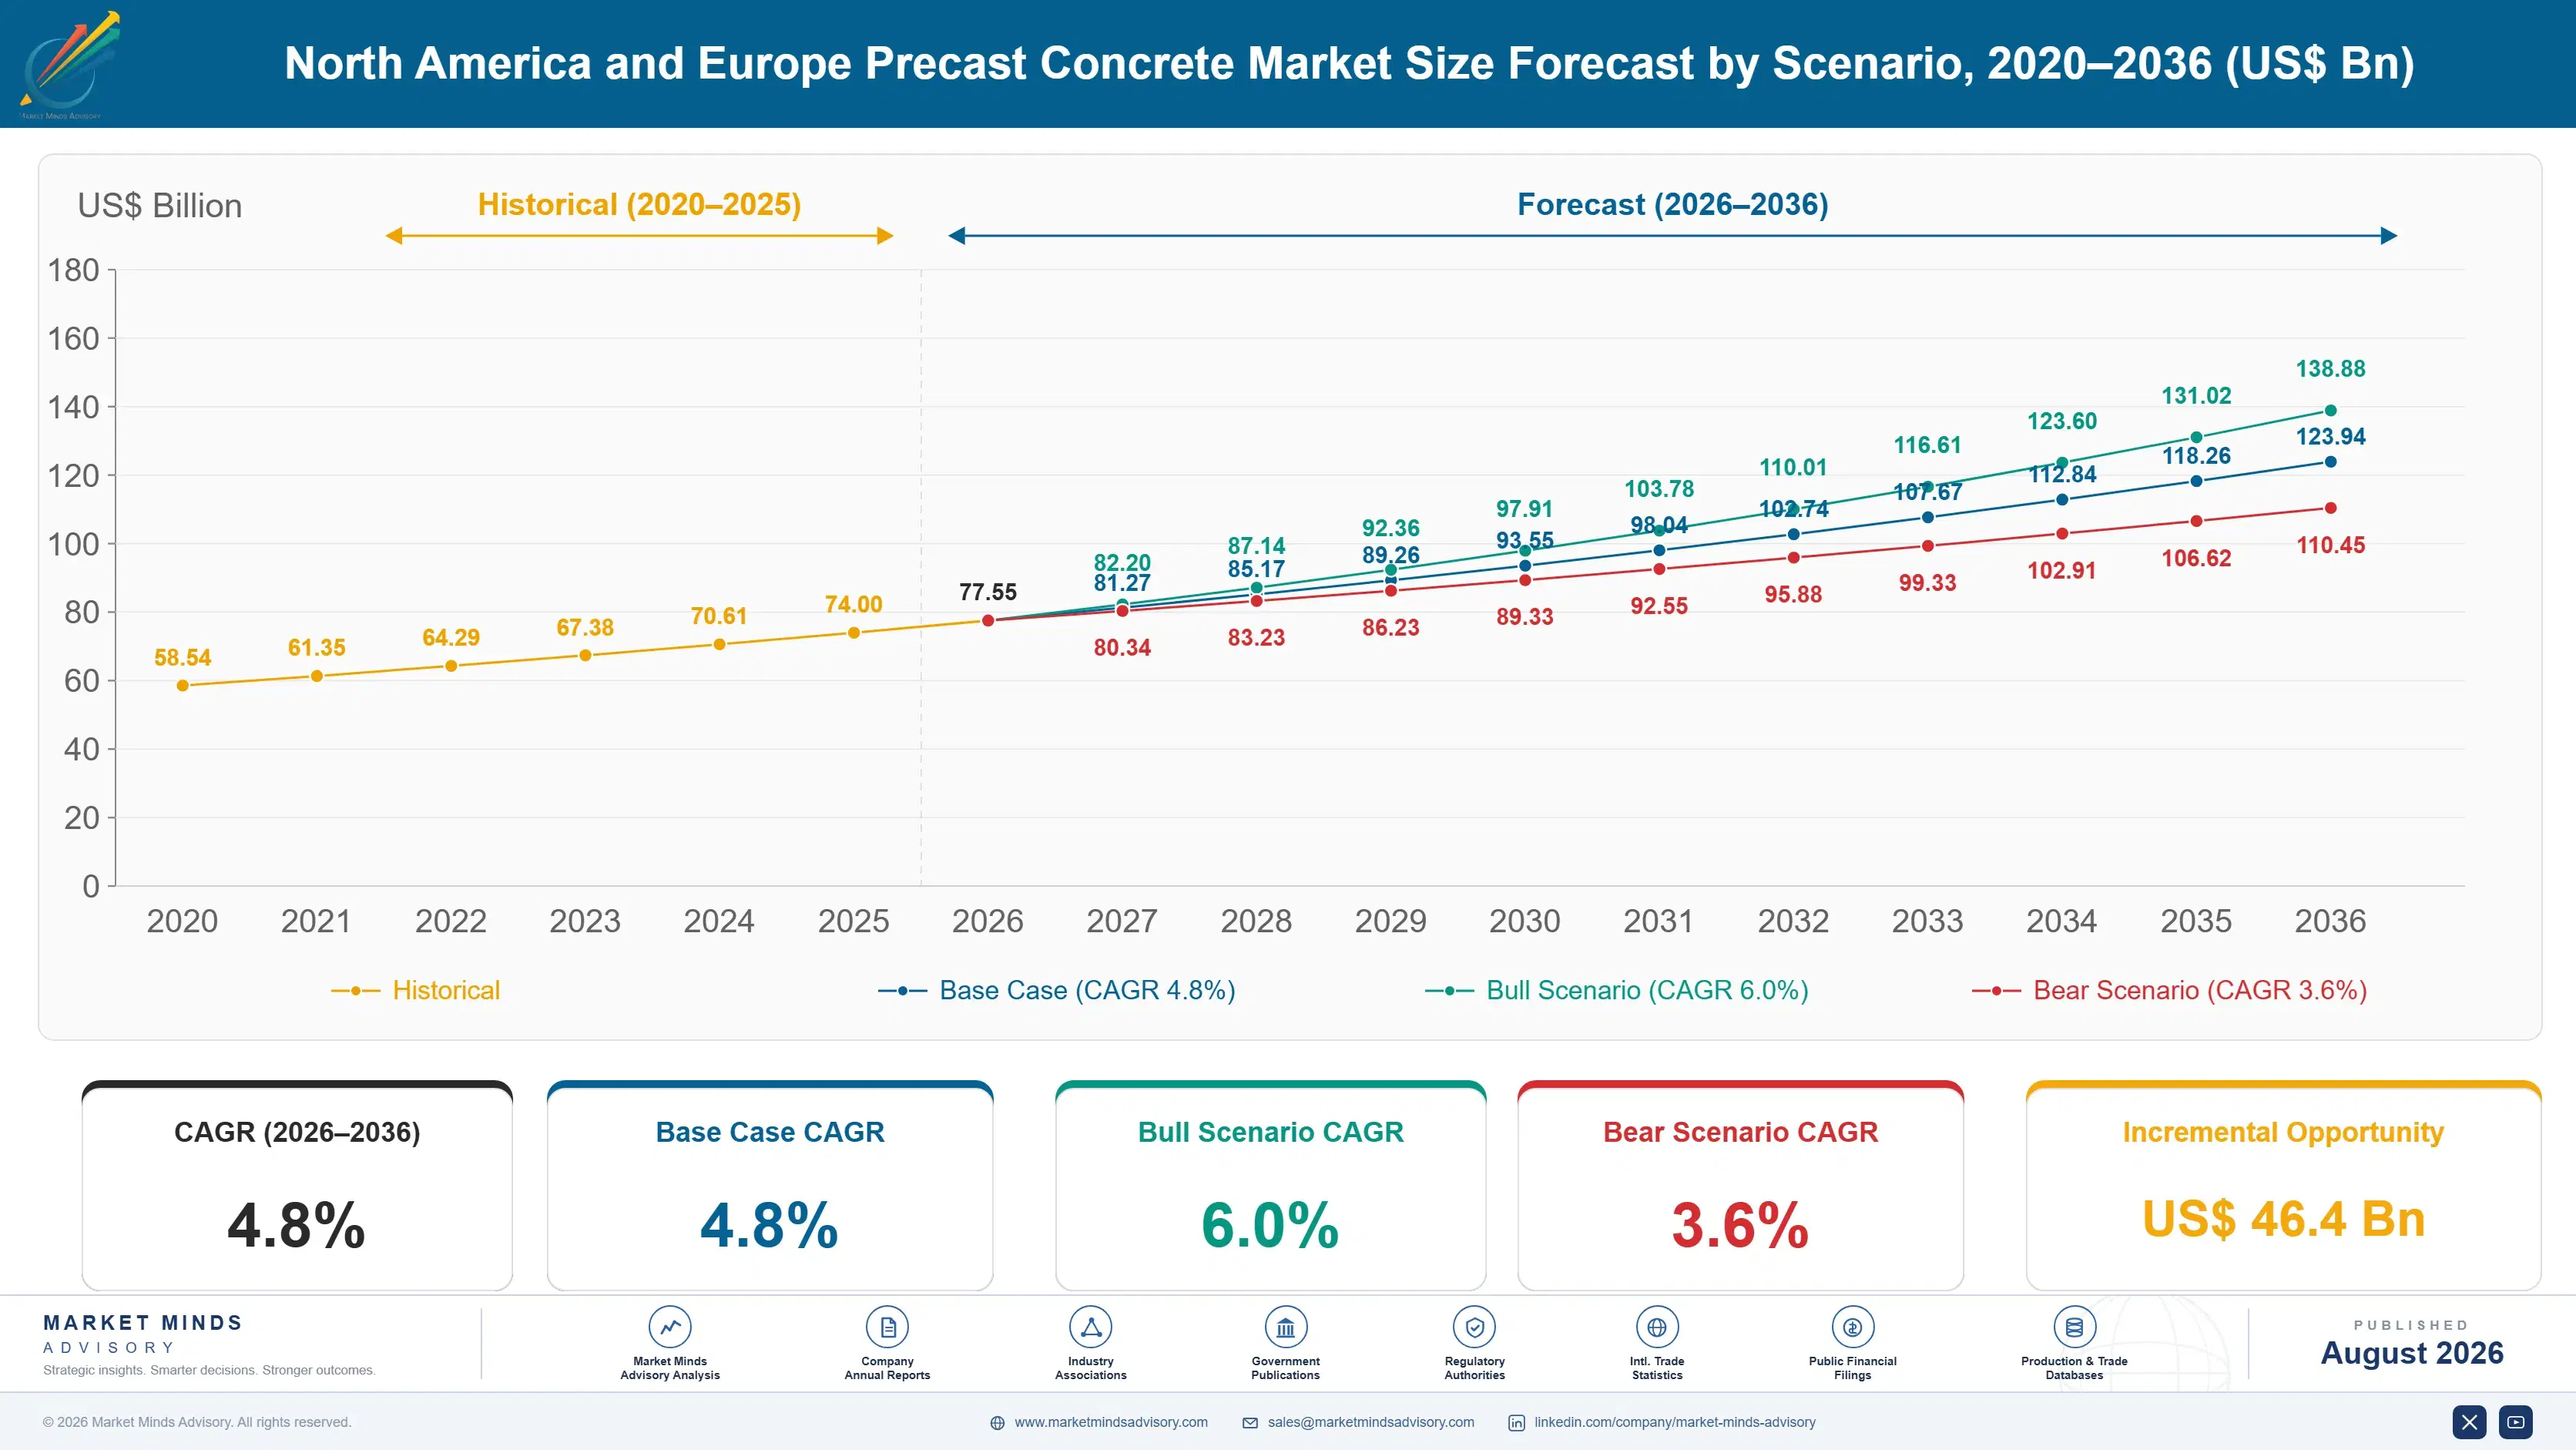
Growth ran near 3.7% between 2020 and 2025 through a period when construction demand and construction capacity moved in opposite directions. Labour shortage intensified across both regions while material and energy costs rose sharply, and precast gained share of a construction market that was itself growing slowly. Infrastructure programmes in both geographies supported utility, bridge and tunnel element volumes throughout the period.
Base case 4.8% rests on three mechanisms. Skilled site trades continue retiring faster than replacement across both regions, which raises the labour arbitrage precast is actually sold on. Embodied carbon requirements in public procurement reward documented per-element declarations that factory production can supply and site pouring cannot. And European cohesion-funded infrastructure alongside American federal programmes both consume precast utility, bridge and tunnel elements in volume. None of the three depends on total construction volume rising.
The bull case at 6.0% assumes labour scarcity tightens further while embodied carbon requirements spread from public procurement into private development, which would push precast share of total construction up rather than merely growing with it. The bear case at 3.6% is a construction downturn across both regions combined with supplementary cementitious material scarcity, which would raise precast costs precisely as demand weakened.

The Trade Shortage Nobody Is Fixing

The argument for precast is almost never about concrete. A hollowcore floor or a facade panel arrives finished, and the site labour it displaces, formwork carpentry, steel fixing, pouring, curing and finishing, is roughly 62% of what the equivalent cast in place element would consume. Those trades are scarce across both regions and getting scarcer, because apprenticeship intake has not tracked retirement for two decades.
TOP FIVE CONCENTRATION18%Transport radius keeps production regional and ownership fragmented
ECONOMIC DELIVERY RADIUS300 kmDistance beyond which freight overwhelms the element value
SITE LABOUR HOURS SAVED62%Reduction achieved against equivalent cast in place construction
CEMENT COST SHARE34%Share of element cost carried by binder content
CEMENTITIOUS REPLACEMENT RATE38%Cement replaced by slag or ash in optimised mixes
DECLARATION COVERAGE44%Share of elements shipped with a documented product declaration
Weather compounds it. A precast plant pours in February at controlled temperature and humidity, which a site cannot, and a programme that does not stop for frost is worth real money on a fixed completion date. Developers with financing costs running against a schedule value that more than they value a lower material invoice, and that calculation has moved steadily in precast's favour.
Embodied carbon works in the same direction for a reason most commentary states incorrectly. Precast is not inherently lower carbon per cubic metre than site concrete. Factory control simply allows supplementary cementitious replacement near 38% with confidence, precise curing and no over-ordering, none of which a site pour reliably achieves. Roughly 44% of elements now ship with a documented declaration attached.
"Every precast pitch I hear leads with carbon and every precast sale I see closes on labour. The customer is buying certainty that the building goes up on schedule with people who actually exist, and the environmental product declaration is what gets it through procurement afterwards."
Director, Construction Materials and Building Systems Practice · MMA Construction and Building Materials Practice · August 2026

Market Trends

Skilled site trade shortage widening the precast labour arbitrage

Formwork carpenters, steel fixers and concrete finishers are retiring across both regions faster than apprenticeship intake replaces them, and construction wage inflation in those trades has outpaced general construction costs for several years. A precast element moves that work into a factory where it can be partly automated and where a smaller crew handles far more output. Site labour hours fall roughly 62% against equivalent cast in place work. The arbitrage widens every year the trade shortage persists, and nothing in current training pipelines suggests it is closing. Nothing in the training pipeline suggests it closes.
Market Impact: Delivers 6.9% annual Polish growth
Public procurement rewarding documented embodied carbon declarations

Embodied carbon requirements in public procurement across several American states and most European jurisdictions now specify documented environmental product declarations rather than generic material claims. A precast plant can produce a declaration per element from known mix designs and measured production data, while a site pour cannot document what was actually placed with anything like the same confidence. Roughly 44% of elements now ship with a declaration behind them. That documentation advantage is procedural rather than physical, and it decides tenders. That documentation advantage is procedural rather than physical, and it decides tenders before any price is compared.
Market Impact: Shortens programme across 2 trade sequences

Market Opportunities and Growth Drivers

European cohesion funded infrastructure consuming utility and tunnel elements

Cohesion and recovery funding across Central and Eastern Europe is financing road, rail and water infrastructure that consumes precast drainage, culvert, bridge and tunnel segment volume at scale. Poland grows fastest anywhere in scope at 6.9%, with a substantial domestic precast industry positioned to serve it. Segmental tunnel linings in particular have no cast in place alternative on a bored tunnel, which makes that demand entirely captive. Funding cycles are published years ahead, which gives producers unusually good visibility on when volume arrives. Funding cycles are published years ahead, which gives producers unusual visibility.
Market Impact: Threatens 38% replacement rates

Schedule certainty valued above material cost by financed developers

A developer carrying financing costs against a fixed completion date values programme certainty considerably more than a lower material invoice, and precast delivers it because factory production does not stop for weather or depend on trades that may not turn up. Erection sequences are predictable and the structure closes faster, which brings following trades forward. That calculation has moved steadily toward precast as interest costs rose. Material cost per cubic metre remains higher and stays largely irrelevant to the decision being made. Material cost per cubic metre stays higher and remains largely irrelevant to the decision actually being made.
Market Impact: Caps catchment near 300 km

Market Restraints and Challenges

Fly ash disappearing as coal generation retires across both regions

Fly ash is the cheapest supplementary cementitious material and it comes from coal combustion, which both regions are retiring on schedule. The root cause sits entirely outside construction and cannot be influenced by anyone in it. Commercially it tightens supply of the input that makes replacement near 38% economic exactly as embodied carbon rules demand more of it. Producers are qualifying ground granulated slag, calcined clay and harvested pond ash, and each carries availability, cost or performance limitations that fly ash did not. The retirement schedules are public and the squeeze is entirely foreseeable.
Market Impact: Cuts site labour hours by 62%

Transport radius capping plant catchment and preventing consolidation

A precast element is heavy, bulky and low in value density, and freight economics collapse beyond roughly 300 kilometres from the plant. The root cause is physics rather than logistics organisation. Commercially it means every plant serves a defined catchment, national consolidation delivers few operating benefits, and concentration across both regions sits at only 18% despite decades of acquisition activity. Producers extend reach through satellite plants rather than through larger central ones, which is capital intensive and slow to build out. Satellite plants rather than larger central ones are the only route to reach.
Market Impact: Covers 44% of elements shipped
3 additional market trends, 4 additional growth drivers, and 2 additional restraints and challenges are covered in the full report. Contact sales@marketmindsadvisory.com to access the complete intelligence.

Segment CAGR and Growth Architecture

Six segments split by element type, because each carries a different production process, a different competitive field and a different demand driver behind it. A facade panel and a tunnel segment share a material and nothing commercially. End-use construction sector and commercial channel are handled in the framework rather than folded in here. The economics differ completely.
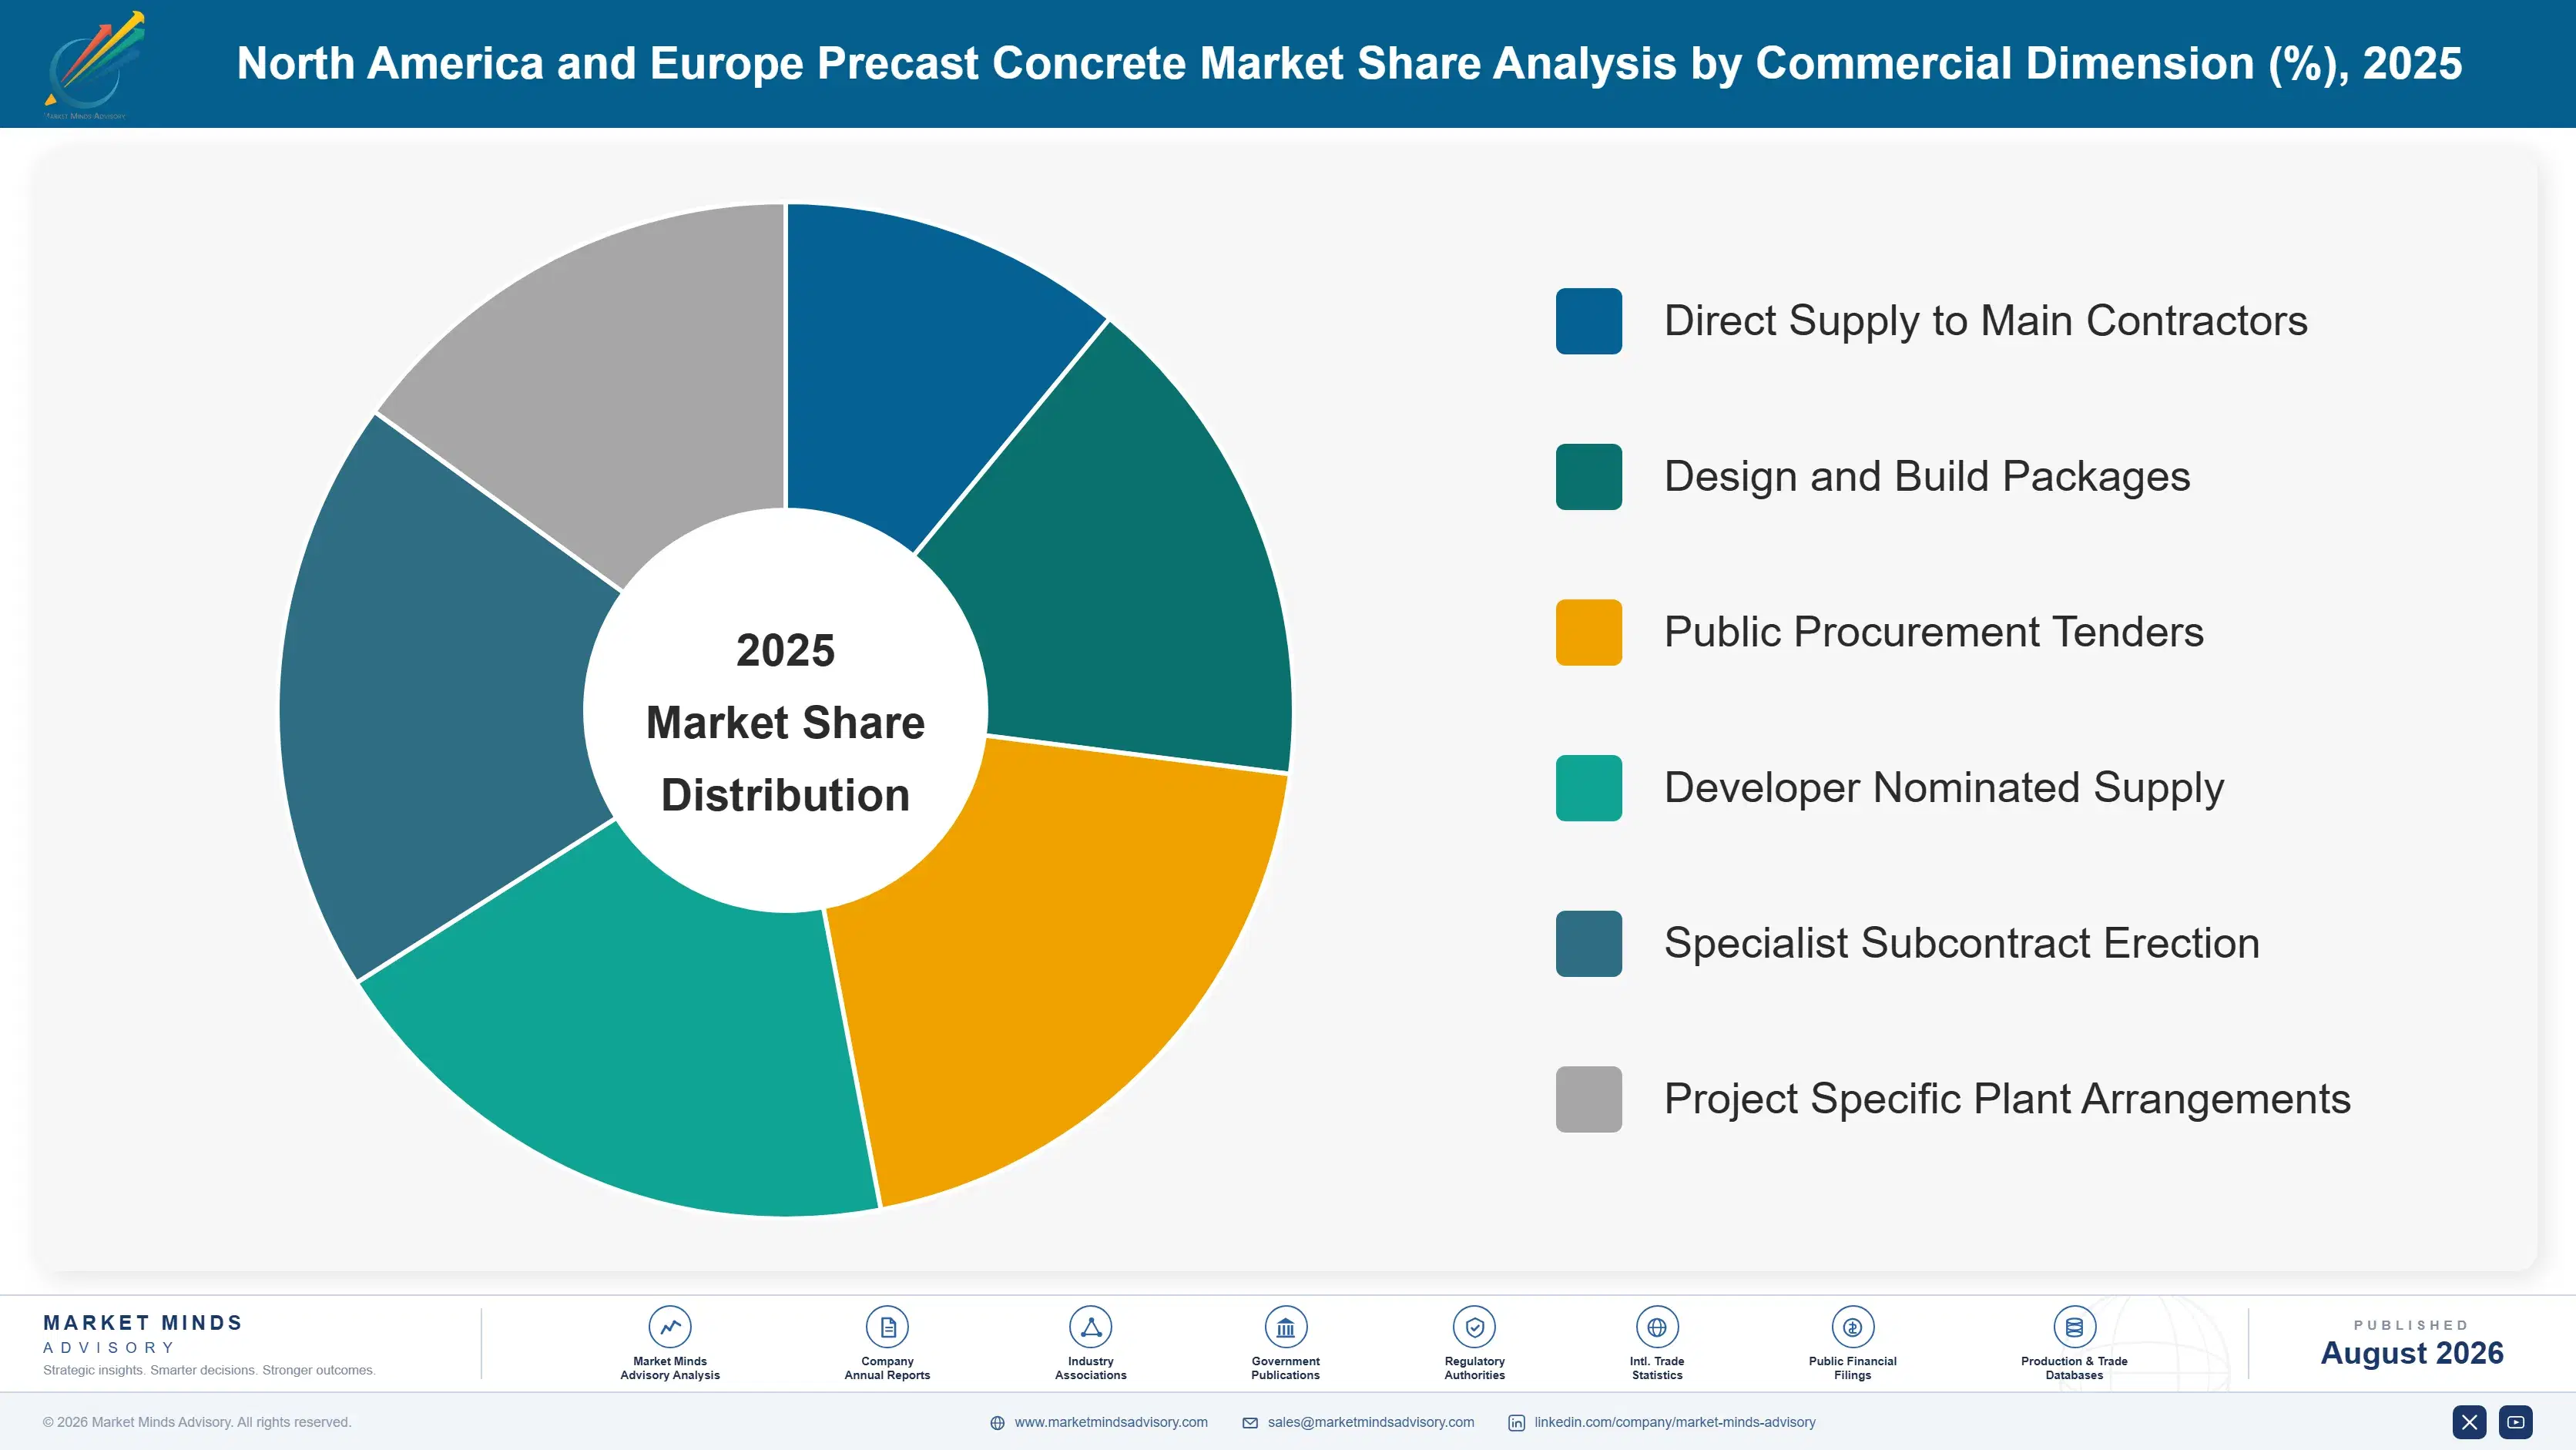
precast-concrete-market-trends-market-share-analysis-1787580408240

Wall Panels and Architectural Facade

Growing at 7.2%, half again the market rate of 4.8%, facade and wall panel work is where site labour intensity was highest and where the arbitrage is therefore largest. Architectural finishes achievable in a factory, acid etched, polished, form liner textured or with integrated insulation, are difficult and expensive to reproduce on site at any quality. Insulated sandwich panels deliver structure, insulation and finish in one erection sequence, which compresses programme further. Design collaboration during the architectural phase decides who supplies, since panel geometry has to suit the mould economics before anything is priced. Insulated sandwich panels deliver structure, insulation and finish in a single erection sequence, which compresses programme further still.
CAGR 7.2%

Segmental Tunnel Linings

At 6.4% tunnel segment demand is entirely captive, because a bored tunnel has no cast in place alternative and the lining is placed by the machine as it advances. Demand follows tunnelling programmes rather than construction cycles, and those programmes are published years ahead through public infrastructure funding. Production is specialised, with dimensional tolerance requirements far tighter than ordinary precast and gasket sealing performance that must hold groundwater pressure. Plants are frequently built for a single project and sited alongside the drive, which makes the business project-based rather than territorial. Plants are frequently built for a single project and sited alongside the drive, which makes this a project business rather than a territorial one.
CAGR 6.4%
Full segment breakdown across 6 segments available in the complete report.

Regional Architecture and Country Demand Map

This report covers North America and Europe only, so shares sit far outside the usual global bands by design. North America holds 46% and Western Europe 38%, with Eastern Europe at 11% on cohesion funded infrastructure. Other regions appear only as limited cross-border supply into the defined scope.

North America

The 46% share reflects the report's defined scope rather than any global position, since this study covers North America and Europe only. Within it, American demand dominates on data centre, warehouse and distribution construction where speed and structural span both favour precast heavily. Skilled trade shortage is more acute here than in Europe, with formwork carpentry among the hardest crafts to recruit. Buy Clean procurement rules in California, Colorado and elsewhere have made environmental declarations a tender requirement. Canadian demand is smaller and weighted toward infrastructure, with harsh winters strengthening the weather argument considerably. Harsh Canadian winters strengthen the weather argument considerably further north. Data centre construction is the fastest single driver.
Share: 46% | CAGR: 5.4% (2026 to 2036)

Western Europe

The 38% share again reflects defined scope rather than global position. German, Dutch and Nordic markets have the deepest precast penetration in residential and commercial structure anywhere covered, with hollowcore floors close to standard practice rather than an alternative. Dutch environmental performance requirements for buildings are the most developed anywhere and reward documented low-carbon mixes directly. French and British markets remain more cast in place by tradition, which leaves genuine conversion headroom. Consolis and regional specialists hold most capacity, and transport radius keeps ownership fragmented across every national market. French and British markets remain more cast in place by tradition, which leaves genuine conversion headroom for producers there. Transport radius keeps ownership fragmented everywhere.
Share: 38% | CAGR: 3.6% (2026 to 2036)
Regional intelligence for 5 additional markets available in the complete report: East Asia, South Asia and Pacific, Latin America, Middle East and Africa, Eastern Europe. Contact sales@marketmindsadvisory.com.
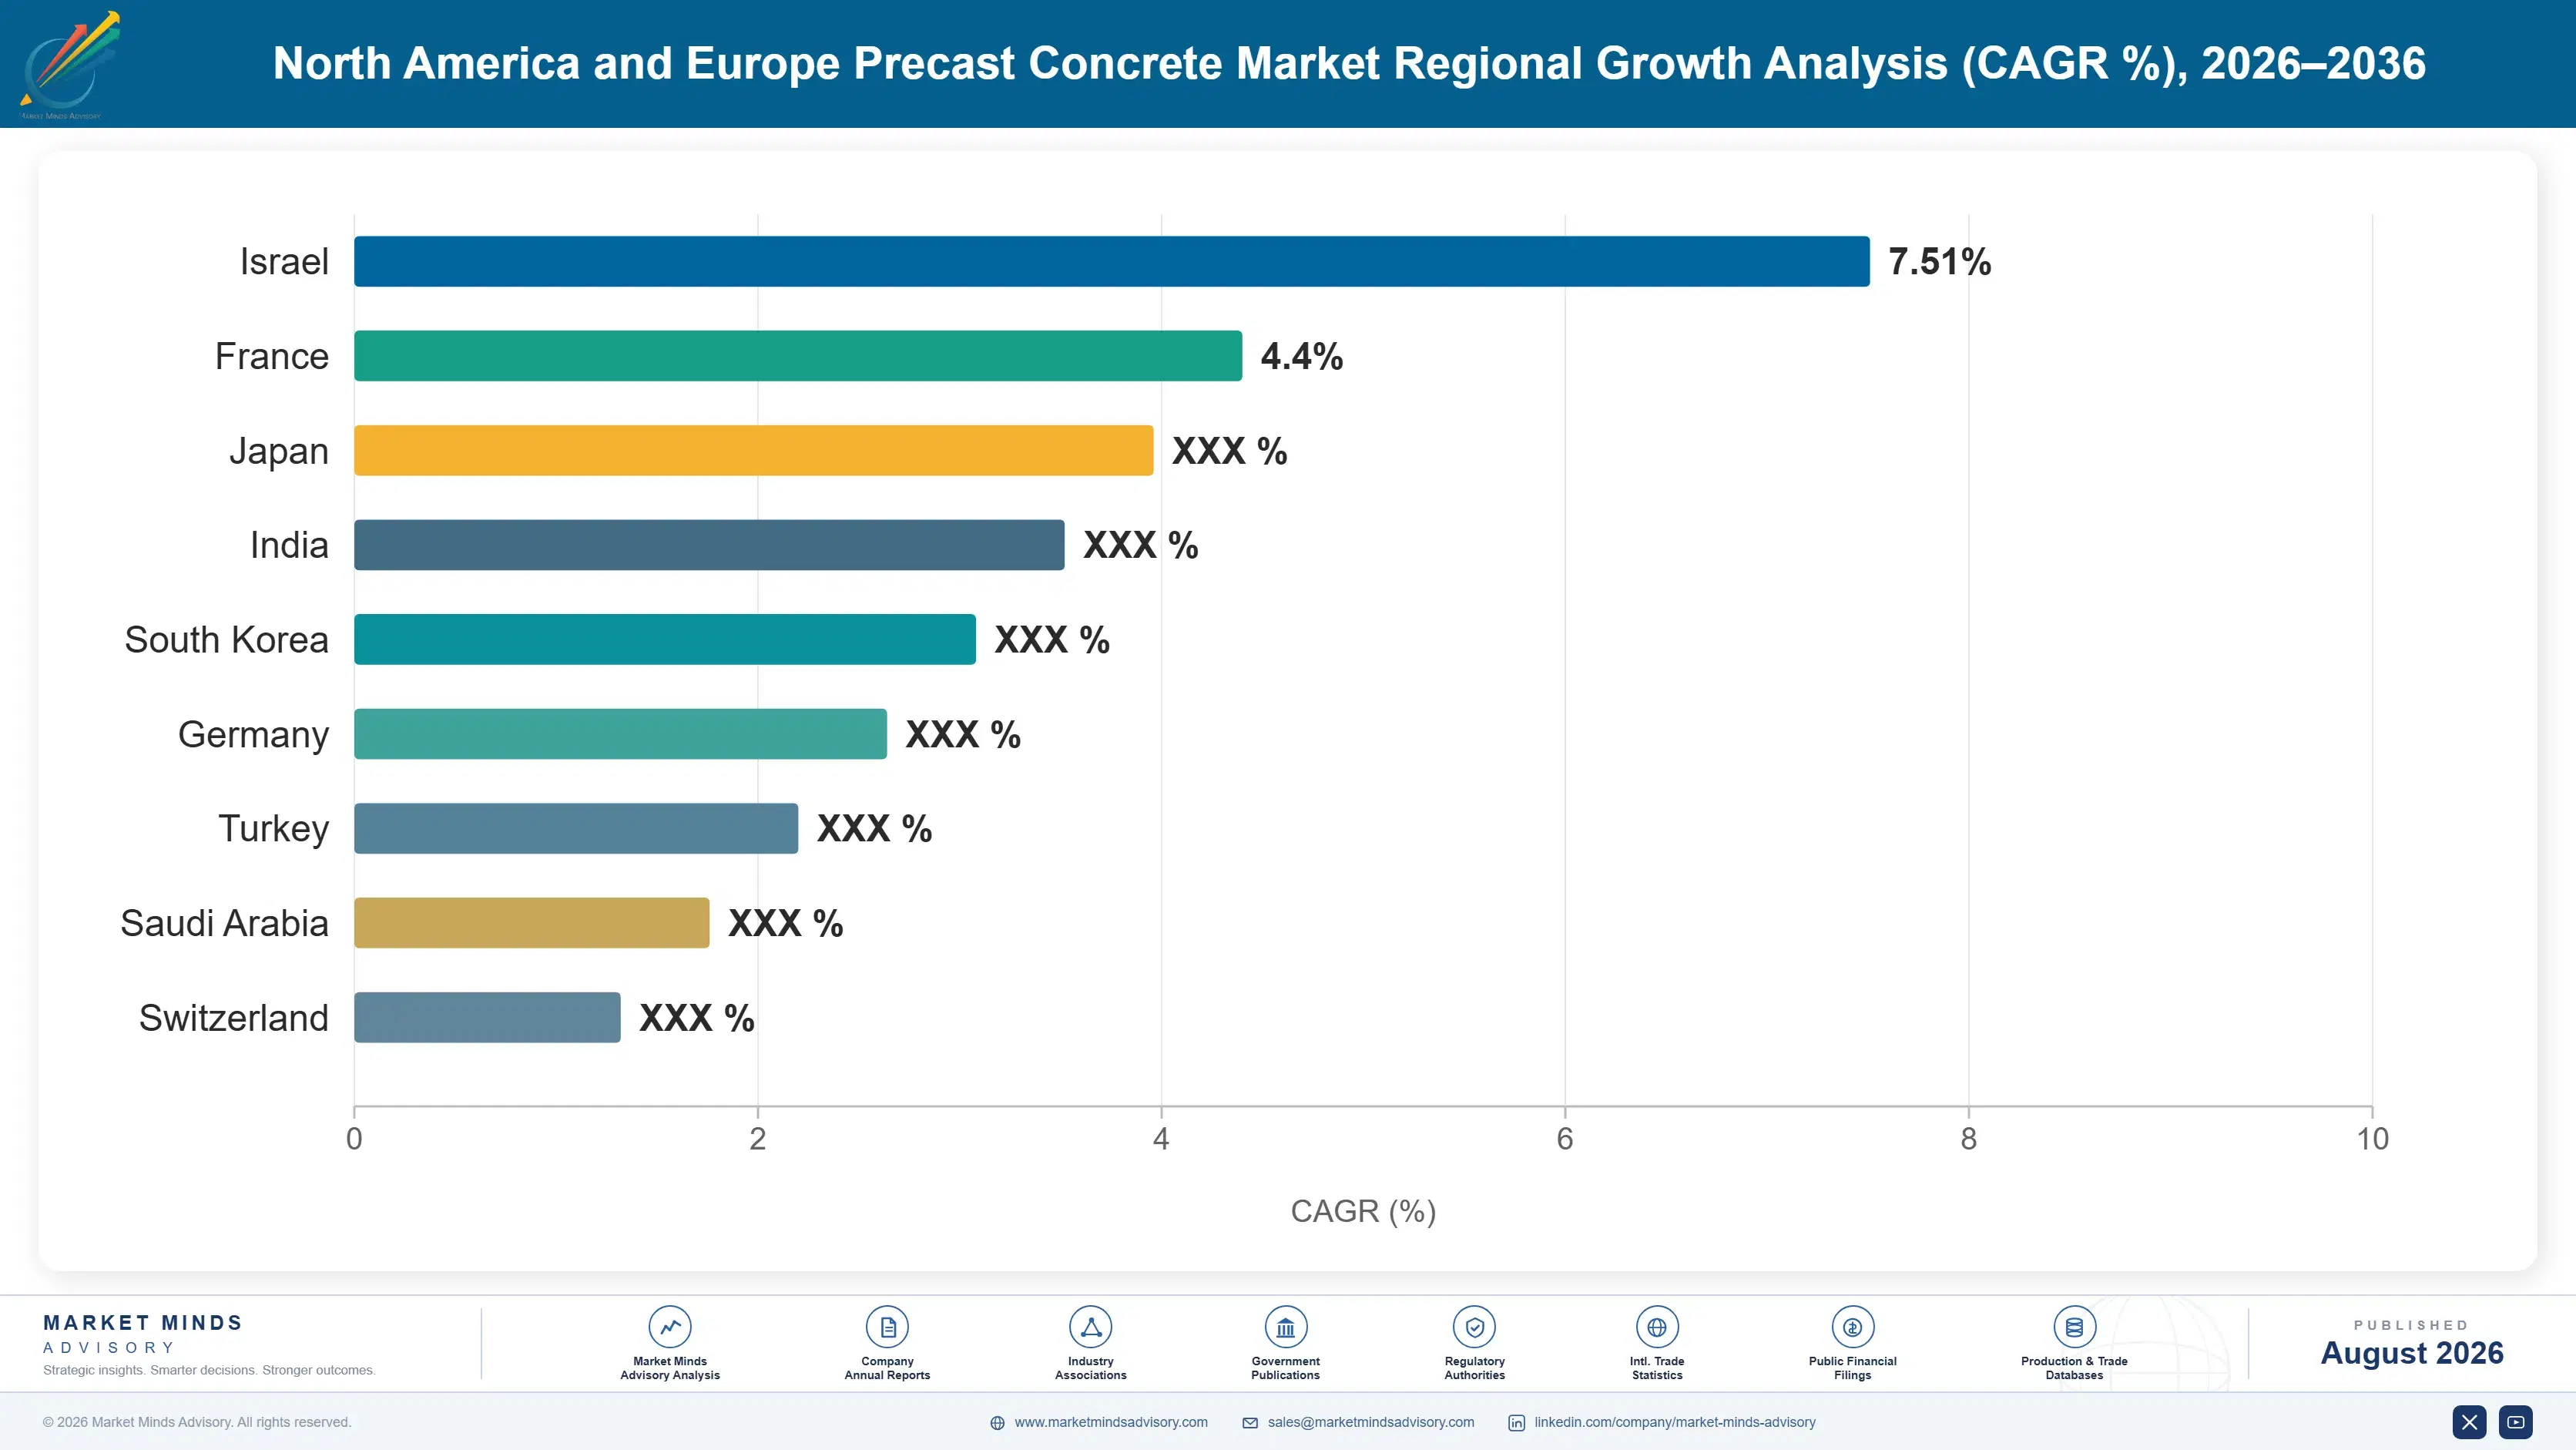
precast-concrete-market-trends-country-cagr-analysis-1787580408782

Four Moves Inside a Delivery Radius

Transport radius near 300 kilometres makes this a business of local catchments rather than national strategies, and the top five hold only 18% for that reason. What travels is design capability, mix expertise and declaration documentation. Capacity has to be built where the demand is, one plant at a time. Nothing else travels at all.

Sell the labour arithmetic, not the material price

A precast element costs more per cubic metre and cuts site labour hours by roughly 62% against equivalent cast in place work, which is the only comparison that matters to a developer facing trade shortages and financing costs against a completion date. Presenting delivered programme cost rather than material cost changes who takes the decision, moving it from a quantity surveyor to a project director. Producers who built that case with real programme data win projects that a rate comparison never reaches at all. Rate comparisons never reach that audience.
Market Impact: Demonstrates a 62% reduction in site labour hours

Get into architectural design before geometry is frozen

Panel geometry determines mould count and mould reuse, which determines cost far more than concrete volume does, and by the time a facade is fully designed those decisions are already made. Engaging during the architectural phase lets a producer shape geometry toward mould economics while the architect still has freedom. That collaboration also effectively decides the supplier, since a design optimised around one producer's mould inventory prices poorly at every competitor. Facade work grows at 7.2% and this is how it gets won. Competitors then price the same design badly.
Market Impact: Shapes cost ahead of the 7.2% segment growth

Qualify alternatives to fly ash before it disappears

Fly ash makes supplementary replacement near 38% economic and it is disappearing as coal generation retires across both regions on published schedules. Ground granulated slag, calcined clay and harvested pond ash each carry availability, cost or performance limitations that fly ash did not, and qualifying them takes mix development and structural testing time. Producers who started that work hold declaration positions that late movers cannot match when the ash runs short. The schedules are public and the timing is entirely foreseeable. Nobody is short of warning here. Late movers cannot catch up quickly.
Market Impact: Protects the 38% replacement rate in optimised mixes

Extend reach with satellite plants rather than central scale

Freight economics collapse beyond roughly 300 kilometres, so a larger central plant does not extend catchment and simply concentrates fixed cost. Satellite capacity placed inside a new catchment is the only route to growth, and it is capital intensive at perhaps 40 million dollars for a structural plant. That constraint is why concentration sits at 18% after decades of acquisitions. Producers who understand it buy or build inside catchments rather than pursuing national scale that delivers no shared benefit at all. National scale delivers nothing here. Acquisitions across catchments disappoint.
Market Impact: Costs $40 million for each satellite plant built

Who Controls the Margin Pool

Participation is measured on annual precast element production volume in cubic metres, and the top five hold just 18% across both regions. Transport radius near 300 kilometres is why: every plant serves a catchment and national ownership delivers few operating benefits. CRH and Holcim lead through many local plants rather than through any scale advantage in production. The gap to challengers is catchment coverage.
Competition runs locally and on three things. Delivered cost within a catchment decides most utility and structural work, where elements are standardised and specification is straightforward. Design collaboration decides architectural facade, since geometry optimised around one producer's moulds prices badly everywhere else. Declaration documentation decides public procurement increasingly, and it favours producers with mature mix data and measured production records over those assembling paperwork retrospectively.

The pressure ahead is supplementary cementitious material scarcity meeting embodied carbon requirements. Fly ash disappears on published coal retirement schedules exactly as declarations demand more replacement, and producers who qualified alternatives early hold positions the rest cannot match. Expect satellite plant investment and mix qualification rather than large acquisitions, since consolidation across catchments delivers very little. Rankings shift catchment by catchment rather than nationally.
precast-concrete-market-trends-company-positioning-matrix-1787580409312

Competitive Moat and Risk Dimensions

CRH

Moat: Catchment coverage across both regions

CRH operates precast capacity across a large number of local catchments in North America and Europe, which is the only form of scale this business actually offers given transport economics. A national contractor working across several regions can specify one supplier where competitors cover only part of the footprint, and assembling equivalent coverage takes many years.
CRH

Risk: Limited benefit across catchments

Owning many plants delivers few operating benefits when each serves a separate market with its own labour, freight and demand cycle, and central overhead has to be justified against benefits that are genuinely modest. A well-run independent inside a single catchment can match delivered cost, which is why concentration across both regions has stayed at 18% despite sustained acquisition activity.
CONSOLIS

Moat: European structural system depth

Consolis holds deep structural precast capability across Nordic and Continental European markets where hollowcore and structural frame penetration is highest, with engineering and system design capacity that supports specification rather than merely responding to it. That combination of design involvement and regional coverage is what wins structural work before it reaches a price comparison.
CONSOLIS

Risk: European construction cycle concentration

Revenue concentrates in European construction, which has grown slowly and remains exposed to interest rate and residential cycles that both moved unfavourably in recent years. Without North American exposure the business carries the full weight of a single regional cycle, and precast share gains within a shrinking construction market only partly offset a downturn in the market itself.

Players Tracked

Prominent Players

CRH
Holcim
Consolis
Cemex
Forterra

Other Key Players

Wienerberger
Heidelberg Materials
Tindall Corporation
Coreslab Structures
Metromont
Bison Manufacturing
Kerkstoel Beton
Decomo
Betonson
Pekabex
Rector Lesage
Spancrete
Wells Concrete
County Materials
Shea Concrete Products

Recent Developments

FEBRUARY 2026

American state extends embodied carbon declaration requirement to structural precast

A United States state extended its public procurement embodied carbon requirements to cover structural precast elements, requiring documented environmental product declarations per element rather than generic material averages. Producers without measured production data faced exclusion from affected tenders during the transition period. Transition arrangements ran for one year.
Signal: Declaration documentation is procedural rather than physical, and it now decides who can bid at all
SEPTEMBER 2025

European producer qualifies calcined clay replacement as fly ash supply tightens

A European precast producer completed structural qualification of calcined clay as a supplementary cementitious material, responding to fly ash availability declining with regional coal generation retirement. Qualification covered structural testing and declaration recalculation across the affected element range. Declaration figures were recalculated across the range.
Signal: Coal retirement schedules are public, which makes the supplementary material squeeze entirely foreseeable and largely unaddressed
MAY 2026

Polish producer supplies structural elements into German project within delivery radius

A Polish precast producer supplied structural elements to a German commercial project located within economic delivery radius of its plant, competing on cost against domestic German suppliers. Cross-border supply of this kind is limited entirely by distance rather than by any commercial or regulatory obstacle.
Signal: Transport radius rather than any national border defines who actually competes for a given precast project

Cement, Steel and the Truck

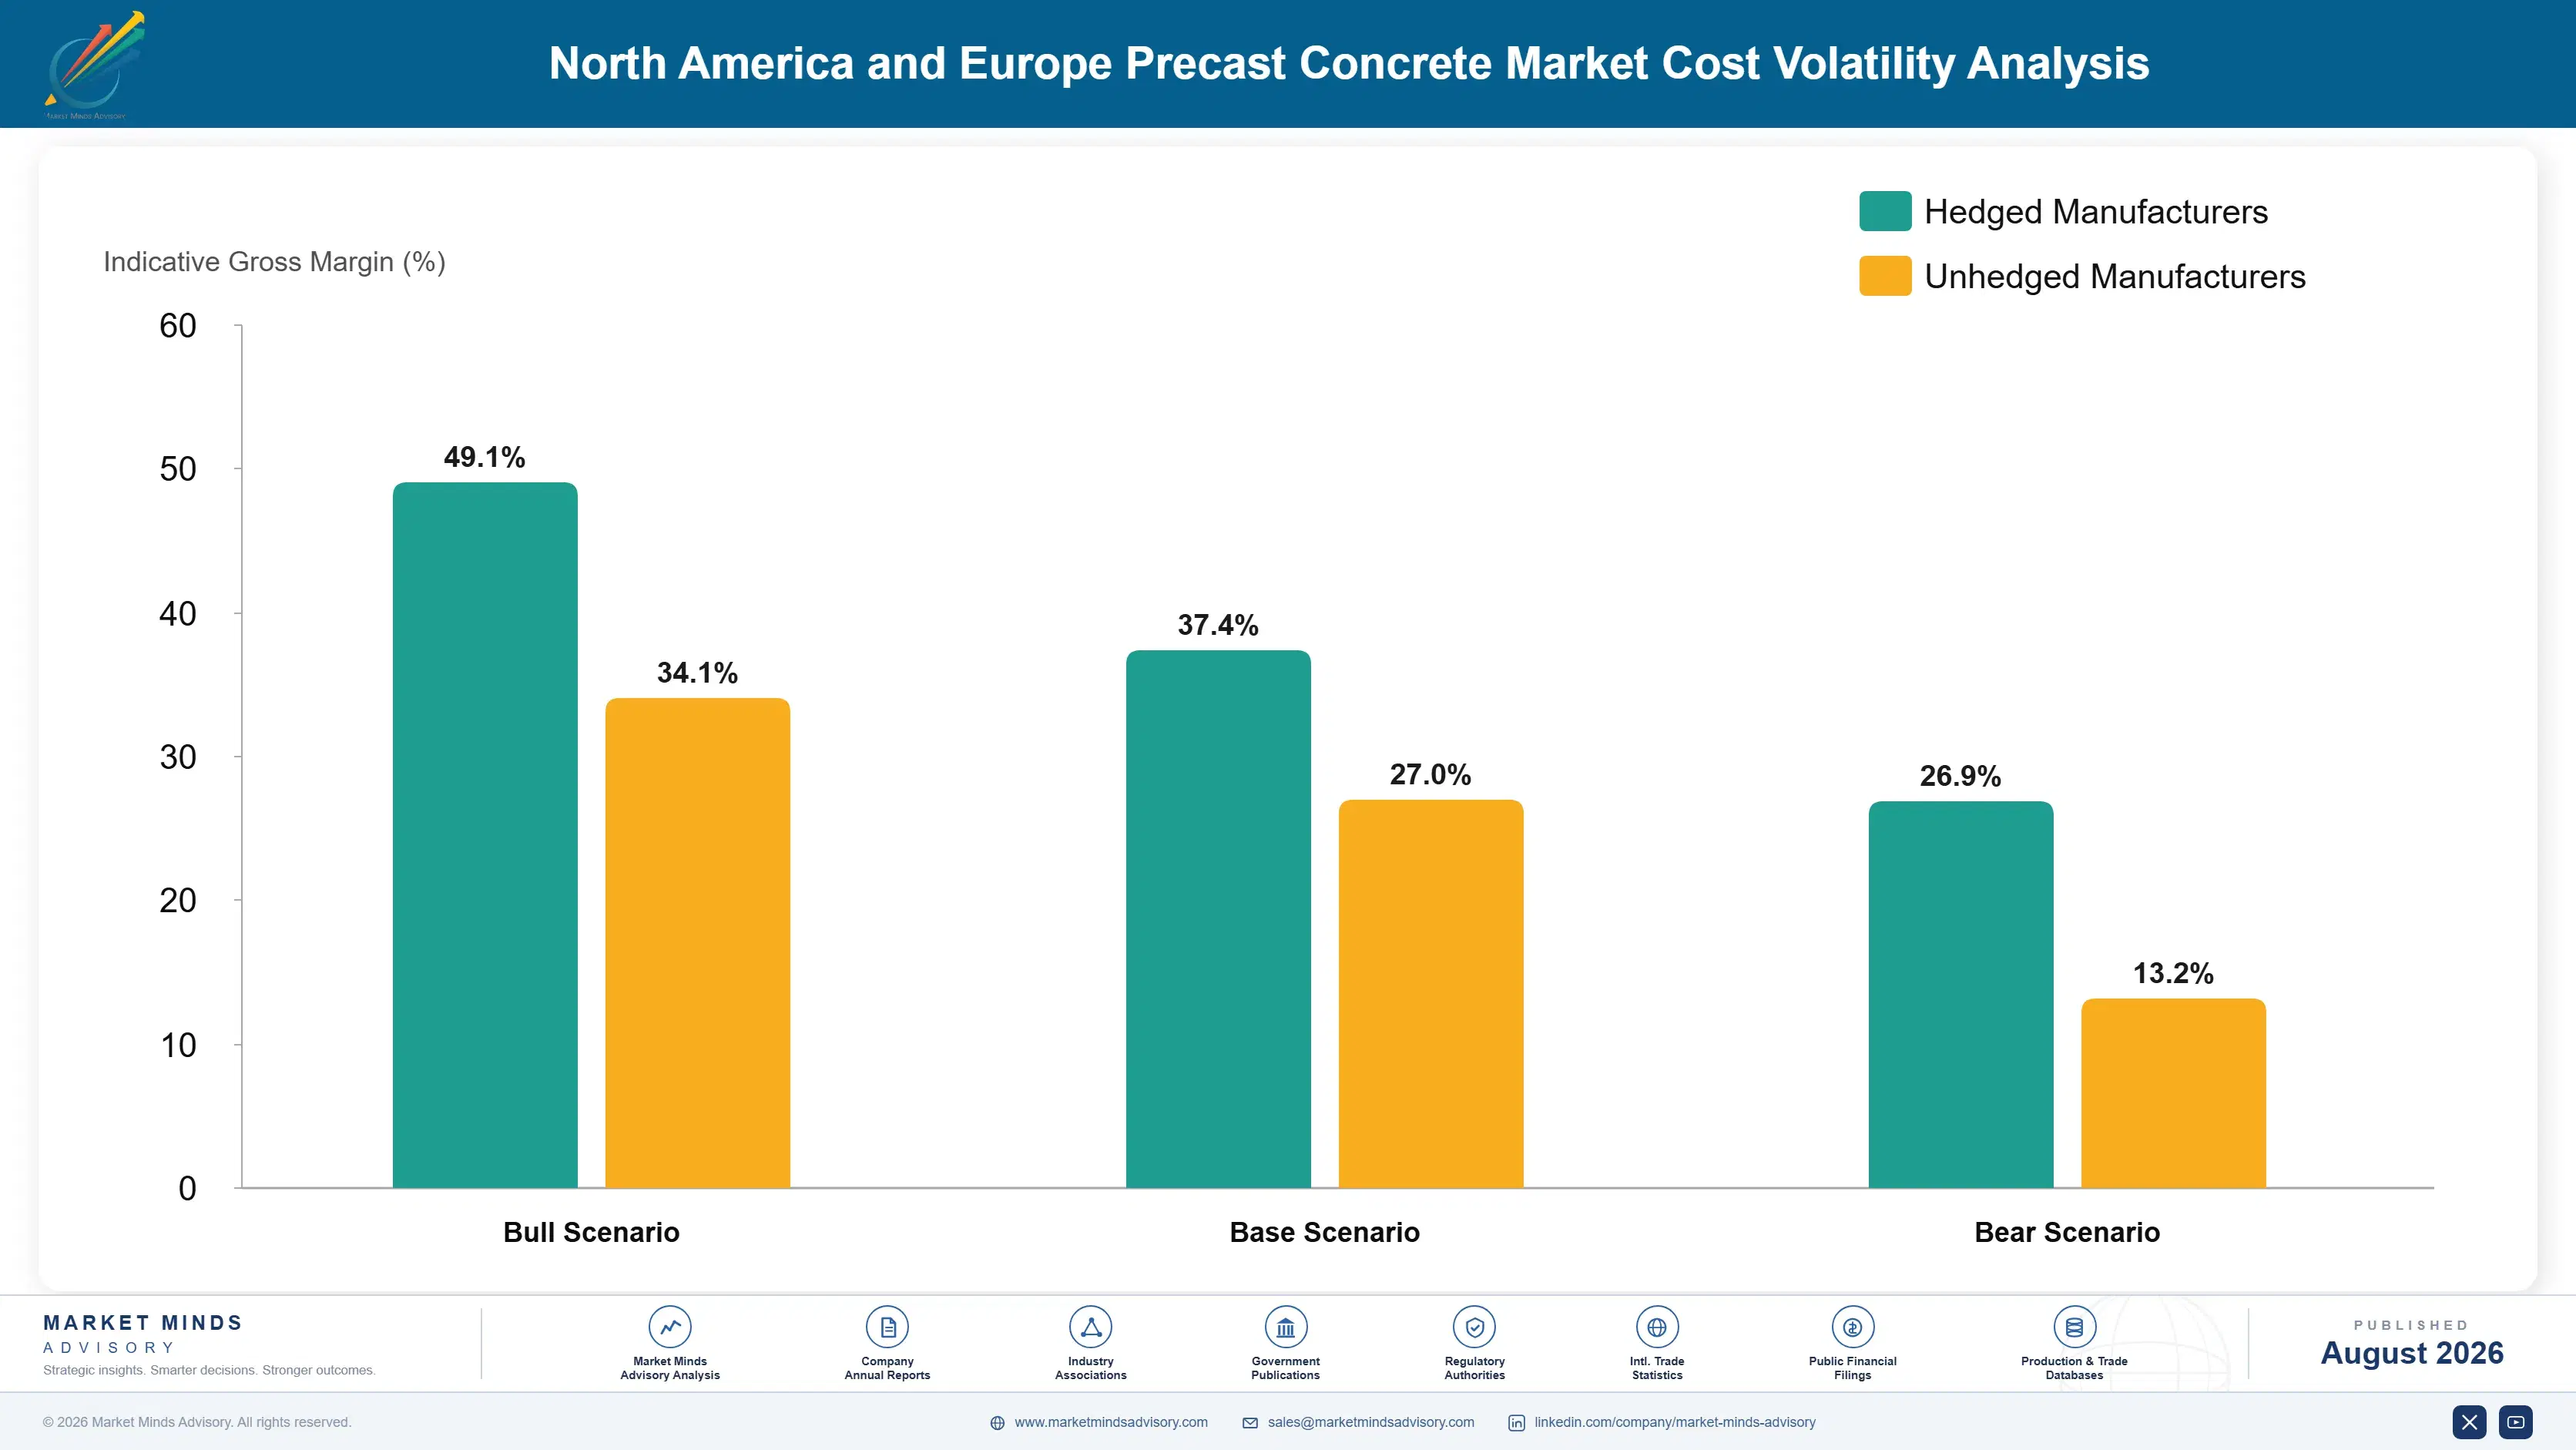
Cement and supplementary cementitious materials account for roughly 34% of element cost, with aggregates adding about 12% and reinforcing or prestressing steel a further 18%. Factory labour, moulds and curing energy together carry around 21%, considerably less per unit than the site labour the element displaces. Outbound freight takes the balance and rises steeply with distance, which is what enforces the delivery radius in the first place.
European cement and energy costs rose sharply through 2022 as gas prices climbed and carbon allowance costs increased, per IEA industrial energy data and published European allowance pricing for that period. Precast producers holding fixed price project contracts absorbed a substantial share, since construction contracts rarely reprice for material movement inside a build programme. Several European producers disclosed margin compression in reporting for that year and repriced subsequent tenders accordingly.

Exposure differs with mix flexibility and contract structure. A producer holding qualified alternatives to fly ash and slag can substitute as availability shifts, while one committed to a single replacement material carries whatever happens to it. Carbon allowance cost divides the two regions permanently, since European producers pay it through cement pricing and North American producers largely do not.
precast-concrete-market-trends-cost-volatility-analysis-1787580409509

Qualify several supplementary cementitious materials in advance

Holding structural qualification for slag, calcined clay and harvested ash alongside fly ash lets a producer substitute as availability shifts, which coal retirement schedules make inevitable. Qualification requires mix development, structural testing and declaration recalculation, costing perhaps 250 thousand dollars per material across an element range, and it cannot be done quickly once supply tightens.

Include material escalation in project contract terms

Construction contracts rarely reprice for material movement inside a build programme, which left producers absorbing the 2022 cement and energy increases in full. Including a defined escalation mechanism tied to published indices transfers that risk appropriately. Contractors resist it in strong markets and accept it after a supplier has failed on them, which is a familiar pattern across construction materials.

Optimise mould reuse before optimising concrete mix

Mould cost and reuse frequency drive element cost more than concrete mix design does on most architectural work, and producers focused on binder optimisation frequently miss the larger saving entirely. Engaging on geometry during design shapes mould count directly. The saving costs nothing and requires only being in the room early. Binder optimisation frequently misses the larger saving entirely.

Portfolio Architecture for Margin Defence

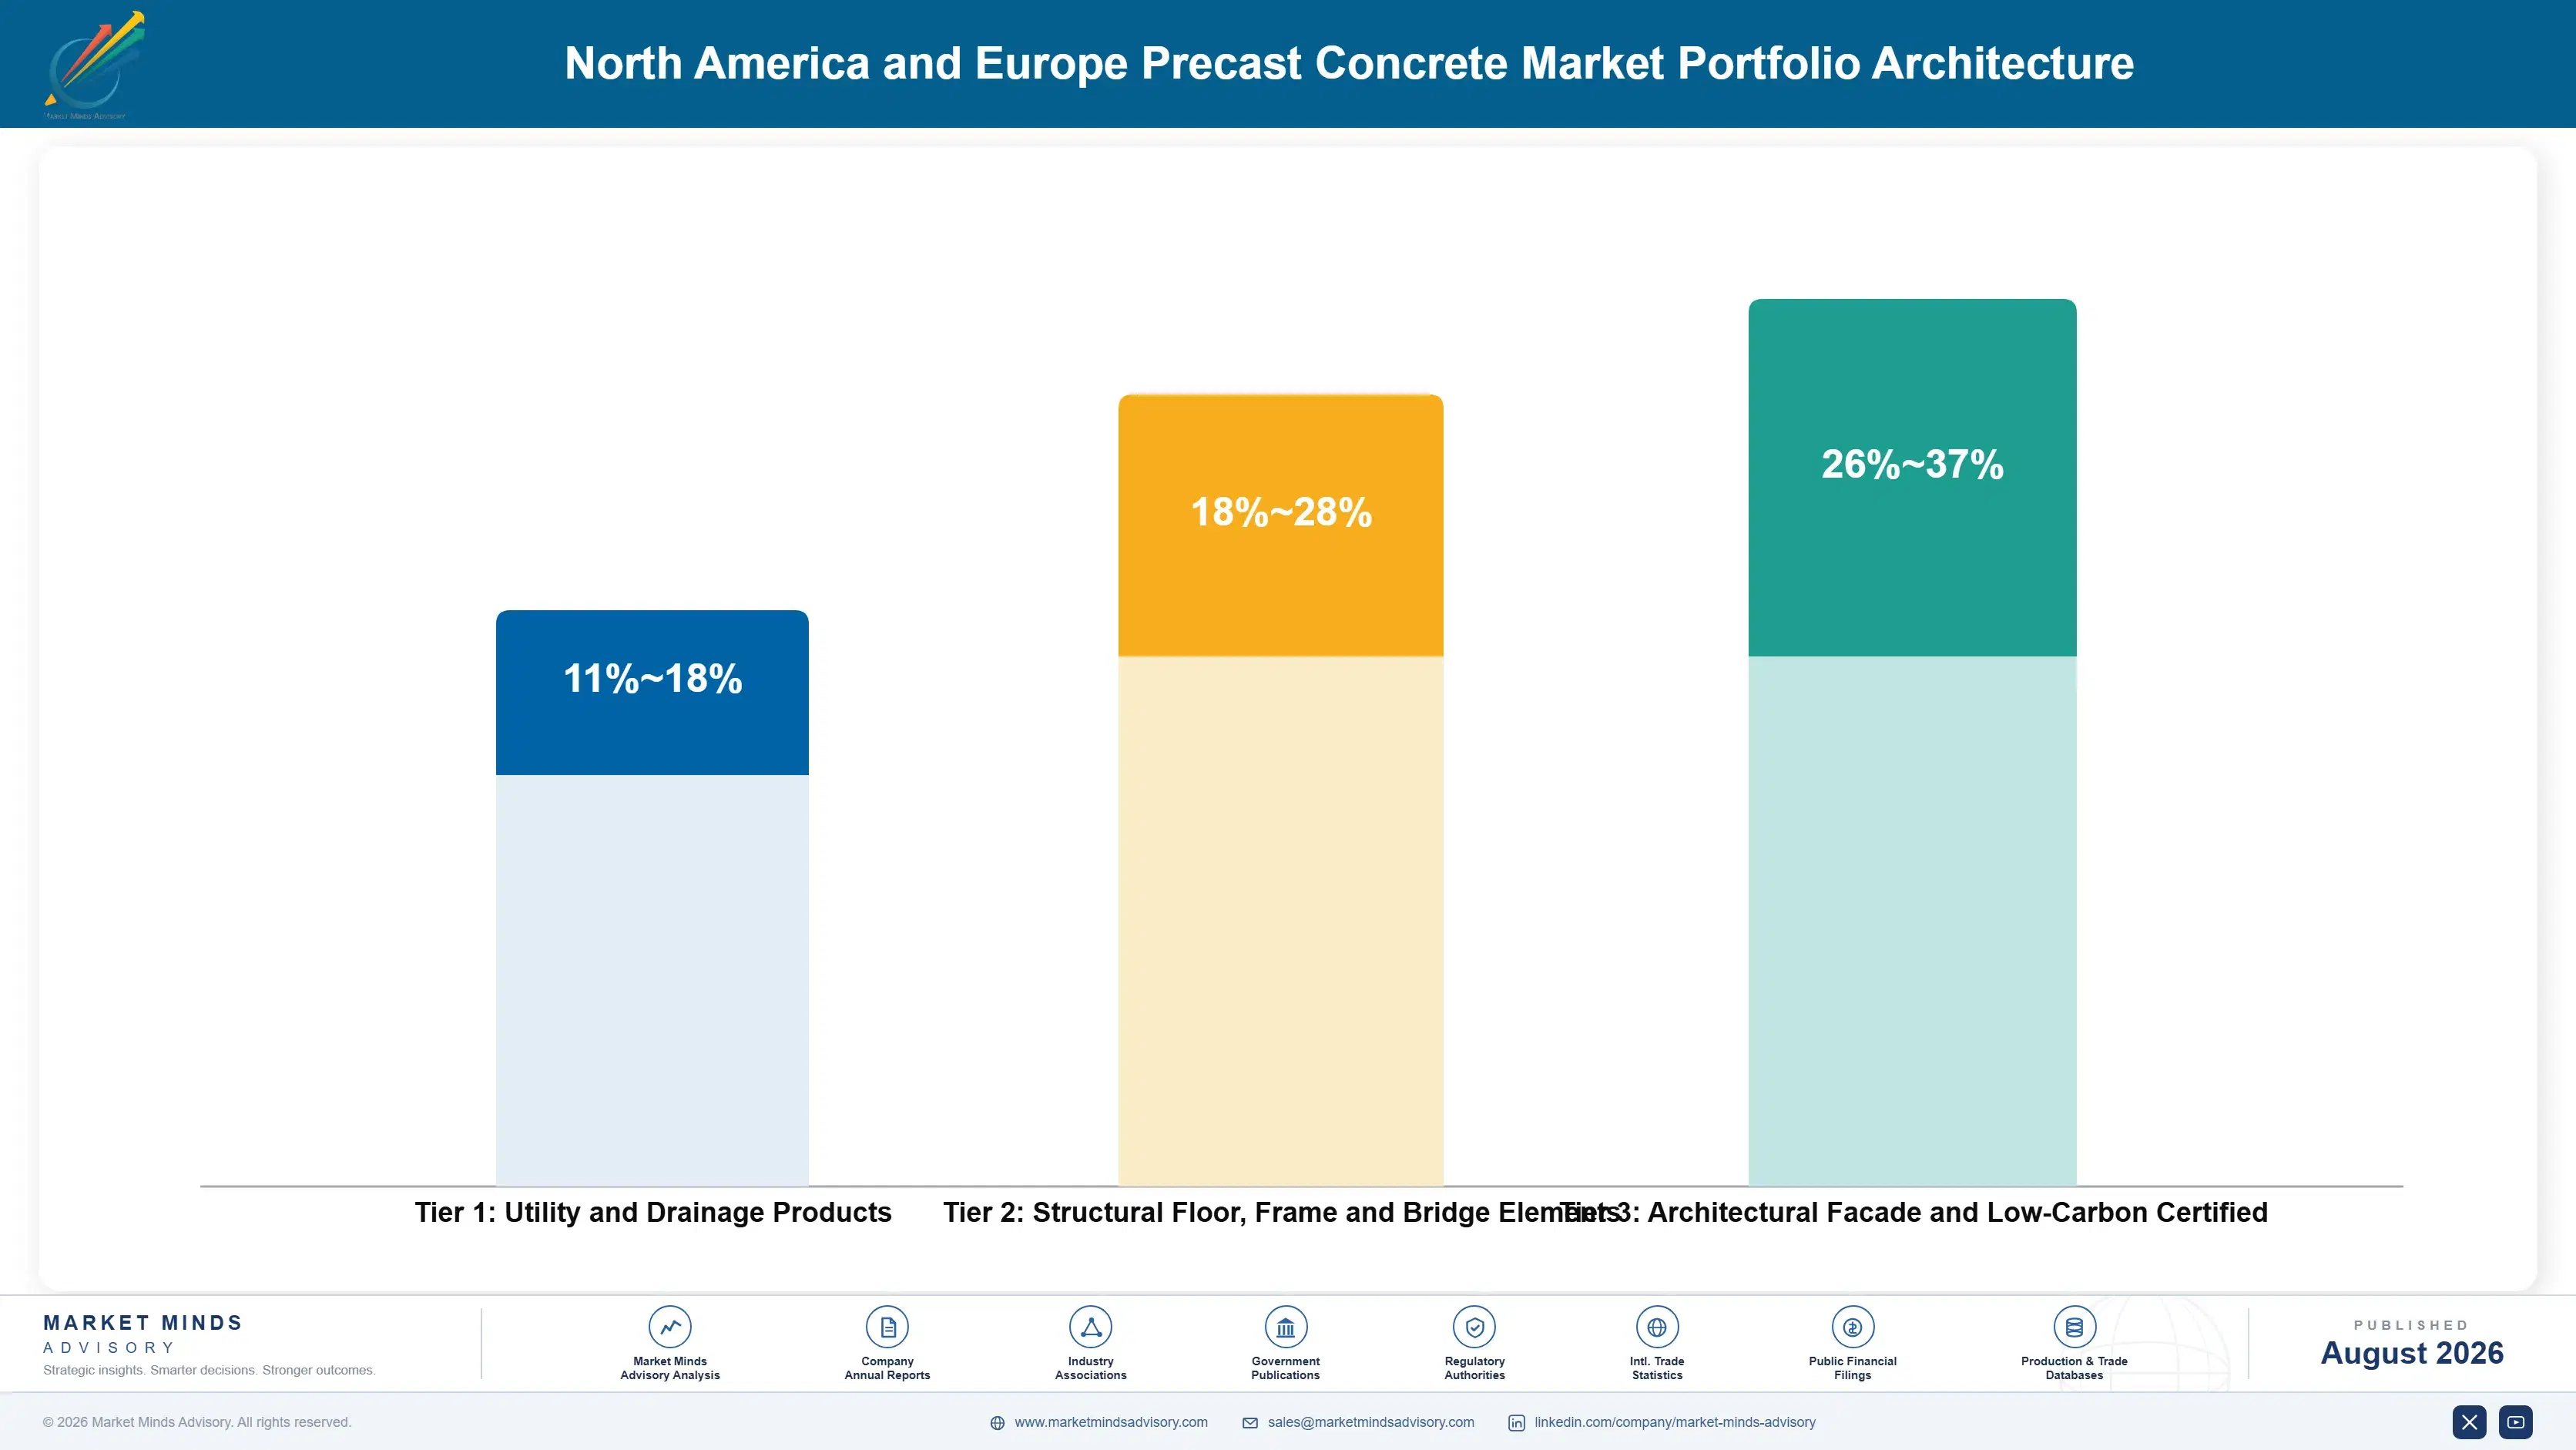
Margin here tracks specification involvement rather than volume or element type. Standard utility and drainage products earn margins in the low teens, because pipes, culverts and manholes are made to published standards, every producer in a catchment can supply them, and contractors buy on delivered price against a schedule of rates. Nothing about that tier rewards capability. Contractors buy against a published schedule of rates and nothing else.
Structural elements do better at margins in the high teens to high twenties, since engineering involvement, connection design and erection sequencing all matter and a producer working with the structural engineer shapes what gets specified. The range reflects how early that involvement started, which is the whole variable and which many producers never manage to influence at all. Many producers never manage to influence it at all.

Architectural facade holds the strongest economics, running into the mid thirties, where finish capability, mould investment and design collaboration exclude most of a catchment's producers. Those margins reflect a design relationship rather than any manufacturing advantage, and they persist because a facade optimised around one producer's moulds prices badly at every competitor. A design relationship is harder to displace than any manufacturing advantage would be.

Utility and Drainage Products

Pipes, culverts, manholes and box units made to published standards and bought on delivered price. Every producer in a catchment can supply them, so the seven point range reflects freight position and plant utilisation alone.
Gross Margin: 11-18%

Structural Floor, Frame and Bridge Elements

Hollowcore, double-tee, column, beam and bridge elements where engineering involvement and connection design matter. The ten point range reflects how early a producer engaged with the structural engineer on the project.
Gross Margin: 18-28%

Architectural Facade and Low-Carbon Certified

Architectural panels with specialist finishes and elements carrying documented low-carbon declarations. The eleven point range reflects finish complexity and whether declaration data was already available or assembled retrospectively. Retrospective assembly costs considerably more.
Gross Margin: 26-37%
precast-concrete-market-trends-portfolio-architecture-1787580410016

High-value Sub-segments and Strategic Watch-out

Architectural Facade Panels

High value and the fastest growth at 7.2%, won during architectural design rather than at tender. Finish capability and mould investment exclude most producers in a catchment, and geometry optimised around one supplier prices badly elsewhere. Design engagement decides who supplies it. Tender stage is far too late.
Gross Margin: 29-37%

Segmental Tunnel Linings

High value and entirely captive demand at 6.4%, since a bored tunnel has no cast in place alternative available. Tolerance and gasket sealing requirements are far tighter than ordinary precast, and plants are frequently project specific. Tunnelling programmes are published years ahead. Demand is genuinely captive.
Gross Margin: 22-30%

Utility and Drainage Products

The volume core and permanently price-led within each catchment. Published standards make elements interchangeable and contractors buy against a schedule of rates. Growth follows infrastructure spending with no specification premium available. Freight position and plant utilisation are the only cost levers available anywhere. Standards make elements interchangeable.
Gross Margin: 11-18%

Modular Volumetric Precast

The strategic watch-out. Volumetric modular has consumed substantial capital across both regions with several high-profile failures behind it. The wide range reflects how differently projects have performed rather than any settled economics. Several sponsors have written off substantial capital here already. Economics remain genuinely unsettled.
Gross Margin: 8-24%

How the Catchment Work Repeats

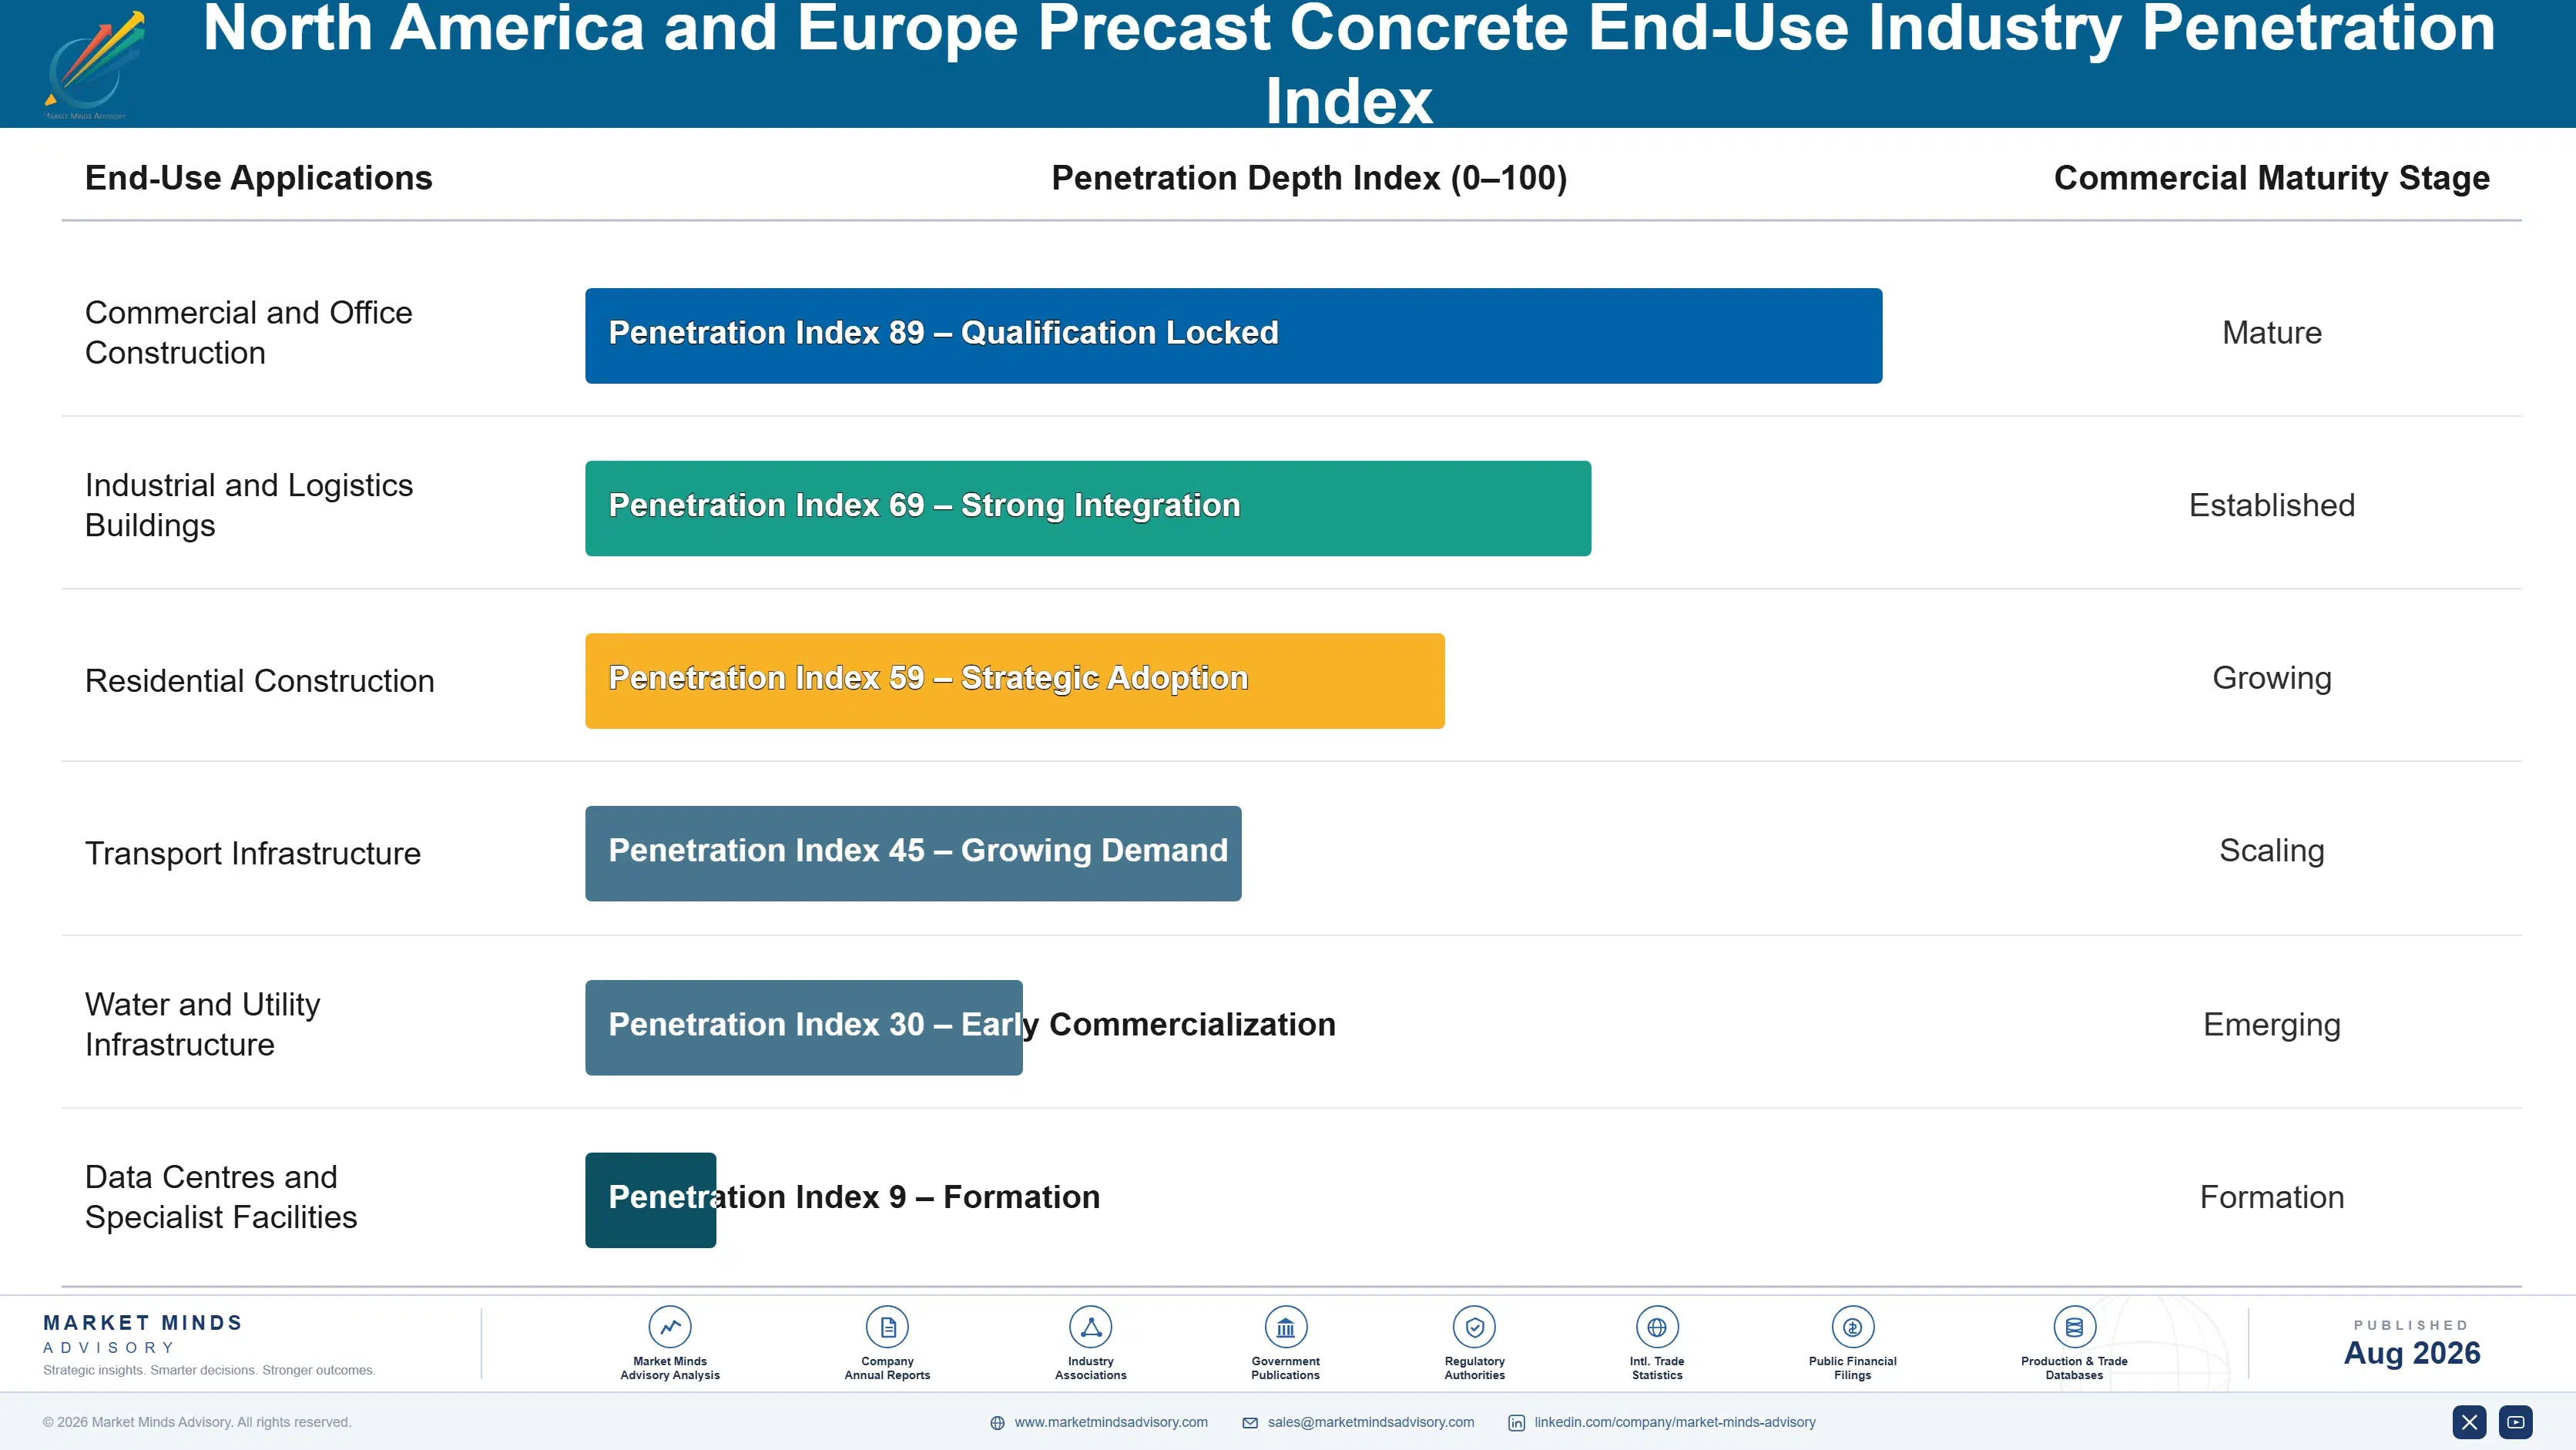
Precast demand repeats project by project rather than continuously, which makes it unlike most industrial materials. A producer wins a building, delivers over months and then competes again, so backlog rather than contract tenure is what provides visibility. Within a catchment the same contractors and engineers recur constantly, which turns repeated project work into something closer to a relationship business than the tendering process suggests.
Stickiness follows design involvement almost exactly. Architectural facade positions are stickiest, since geometry optimised around one producer's moulds prices badly at every competitor and the architect rarely wants to redesign. Structural work is moderately sticky where connection details and erection sequencing were developed jointly. Utility and drainage products switch on delivered price at every order, with published standards making elements genuinely interchangeable.

The specifying buyer sits earlier in the process than the purchase order suggests. Precast used to be bought by contractors comparing rates after design freeze. Labour scarcity and embodied carbon requirements pulled the decision toward architects, structural engineers and developers, who choose the construction method rather than the supplier and who are frequently not aware they have effectively chosen both.
precast-concrete-market-trends-end-use-penetration-index-1787580410512

Where We Would Commit Capital

These are among the four positions where our research anticipates prominent divergence between winners and laggards over the coming forecast period. Each is grounded in the demand model, the regulatory perimeter, and the announced capacity pipeline.
01 / LABOUR ARITHMETIC SELLING

Present delivered programme cost, never a rate per cubic metre

A precast element costs more per cubic metre and removes roughly 62% of the site labour hours that equivalent cast in place work consumes, which is the only comparison that matters to a developer facing trade shortages and financing costs against a fixed completion date. Presenting delivered programme cost moves the decision from a quantity surveyor to a project director. Producers who built that case with real programme data win work that a rate comparison would never have reached at all.
02 / DESIGN PHASE ENGAGEMENT

Shape the geometry before anybody prices the facade

Panel geometry determines mould count and reuse frequency, which drives architectural element cost far more than concrete mix design ever does, and those decisions are settled before a facade reaches tender. Engaging during the architectural phase lets a producer shape geometry toward its own mould economics while the architect still has freedom to move. That collaboration effectively decides the supplier, since a design optimised around one producer prices badly at every competitor who sees it afterwards, which effectively settles the award.
03 / CEMENTITIOUS MATERIAL QUALIFICATION

Qualify fly ash alternatives while the schedules are still public

Fly ash makes supplementary replacement near 38% economic and it disappears as coal generation retires across both regions on schedules that are entirely public. Ground granulated slag, calcined clay and harvested pond ash each carry availability, cost or performance limitations that fly ash never had, and qualification requires mix development and structural testing work that simply cannot be compressed. Producers starting that work now will hold declaration positions that late movers simply cannot match once the ash actually runs short.
04 / CATCHMENT EXPANSION STRATEGY

Buy or build inside catchments, not national scale

Freight economics collapse beyond roughly 300 kilometres, so a larger central plant extends no catchment and merely concentrates fixed cost in one place. Satellite capacity inside a new catchment is the only genuine route to growth, at perhaps 40 million dollars for a structural plant of useful scale. That constraint explains why concentration across both regions sits at 18% after decades of acquisition activity, and why national consolidation strategies in this industry have so consistently disappointed the sponsors who pursued them.

Engagement Snapshot From the Field

A live engagement with an industry participant carrying material or product regulatory and market exposure ahead of a defining policy shift, showing how our research translates into a defensible multi-year portfolio strategy.
MARKET MINDS ADVISORY · CLIENT ENGAGEMENT SUMMARY
North America and Europe Precast Concrete Producer Strategic Portfolio Review and Transition Roadmap 2026·Investment Scenario on North America and Europe Precast Concrete Exposure Evaluation 2025-26
CLIENT PROFILE
A North American structural precast producer operating three plants across the Midwest, with annual revenue near 260 million dollars split between structural frame elements and utility products (client-reported, unverified by MMA). Architectural facade capability was limited to basic finishes, and the business competed almost entirely at tender stage rather than during project design. No declaration infrastructure existed.
STRATEGIC CHALLENGE
Utility product margins had compressed to single digits across all three catchments, and a Buy Clean procurement requirement in an adjacent state had excluded the company from two public tenders for want of element-level declaration data. Management needed to decide between capacity expansion, facade capability investment and declaration infrastructure, with capital for roughly two.
MMA APPROACH
MMA mapped catchment coverage and delivered cost against competitors within 300 kilometres of each plant, costed architectural finish capability and declaration data infrastructure separately, and assessed fly ash availability against regional coal retirement schedules. Design phase engagement practice was tested with eleven architects and structural engineers. Interviews with 47 experts covered precast production, embodied carbon procurement and construction labour supply.
KEY FINDINGS
  1. Utility product margins could not be recovered in any catchment, since published standards made elements interchangeable and three competitors held comparable freight positions in each.
  2. Element-level declaration infrastructure cost roughly 900 thousand dollars to establish and would have qualified the company for both excluded tenders and several more expected.
  3. Nine of eleven architects interviewed had never been approached by a precast producer during design, and all nine said geometry would have changed if they had been.
  4. Regional fly ash availability was projected to fall by more than half within six years on announced coal retirement schedules, with no alternative currently qualified.
CLIENT PROFILE
A North American structural precast producer operating three plants across the Midwest, with annual revenue near 260 million dollars split between structural frame elements and utility products (client-reported, unverified by MMA). Architectural facade capability was limited to basic finishes, and the business competed almost entirely at tender stage rather than during project design. No declaration infrastructure existed.
STRATEGIC CHALLENGE
Utility product margins had compressed to single digits across all three catchments, and a Buy Clean procurement requirement in an adjacent state had excluded the company from two public tenders for want of element-level declaration data. Management needed to decide between capacity expansion, facade capability investment and declaration infrastructure, with capital for roughly two.
MMA APPROACH
MMA mapped catchment coverage and delivered cost against competitors within 300 kilometres of each plant, costed architectural finish capability and declaration data infrastructure separately, and assessed fly ash availability against regional coal retirement schedules. Design phase engagement practice was tested with eleven architects and structural engineers. Interviews with 47 experts covered precast production, embodied carbon procurement and construction labour supply.
KEY FINDINGS
  1. Utility product margins could not be recovered in any catchment, since published standards made elements interchangeable and three competitors held comparable freight positions in each.
  2. Element-level declaration infrastructure cost roughly 900 thousand dollars to establish and would have qualified the company for both excluded tenders and several more expected.
  3. Nine of eleven architects interviewed had never been approached by a precast producer during design, and all nine said geometry would have changed if they had been.
  4. Regional fly ash availability was projected to fall by more than half within six years on announced coal retirement schedules, with no alternative currently qualified.
RECOMMENDED STRATEGY
Phase 1: Phase one: build element-level declaration infrastructure immediately, since public procurement exclusion is already costing tenders and the cost is modest against that. Phase 2: Phase two: invest in architectural finish capability and begin design phase engagement with the architects who have never been approached by any producer. Phase 3: Phase three: qualify slag and calcined clay alternatives ahead of the fly ash decline, rather than expanding utility capacity that cannot earn a return.
OUTCOME
The producer completed declaration infrastructure within eight months and won three previously inaccessible public tenders during 2026 (client-reported, unverified by MMA). Architectural capability investment began in the same year, and utility product volumes were allowed to decline rather than being defended on price. Fly ash alternatives remain unqualified at present.

Frequently Asked Questions

Foundational context covering the market sizes, CAGR, scope, country, region and competition that inform every finding below. This section is provided to cover basics and most often pre-purchase conversations, answered from the MMA Primary Research Dataset.

What is the current size of the North America and Europe Precast Concrete Market?

MMA sizes it at USD 74.0 billion in 2025, rising to USD 77.55 billion in 2026. The figure covers factory-cast concrete elements across North America and Europe at producer selling price.

How large will the North America and Europe Precast Concrete Market be by 2036?

USD 123.94 billion by 2036, an incremental USD 46.39 billion over the 2026 base and an expansion multiple of 1.60 times. Facade and tunnel elements account for a disproportionate share.

What is the CAGR for the North America and Europe Precast Concrete Market 2026 to 2036?

4.8% in the base case, with a bull case at 6.0% and a bear case at 3.6%. The spread turns on construction labour scarcity and on supplementary cementitious material availability.

Which segment is growing fastest?

Wall panels and architectural facade at 7.2%, half again the market rate of 4.8%. That is where site labour intensity was highest and where the factory arbitrage is therefore largest.

Who are the major companies in the North America and Europe Precast Concrete Market?

CRH, Holcim, Consolis, Cemex and Forterra lead on annual element production volume, holding only 18% between them. Fifteen further participants are profiled in the full report.

Which country is growing fastest?

Poland at 6.9%, on cohesion and recovery funded road, rail and water infrastructure alongside a large domestic precast industry that also exports into neighbouring markets.

Report Segmentation Architecture

The full report scope spans multiple orthogonal segmentation dimensions, with cross-tabulated demand data provided for each dimension pair. Coverage extends further to regional breakdowns, trend trajectories, and the competitive detail needed to support segment-level decision-making.

By Element Type

  • Structural Floor and Roof Elements
  • Wall Panels and Architectural Facade
  • Utility and Drainage Products
  • Segmental Tunnel Linings
  • Bridge and Highway Elements
  • Modular and Volumetric Units

By End-Use Industry

  • Commercial and Office Construction
  • Industrial and Logistics Buildings
  • Residential Construction
  • Transport Infrastructure
  • Water and Utility Infrastructure
  • Data Centres and Specialist Facilities

By Commercial Dimension

  • Direct Supply to Main Contractors
  • Design and Build Packages
  • Public Procurement Tenders
  • Developer Nominated Supply
  • Specialist Subcontract Erection
  • Project Specific Plant Arrangements

By Region

  • North America
  • Western Europe
  • East Asia
  • South Asia and Pacific
  • Latin America
  • Middle East and Africa
  • Eastern Europe

Scope, Methodology, and Coverage

Every figure in this report is reproducible from documented input assumptions. The scope below maps the historical period, the forecast horizon, the segmentation dimensions, and the countries covered, alongside the underlying primary and qualitative methodology.
Historical Period
2020 to 2025
Forecast Period
2026 to 2036
Base Year
2025 (USD billions; MMA Primary Research Dataset, August 2026)
Market Definition
Concrete elements cast in controlled factory conditions and transported to site for erection across North America and Europe, spanning structural floor and roof elements, wall panels and architectural facade, utility and drainage products, segmental tunnel linings, bridge and highway elements, and modular volumetric units, measured at producer selling price. Ready-mixed concrete, cast in place construction, concrete masonry units, cement and aggregates sold as such, and precast production outside the two defined regions are excluded from scope.
Quantitative Units
USD billions (current prices); million cubic metres produced annually; USD per cubic metre by element type and region
Segmentation Dimensions
Element type; end-use industry; commercial dimension; region
Regions Covered
North America, Western Europe, East Asia, South Asia and Pacific, Latin America, Middle East and Africa, Eastern Europe
Countries Covered
United States, Canada, Mexico, Germany, Netherlands, Belgium, France, United Kingdom, Sweden, Finland, Denmark, Norway, Italy, Spain, Austria, Switzerland, Poland, Czech Republic, Slovakia, Romania
Key Companies Profiled
CRH, Holcim, Consolis, Cemex, Forterra, Wienerberger, Heidelberg Materials, Tindall Corporation, Coreslab Structures, Metromont, Bison Manufacturing, Kerkstoel Beton, Decomo, Betonson, Pekabex, Rector Lesage, Spancrete, Wells Concrete, County Materials, Shea Concrete Products
Quantitative Methodology
Primary survey, n=3,800 respondents, Q4 2025, six countries; demand-side model with trade association cross-validation
Qualitative Methodology
47 expert interviews, Q4 2025; applied to validate demand model assumptions, identify emerging dynamics, and assess competitive positioning
Report Format
PDF and XLSX data workbook (Word format preview document)
Publisher
Market Minds Advisory
Report Code
MMA-2026-CON-108
Published
August 2026
Contact
sales@marketmindsadvisory.com | www.marketmindsadvisory.com

Purchase the full North America and Europe Precast Concrete Market Report (2026 to 2036).

The full report sizes each element type independently through 2036 across North America and Europe, and quantifies the site labour arbitrage that actually drives precast conversion. It maps supplementary cementitious material availability against announced coal retirement schedules, tracks embodied carbon declaration requirements by procuring jurisdiction, and models catchment economics against the transport radius that keeps this industry fragmented. Regional chapters cover the defined scope in depth with plant catchment detail where disclosure permits. Competitive profiling covers 20 participants on a single production volume basis, with catchment economics modelled against transport radius limits.
Each element type sized independently across both regions
Site labour arbitrage quantified against cast in place work
Cementitious material availability mapped to coal retirement schedules
Declaration requirements tracked by procuring jurisdiction
Twenty participants profiled on one consistent basis
Catchment economics modelled against transport radius limits

Built For The People Who Decide

From boardroom strategy to bench-side execution, this report is read cover-to-cover by leaders shaping the next decade of their industry, turning demand scenarios, market dynamics and valuation benchmarks into decisions.
CXOs/ Presidents/ VPs/ Managers
M&A and Corporate Development
Strategy Teams and R&D Heads
Procurement and Product Directors
Regulatory and Compliance Leaders
Investor Relations and Equity Analysts