
Market Minds Advisory
Odometer Market

Odometer Market: The Vanished Component, Mileage Fraud Economics and Verification Value to 2036       

There is no odometer left to buy in a modern vehicle, only a number held in memory, and the money has moved from making that number to proving it has not been changed.

Lead Analyst

David Horsley

Published

September 2026

Make Smarter Decisions with Customized Research Insights

Request a free sample report and evaluate market opportunities, growth trends, and competitive dynamics relevant to your business needs.

2025 MARKET VALUE$3.8BMarket Size 2025
2036 FORECAST VALUE$8.5BBase Case , 2026 to 2036
CAGR 2026 TO 20367.6 %Bull 8.8% / Bear 6.4%
INCREMENTAL OPPORTUNITY$4.4BNet 10- year value creation
EXPANSION MULTIPLE2.08x2036 value over 2026 base
Strategic Levers
M&A Pipeline
Regional Outlook
Country Rankings
Competitive Intelligence
Segmental Deep-dive
Call-Us : 91 93563 13602

Executive Snapshot and Market Trajectory

In 88% of new vehicles the odometer is a value held in memory inside the instrument cluster and mirrored across other control units. There is no separate part to specify, source or fit. The component market has quietly dissolved into the cluster market.
The economics moved somewhere far more interesting. Equipment capable of altering that stored value costs around forty dollars, roughly 8% of used vehicle transactions carry a falsified reading, and a rolled-back figure adds about 25% to an advertised price. Enormous incentive, trivial barrier, and a number that most commercial decisions in the used market still depend on entirely. Nothing in the vehicle prevents it, because the value must stay writable.
Mileage verification and data integrity services grow at 11.4%, half again the market rate of 7.6%, because national registries, inspection-recorded readings and telematics now covering 43% of the parc are turning a claim into an auditable record. East Asia holds 36% of value on vehicle and two-wheeler production concentration. Lessors and insurers pay for it, because their underwriting does not function against a figure anybody can rewrite. A consumer check is worth far less.
Market Definition
This report covers vehicle distance recording instrumentation and the services that verify it, spanning digital instrument cluster odometry, mechanical and hybrid analogue units, commercial vehicle tachograph-linked systems, two-wheeler and small vehicle instrumentation, mileage verification and data integrity services, and replacement repair and cluster programming. Value is measured at supplier level across instrumentation hardware and mileage service revenue. Excluded are complete instrument clusters where distance recording is incidental, full telematics platforms sold for fleet management, vehicle history reports covering matters beyond mileage, and speedometer or navigation functions.
Base Year Value
$3.8B in 2025 (MMA Primary Research Dataset, August 2026)
Forecast Period
2026 to 2036, eleven discrete annual values
CAGR
7.6% base case. Bull 8.8%. Bear 6.4%.
Fastest Growth Segment
Mileage Verification and Data Integrity Services: 11.4% CAGR
Fastest Growth Country
India: 10.6% CAGR
Fastest Growth Region
South Asia and Pacific: 9.6% CAGR
Largest Region
East Asia: 36% of 2025 global value
Market Leaders
Continental, Robert Bosch, DENSO, Visteon and Nippon Seiki lead the market. Source: MMA Primary Research Dataset, July 2026.
Primary Survey
n=3,800 procurement and R&D decision-makers, Q4 2025, six countries
Methodology
Demand-side build-up, cross-validated against public data, 47 expert interviews

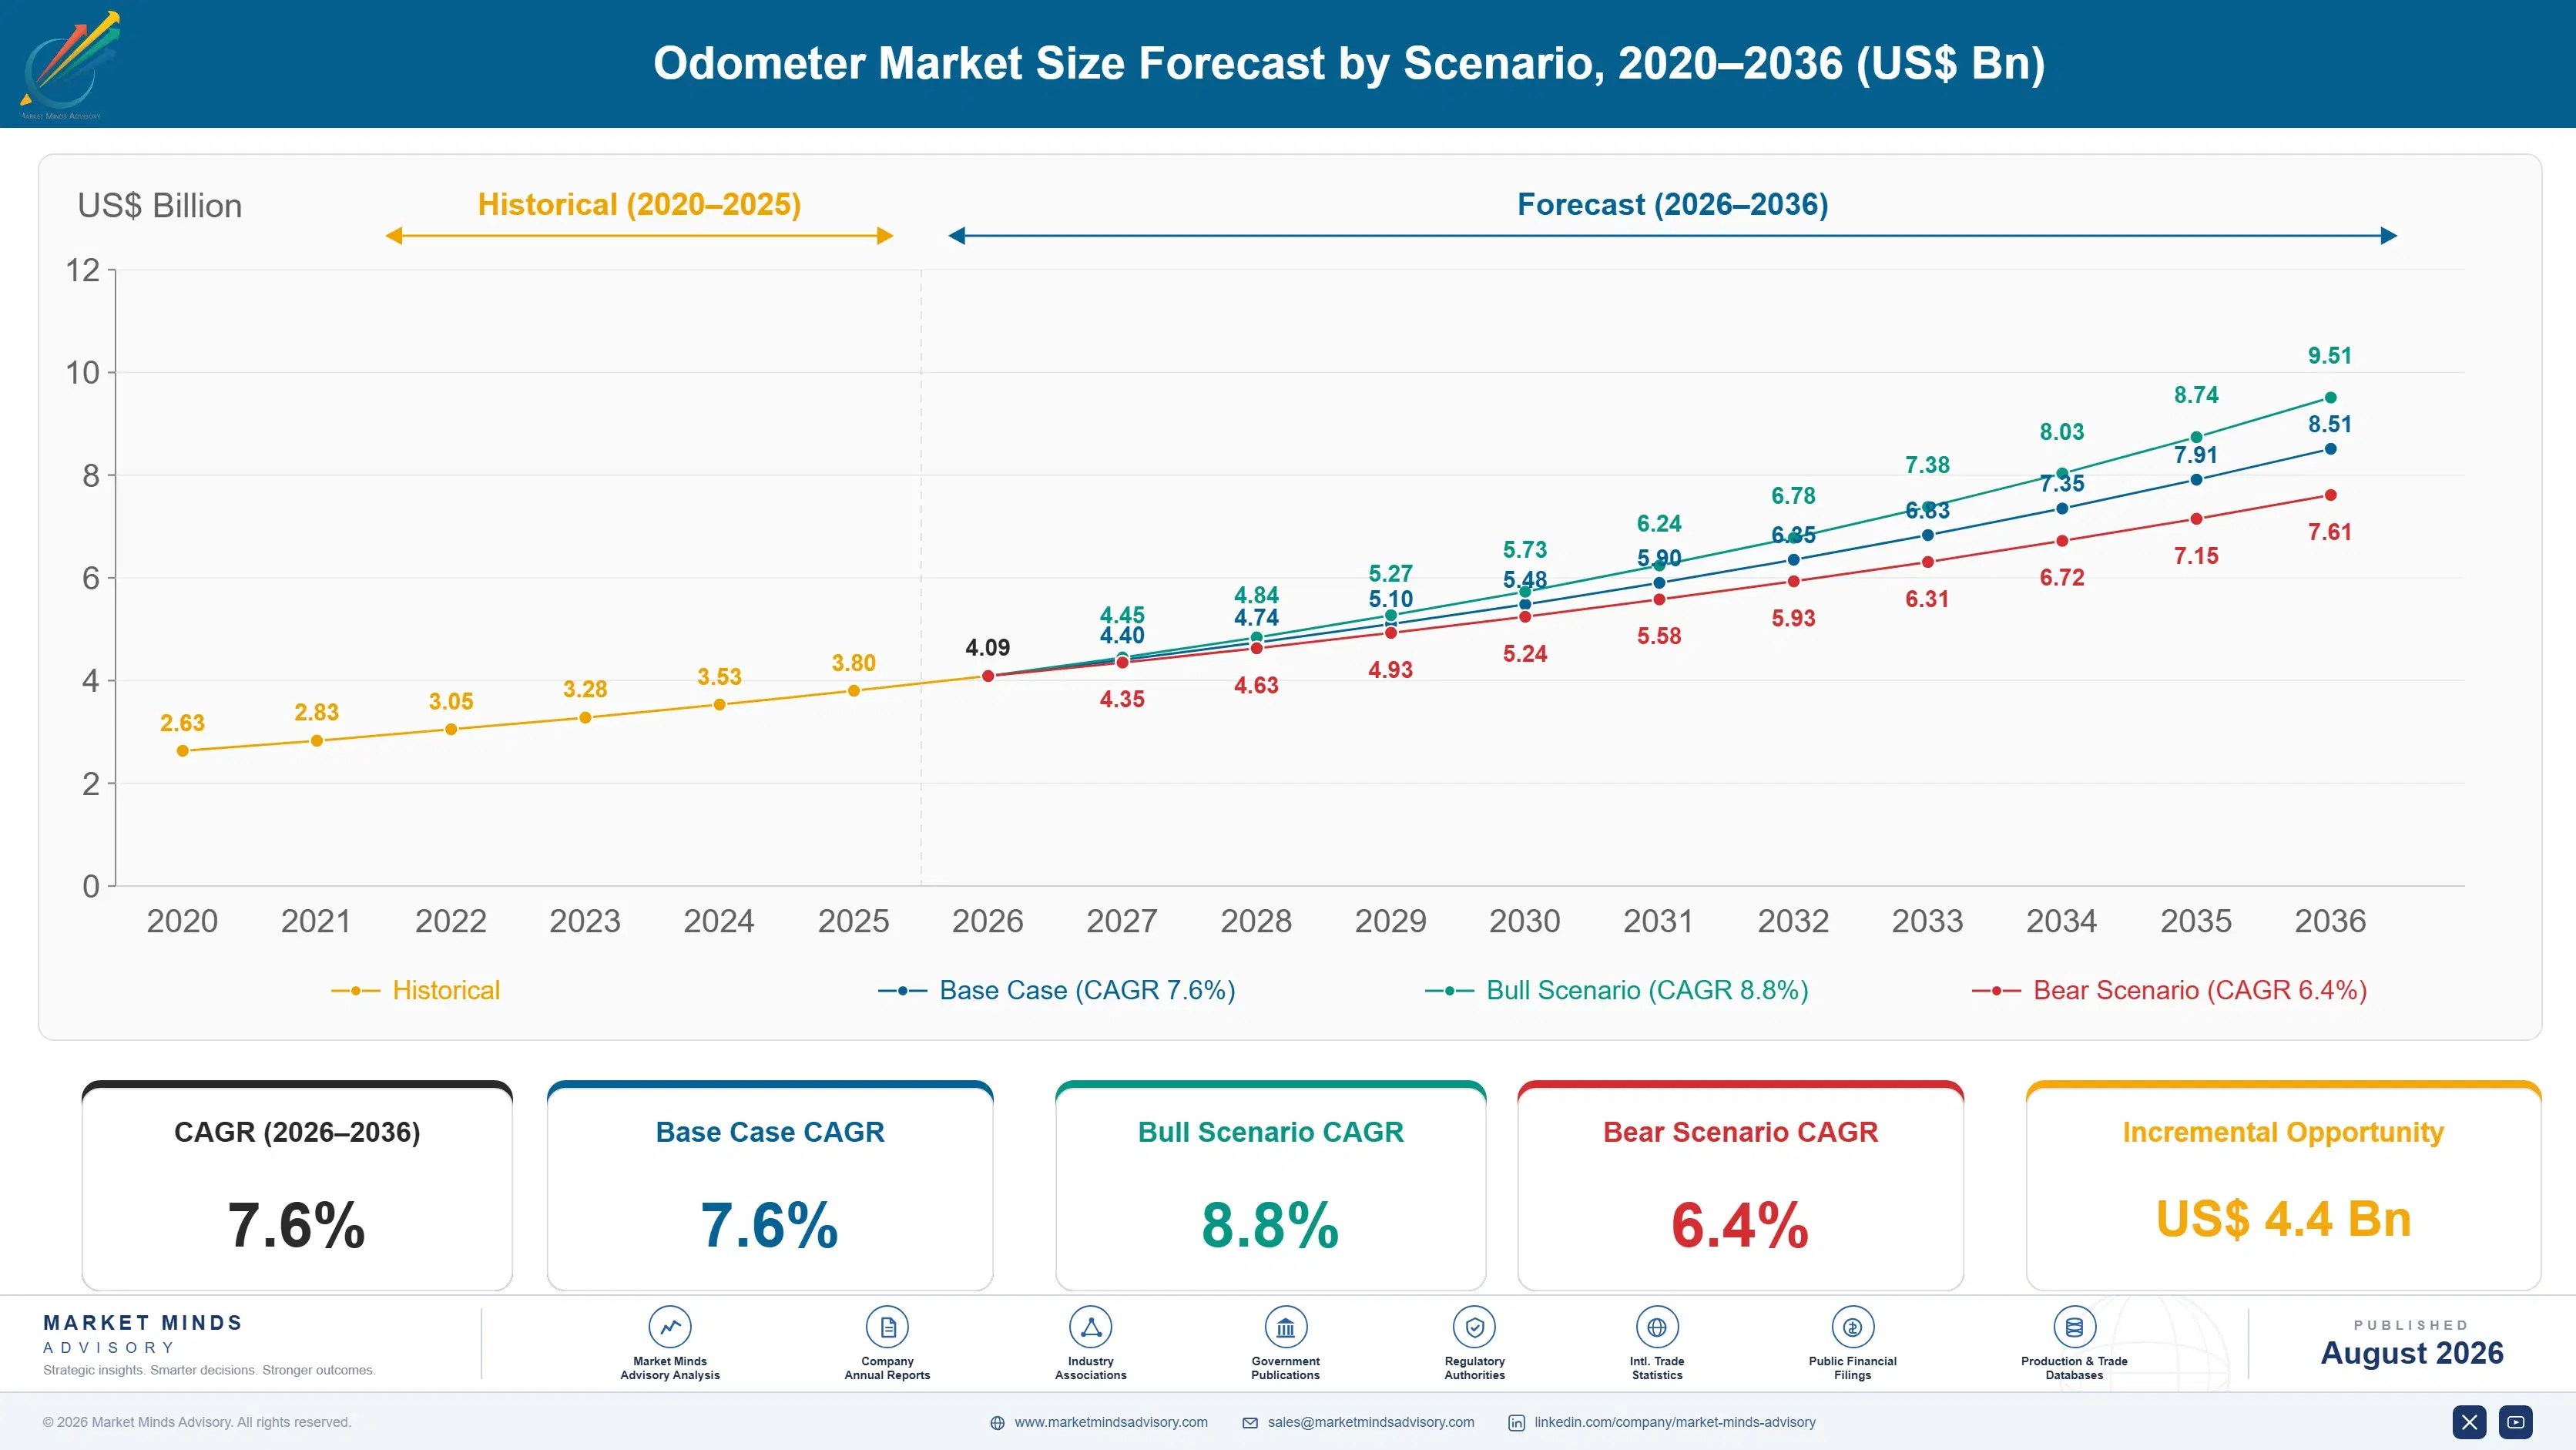
Odometer Market Forecast Scenarios

odometer-market-size-forecast-scenario-1787559377984
Growth ran at 6.2% between 2020 and 2025 and it was almost entirely a story about instrument clusters rather than about odometry itself. Digital cluster fitment rose steadily as even entry vehicles moved to electronic instrumentation, while the mechanical unit disappeared from new production altogether. Mileage verification existed at the edges through national registries and vehicle history providers without anybody treating it as a market.
The 7.6% base case rests on three mechanisms. Verification and data integrity services at 11.4% as registries, inspection records and telematics convert a mileage claim into something auditable. Commercial vehicle tachograph-linked systems at 7.2% under recording and tamper detection requirements. And Indian growth at 10.6%, the fastest of any country, on two-wheeler and passenger vehicle production expanding together at considerable volume. Two-wheeler content conversion alone covers tens of millions of units annually.
The 8.8% bull case is cross-border mileage record exchange extending further, which would make verification a transaction requirement rather than an optional check. The 6.4% bear case is verification remaining voluntary in most markets, since a service that nobody is obliged to buy competes against a used car dealer's genuine preference not to know. Policy rather than demand moves verification penetration.

Proving A Number Nobody Owns

Anybody researching this market looking for a component will not find one. In 88% of new vehicles the distance travelled is a value written to memory inside the instrument cluster and mirrored across the engine and transmission controllers, with no discrete part to specify, source or replace. The mechanical drum unit that gave this market its name has gone from new production entirely. What is left is a function inside a cluster and a number that leaves the factory meaning something.
TOP-FIVE CONCENTRATION46%Combined position across supply held by the leading instrumentation suppliers
USED VEHICLE MILEAGE FRAUD8%Share of second-hand transactions carrying an altered distance record
DIGITAL CLUSTER FITMENT RATE88%Portion of new vehicles built with fully electronic instrumentation
ROLLBACK TOOL COST40 USDPrice of equipment able to alter a stored distance value
TELEMATICS MILEAGE COVERAGE43%Share of the parc reporting distance directly to a manufacturer
VALUE IMPACT PER ROLLBACK25%Uplift a falsified reading adds to advertised resale price
Whether it still means anything by the time somebody buys the vehicle second hand is where the commercial interest now sits. Equipment capable of rewriting that stored value sells openly for around forty dollars, roughly 8% of used transactions carry an altered reading, and a rolled-back figure lifts an advertised price by about a quarter. The incentive is large, the barrier is negligible, and an enormous amount of used vehicle commerce still rests on a number that anybody with a laptop can change in a car park.
That gap is what verification services are being built to close, using inspection records, national registries and telematics reporting now covering 43% of the parc.
"The odometer stopped being a product about fifteen years ago and the research kept treating it as one. What matters commercially is that a forty dollar tool can add a quarter to a car's price, and everything worth building in this market is a response to that single arithmetic fact."
Director, Vehicle Electronics and Mobility Data Practice · MMA Automotive Components and Systems Practice · August 2026

Market Trends

Odometry disappears into the cluster as a stored value

Digital instrument clusters now account for 88% of new vehicle fitment, and within them distance travelled is simply a value written to memory and mirrored across several control units for cross-checking. There is no discrete odometer to source, specify or replace, which means the component market has dissolved into cluster electronics entirely. Commercially this leaves suppliers selling display and computing content rather than measurement, and any analysis treating odometry as a standalone hardware category is measuring an artefact that stopped existing across most of the vehicle parc. Suppliers now sell display and computing content instead.
Market Impact: Fraud affects 8% of transactions
Verification services convert mileage claims into auditable records

National mileage registries, readings captured at periodic roadworthiness inspection and telematics now covering 43% of the parc together turn a dashboard figure into something that can be checked against an independent record. Growth at 11.4% is the fastest in this market by a wide margin. Belgium and several other markets have demonstrated that recorded reading systems measurably reduce fraud rather than merely documenting it. Commercially the value has migrated from making the measurement to proving it, and the participants capturing that are not always the ones building instrumentation. Component suppliers hold none of the record assets involved.
Market Impact: Indian demand compounds at 10.6%

Market Opportunities and Growth Drivers

Leasing and insurance economics depend on trustworthy distance

Excess mileage charges on a lease and usage-based insurance pricing both rest entirely on a distance figure being accurate, and neither business can price risk against a number that costs forty dollars to change. Telematics-reported mileage removes the dependency by taking the reading from a server rather than a dashboard. Commercially this makes verification a requirement for two large financial businesses rather than a consumer nicety, which is exactly the kind of demand that persists through economic cycles because the underwriting simply does not work without it. Neither business can price against an unverifiable figure.
Market Impact: Tools cost around 40 dollars

Indian two-wheeler and vehicle production expands instrumentation volume

Indian growth at 10.6% leads every country in this market, driven by two-wheeler production at volumes no other country approaches alongside passenger vehicle output expanding under domestic manufacturing incentives. Two-wheeler instrumentation is transitioning from analogue to digital rapidly, which raises content value per unit considerably even where the vehicle itself remains inexpensive. Domestic suppliers including Pricol and Minda hold strong positions built on that volume, and export demand from other developing markets follows the same specification and price expectations. Export demand from other developing markets follows the same specification and price expectations.
Market Impact: Rollback adds 25% to price

Market Restraints and Challenges

Rollback tools are cheap and simple to use

Equipment capable of rewriting a stored distance value sells openly for around forty dollars and requires no specialist skill, because the same diagnostic access that allows legitimate cluster repair allows alteration. The root cause is that odometer values must be writable for any replacement cluster to be commissioned correctly at all. Commercially this means the measurement itself can never be made secure at the vehicle, only corroborated against external records. Suppliers are responding with mirrored values across multiple controllers and cryptographic signing, neither of which stops a determined operator. Corroboration against external records is the only defence.
Market Impact: Digital fitment reaches 88%

Verification stays voluntary where dealers prefer not to know

Mileage checking is optional in most markets, and the party best placed to run it is frequently the party with the least interest in the answer, since a falsified reading adds roughly 25% to an advertised price. The root cause is that the cost of fraud falls on the buyer while the benefit accrues to the seller. Commercially this caps voluntary adoption well below what the fraud rate would justify. Registry mandates and inspection-linked recording are the mechanisms that actually move penetration, and they arrive through policy rather than through demand.
Market Impact: Telematics covers 43% of parc
4 additional market trends, 3 additional growth drivers, and 2 additional restraints and challenges are covered in the full report. Contact sales@marketmindsadvisory.com to access the complete intelligence.

Segment CAGR and Growth Architecture

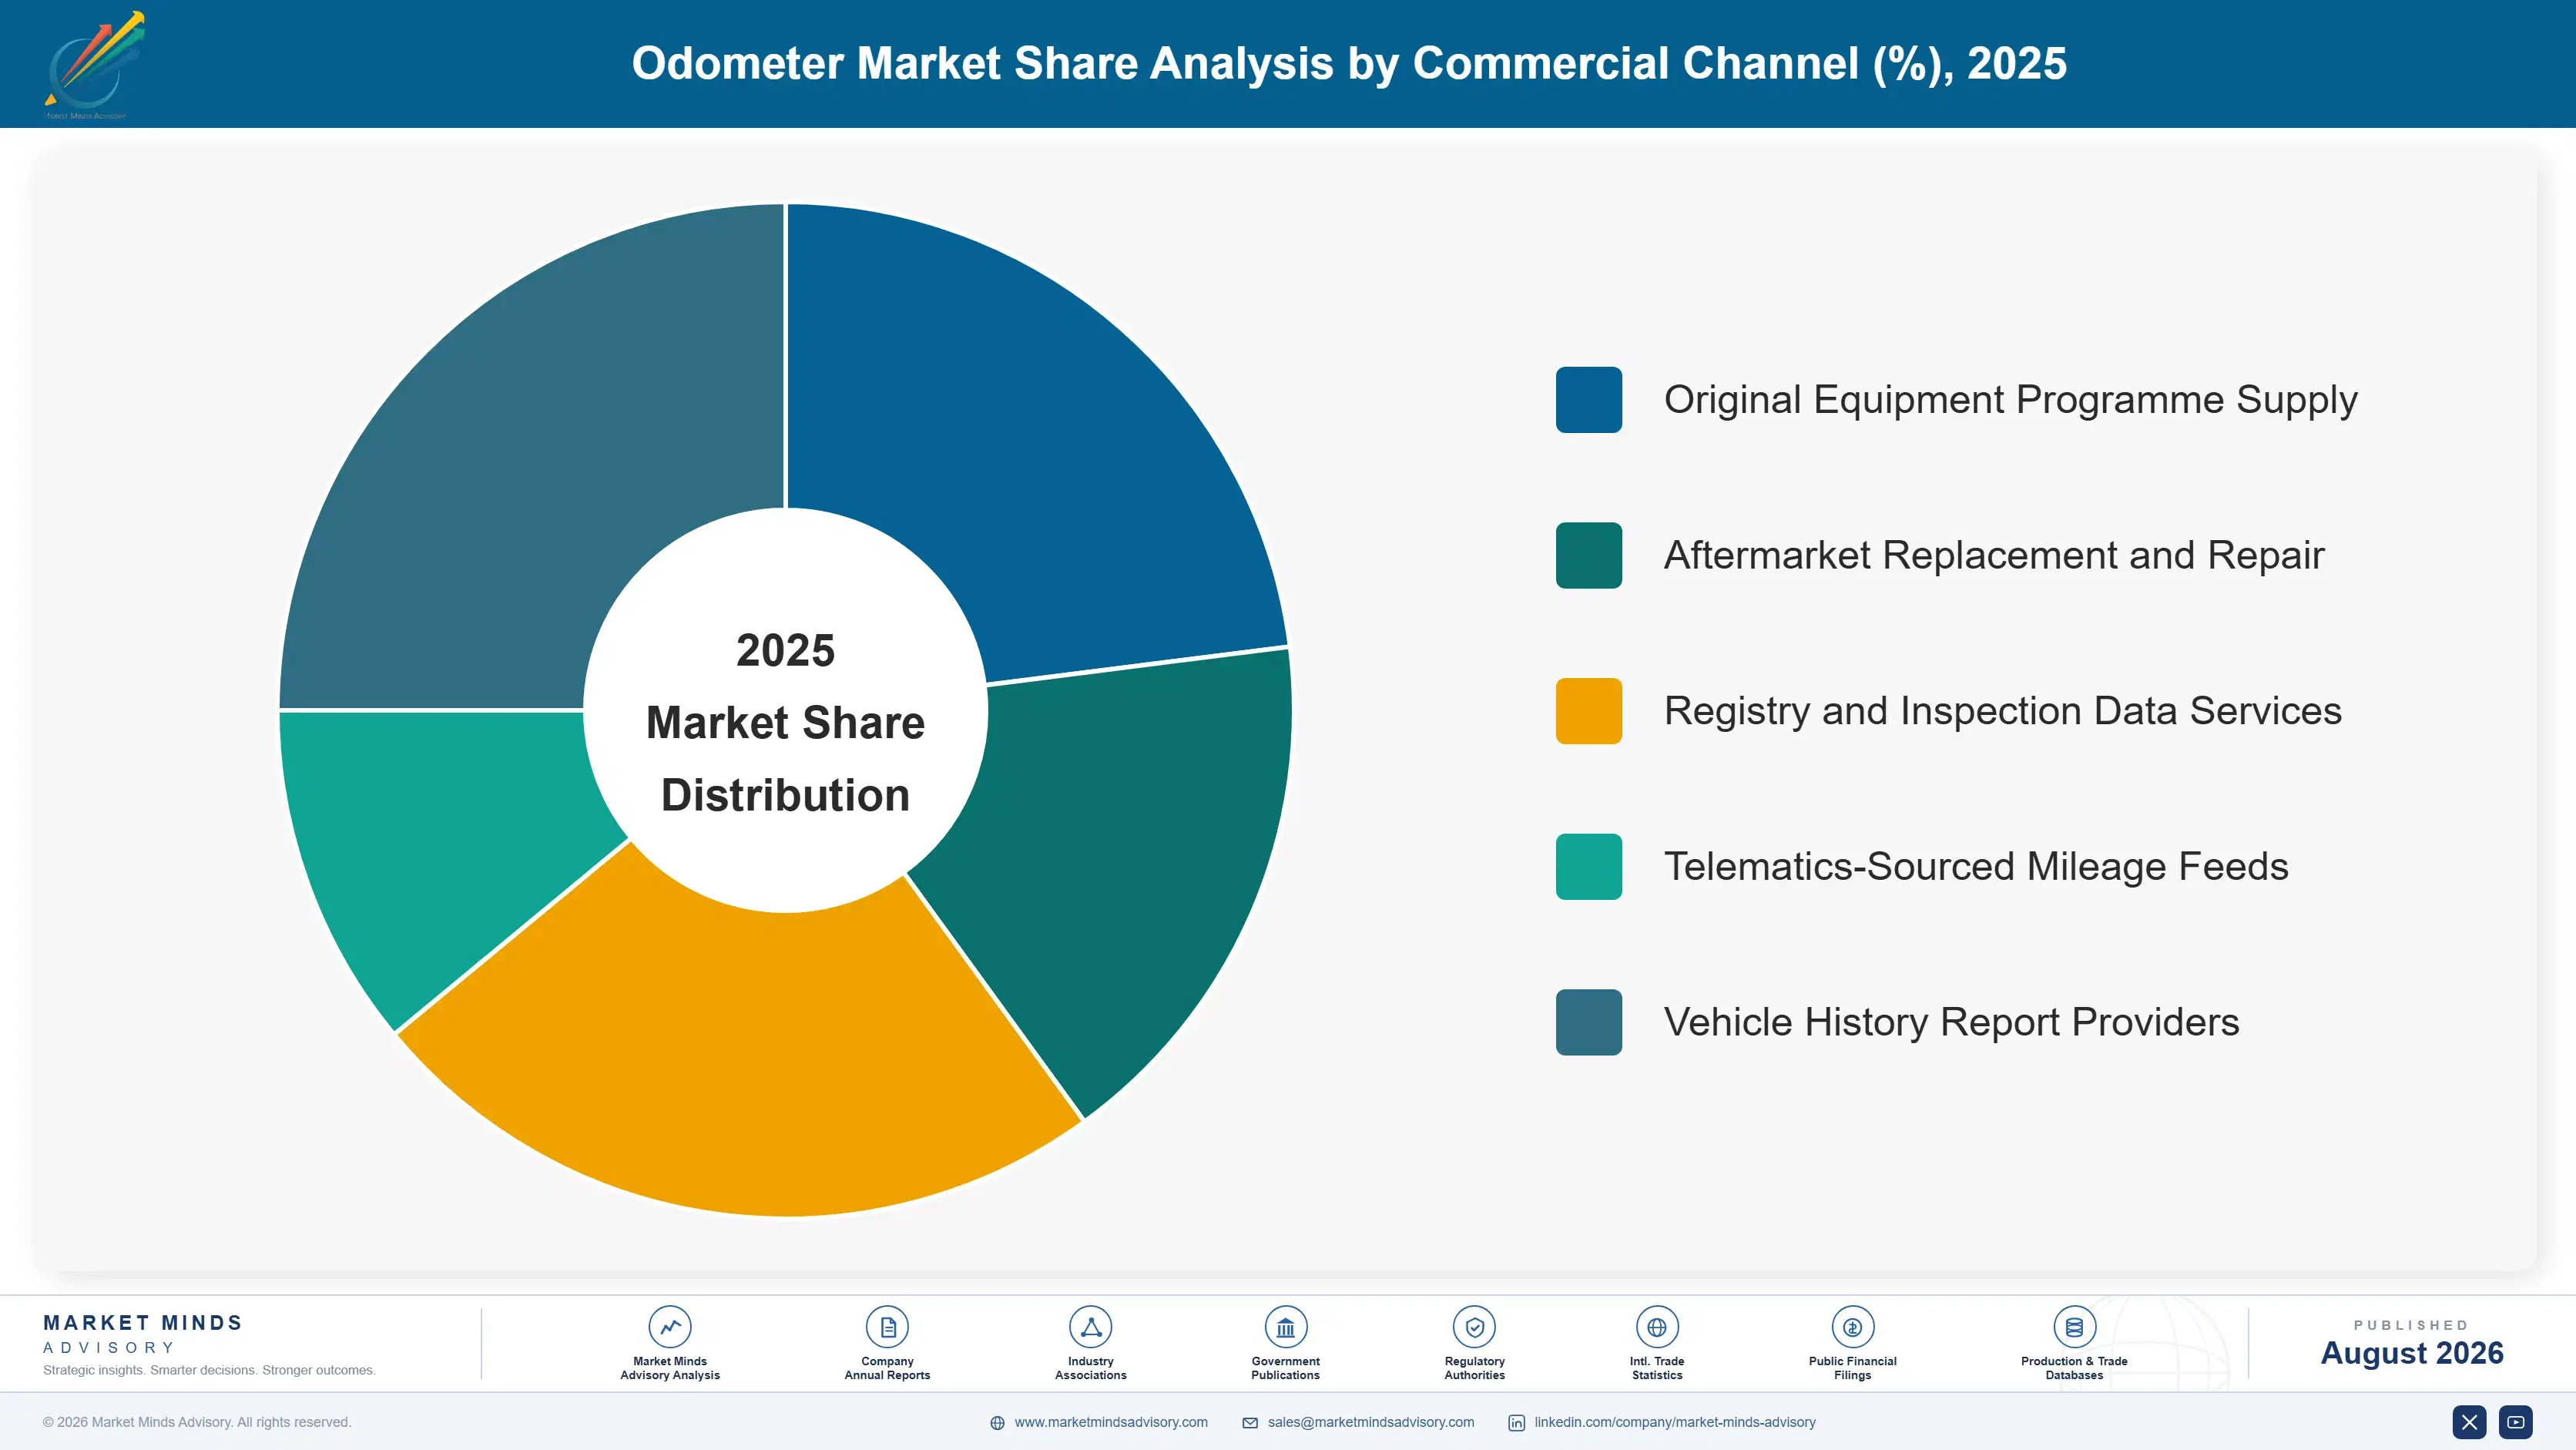
Value is classified here by product and service type, since instrumentation hardware and mileage verification behave as entirely different businesses with different customers, different buyers and different economics. Vehicle category, sales channel and technology approach are each handled separately in the framework below, because both hardware and services reach the same vehicles through different routes.
odometer-market-market-share-analysis-1787559378517

Mileage Verification and Data Integrity Services

Growing at 11.4%, half again the market rate and faster than anything else here, verification services exist because a forty dollar tool can alter a value that adds roughly a quarter to a vehicle's advertised price. National registries, readings captured at periodic roadworthiness inspection and telematics reporting across 43% of the parc together allow a dashboard figure to be checked against independent records rather than simply believed. Belgium and several other markets have shown recorded reading systems reduce fraud measurably. The customers are increasingly leasing companies and insurers whose underwriting genuinely does not function without a trustworthy distance figure, rather than consumers buying reassurance. That distinction matters commercially. A recurring underwriting contract is worth many single checks.
CAGR 11.4%

Commercial Vehicle Tachograph-Linked Systems

Commercial vehicles have always treated distance as a legal record rather than a dashboard convenience, because driving hours enforcement, road charging and operator licensing all depend on it being accurate and tamper-evident. Growth at 7.2% follows regulatory tightening around recording, tamper detection and remote reading rather than any increase in vehicle numbers. Smart tachograph requirements add positional recording and encrypted communication, which raises content value considerably per vehicle. Enforcement authorities rather than fleet operators effectively specify these systems, which makes the demand unusually insensitive to what an operator would prefer to buy. Smart tachograph requirements add positional recording and encrypted communication, raising content value well above voluntary specification. Enforcement authorities effectively write the specification here.
CAGR 7.2%
Full segment breakdown across 6 segments available in the complete report.

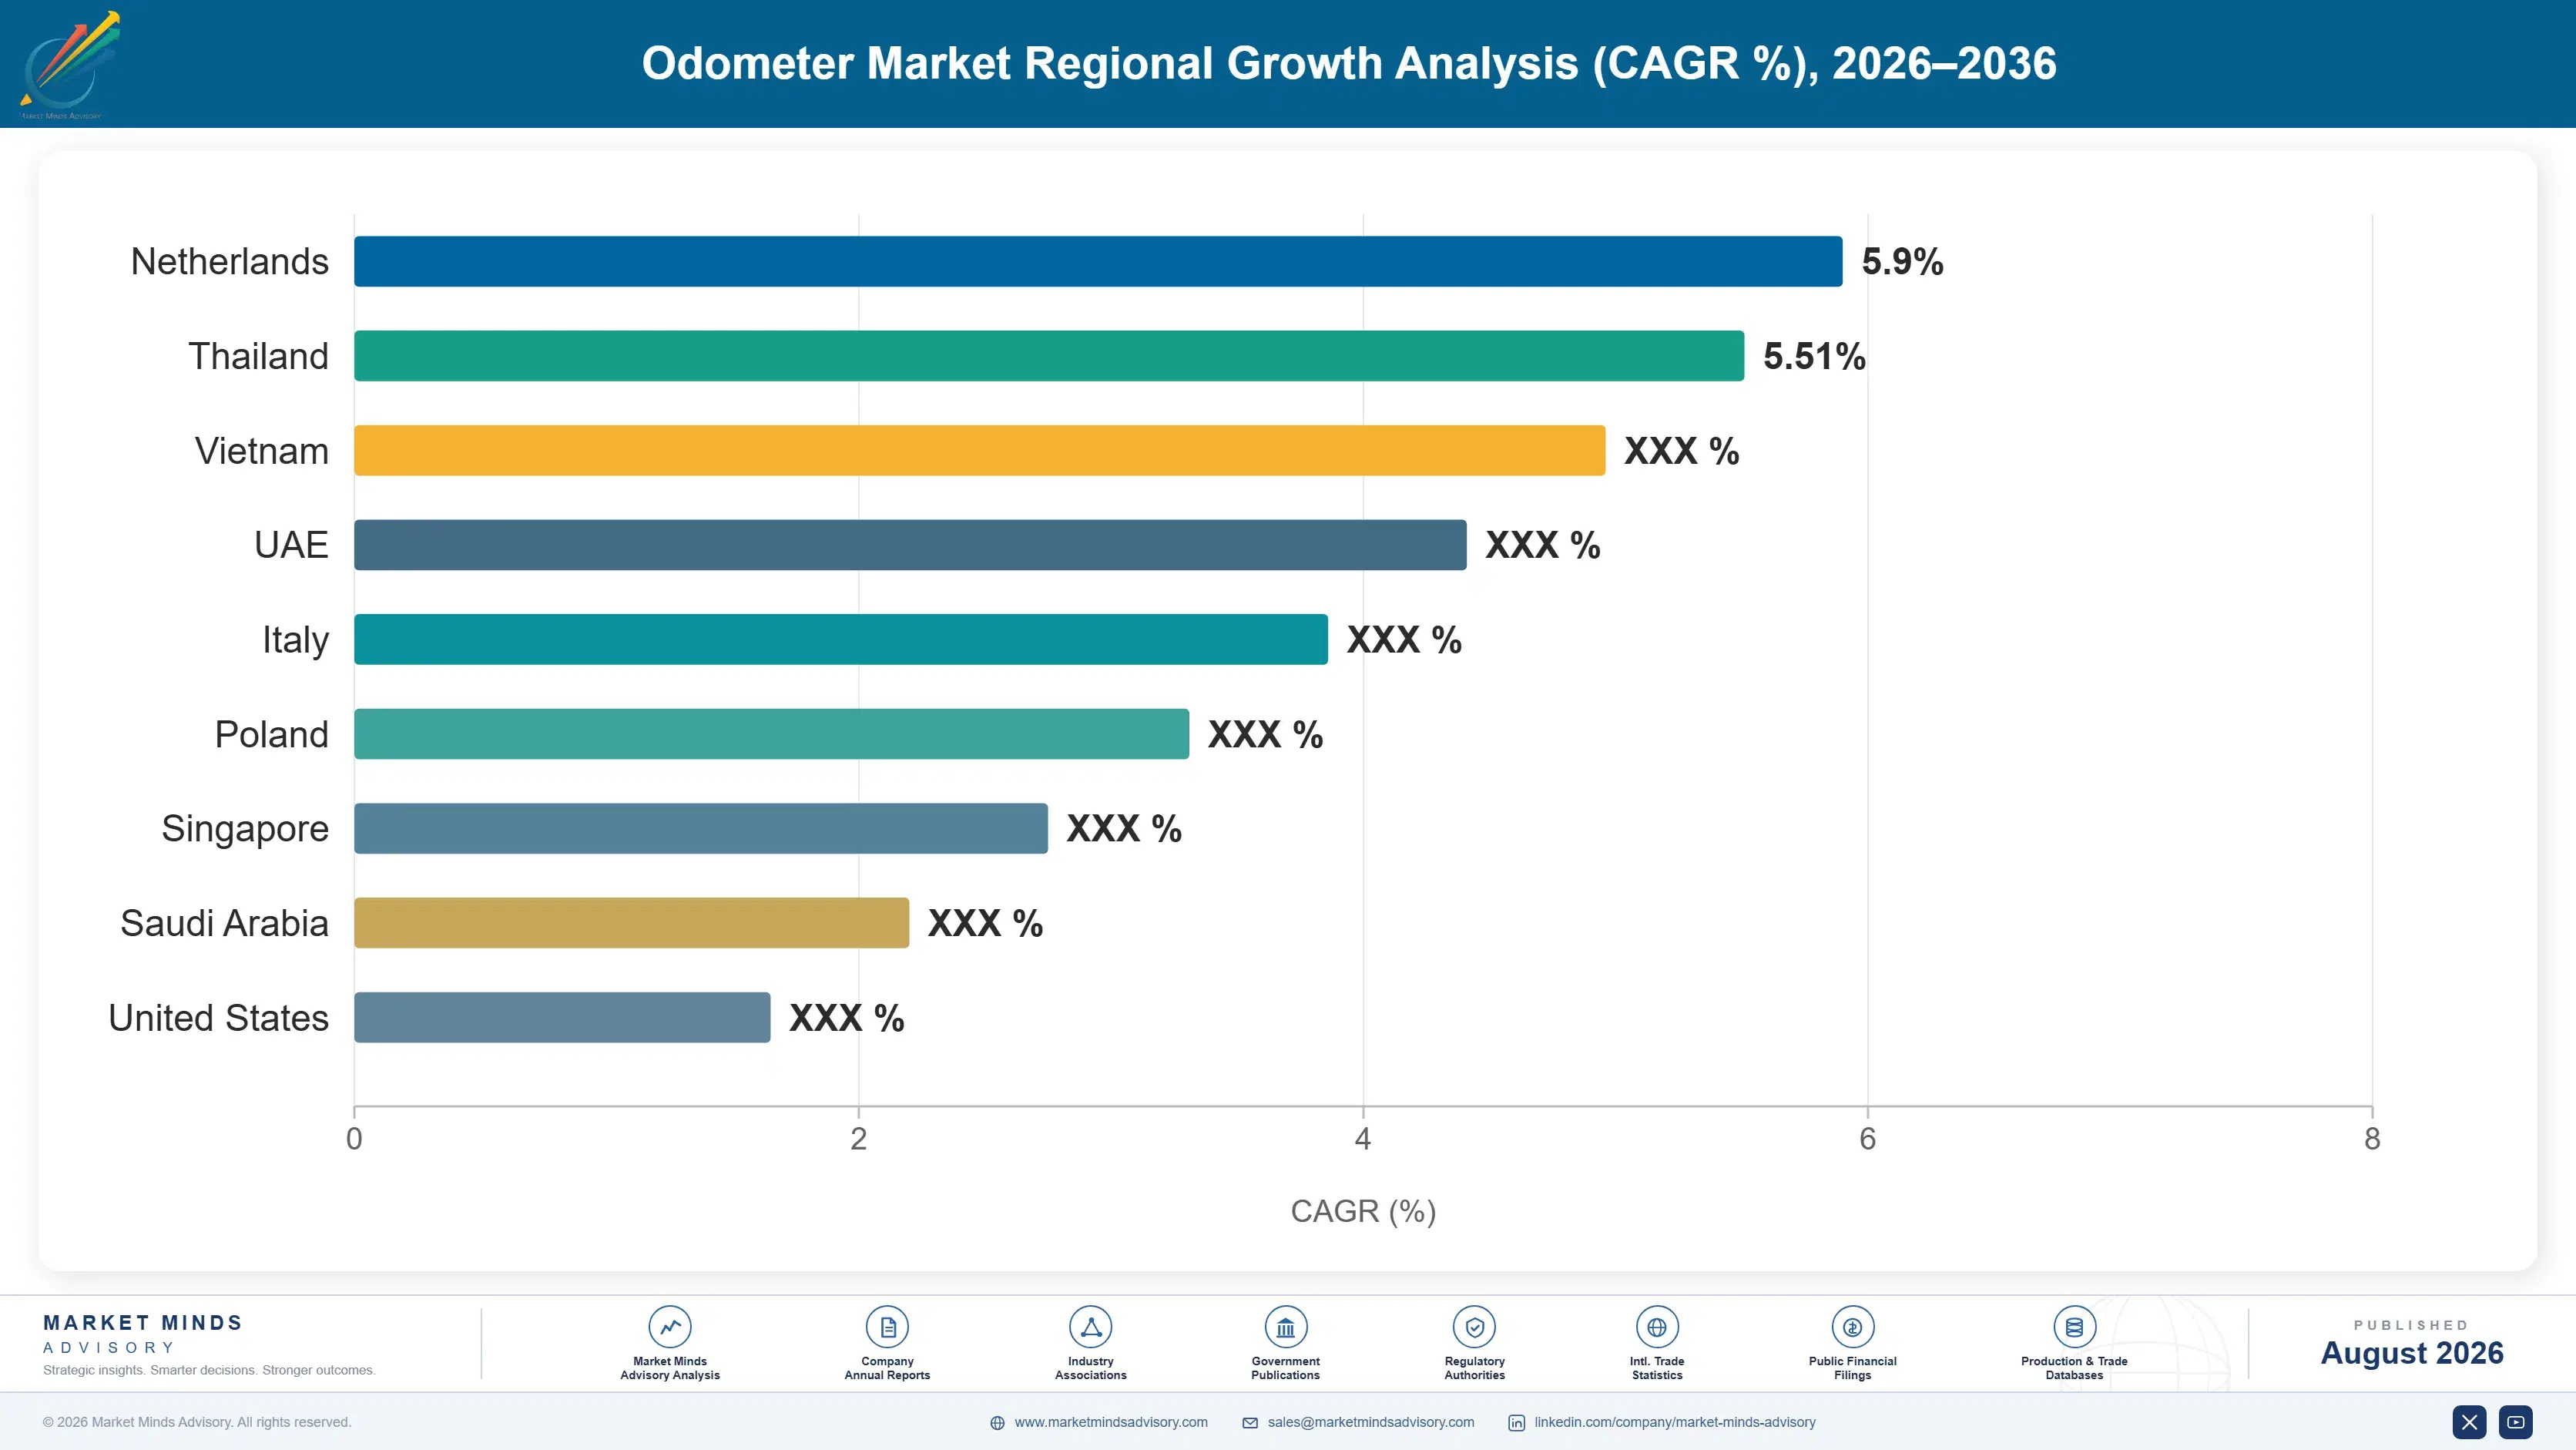
Regional Architecture and Country Demand Map

East Asia holds 36% of value, above the standard band, because vehicle and two-wheeler production both concentrate there at volumes no other region approaches. North America follows at 20% and Western Europe at 19%, with Europe holding influence far beyond its share through registry mandates.

East Asia

At 36% this region sits above the standard band, because Chinese, Japanese and Korean vehicle production together with substantial two-wheeler manufacture concentrate instrumentation demand here more than anywhere else. Chinese digital cluster fitment has risen faster than in any other market, driven by domestic manufacturers treating display content as a competitive feature rather than a cost line. Desay SV, Hangsheng and international suppliers compete hard on that volume. Mileage verification is considerably less developed as a service, since used vehicle markets in China are younger and registry infrastructure is still being built out. Growth at 8.6% reflects production and content value rising together. Two-wheeler instrumentation adds substantial volume. Verification remains commercially undeveloped.
Share: 36% | CAGR: 8.6% (2026 to 2036)

North America

At 20% this region sits below the standard band, reflecting vehicle production that is substantial but well below Asian volumes. Verification services are more commercially developed here than almost anywhere, through vehicle history providers whose mileage records draw on inspection, service and title data across decades. Leasing penetration is high, which makes accurate distance figures a financial requirement rather than a consumer preference. Digital cluster fitment is essentially complete across new production. Growth at 7.0% sits below the market rate and reflects content value rather than any volume expansion. Cross-border used vehicle flows with Mexico and Canada create verification demand that domestic record systems handle unevenly across jurisdictions. Digital fitment is complete.
Share: 20% | CAGR: 7.0% (2026 to 2036)
Regional intelligence for 5 additional markets available in the complete report: Western Europe, South Asia and Pacific, Latin America, Middle East and Africa, Eastern Europe. Contact sales@marketmindsadvisory.com.
odometer-market-country-cagr-analysis-1787559379032

Where Distance Data Earns Money

Four moves matter in a market where the product named in its own title no longer exists as a discrete component at all, and the value has relocated toward proving a number rather than producing it. Two concern the verification businesses now growing fastest, and two concern the instrumentation content that still genuinely earns something.

Sell verification to underwriters, not to consumers

Leasing excess mileage charges and usage-based insurance pricing both fail entirely if the distance figure is unreliable, which makes verification a requirement for two large financial businesses rather than reassurance a consumer might optionally buy. Growth at 11.4% concentrates there. A consumer check is a single low-value transaction, while an insurer or lessor needs continuous verified mileage across an entire book. Selling into underwriting converts an occasional purchase into a recurring data contract worth many times more per vehicle. Coverage depth rather than technology decides who wins those contracts. Underwriting demand persists through cycles.
Market Impact: Serves growth that is running at 11.4% yearly

Build coverage where cross-border trade concentrates fraud

Used vehicles moving between markets carry readings the receiving market frequently cannot check, and roughly 8% of used transactions already involve an altered figure with a rolled-back reading adding about 25% to advertised price. Cross-border flows into Eastern Europe, Africa and parts of the Gulf concentrate exactly that exposure. Verification coverage in origin markets is worth far more when it travels with the vehicle, and building record exchange into those corridors captures demand that domestic-only providers cannot serve at all. Domestic-only providers cannot serve that demand at all. Domestic-only providers cannot serve these corridors.
Market Impact: Addresses an 8% fraud rate on used sales

Capture tachograph content where authorities specify

Commercial vehicle recording grows at 7.2% because enforcement authorities rather than fleet operators effectively decide the specification, adding positional recording, tamper detection and encrypted remote reading that raise content value considerably per vehicle. Demand is therefore insensitive to what an operator would prefer to buy, which is unusual and valuable in a market where fleets normally optimise every component down to its cheapest acceptable version. Suppliers holding type approval across jurisdictions face a genuinely narrow competitive field. Type approval across jurisdictions is narrow and slow to obtain. The competitive field is correspondingly narrow.
Market Impact: Serves content that is growing at 7.2% annually

Follow two-wheeler digital conversion in volume markets

Two-wheeler instrumentation is converting from analogue to digital across Indian and Southeast Asian production, which raises content value per unit substantially even where the vehicle itself remains inexpensive, and Indian growth at 10.6% leads every country in this market. The volumes involved dwarf passenger vehicle production in those markets. Suppliers organised entirely around automotive cluster programmes routinely dismiss this as low value per unit and miss a content transition happening across tens of millions of vehicles annually. Aggregate content value across those volumes is substantial even at low unit prices, and almost nobody organised around passenger programmes has modelled it.
Market Impact: Follows demand that is growing at 10.6% yearly

Who Controls the Margin Pool

Five suppliers hold 46% of this market, measured on instrumentation and mileage service revenue at supplier level, the basis used throughout this section. That concentration reflects instrument cluster supply rather than anything specific to distance recording, since odometry is a function inside a cluster rather than a product. The verification side is populated by entirely different participants who build no hardware at all. Hardware and verification barely overlap as businesses.
Competition runs on four dimensions. Cluster electronics and display capability, which is what instrumentation buyers are actually purchasing when they specify a programme. Type approval breadth for tachograph systems across enforcement jurisdictions, which is narrow and slow to obtain. Data coverage and record access for verification services. And cost position in two-wheeler instrumentation, where volumes are enormous and unit values correspondingly small.

Rankings shift toward participants holding verification data assets rather than instrumentation content, and toward Indian and Chinese suppliers driving two-wheeler conversion. European suppliers hold tachograph approvals alongside registry relationships built over years. Vehicle history providers hold record depth that no component supplier has ever seriously attempted to build for itself. Two businesses sit inside one market name.
odometer-market-company-positioning-matrix-1787559379548

Competitive Moat and Risk Dimensions

CONTINENTAL

Moat: Cluster electronics and approvals

The company supplies instrument cluster electronics across a broad range of vehicle programmes and holds tachograph type approvals across European enforcement jurisdictions, which is a genuinely narrow qualification that takes years to obtain. Commercial vehicle recording content is specified by authorities rather than by fleets, which makes that position considerably more defensible than ordinary component supply.
CONTINENTAL

Risk: No verification data position

Verification and data integrity services grow at 11.4%, faster than anything in instrumentation, and the participants capturing that value hold record access rather than hardware capability. A cluster supplier has no natural route into a business built on inspection records, registries and telematics history. Vehicle history providers built those assets over decades and are not selling them.
NIPPON SEIKI

Moat: Two-wheeler instrumentation depth

The company holds a deep position in two-wheeler and small vehicle instrumentation, which is where unit volumes are largest and where analogue to digital conversion is raising content value fastest across Indian and Southeast Asian production. That segment is routinely dismissed by suppliers organised around passenger vehicle cluster programmes, which leaves the competitive field considerably less crowded.
NIPPON SEIKI

Risk: Low unit value volume exposure

Two-wheeler instrumentation carries small content value per unit and intense price competition from Indian and Chinese suppliers operating on domestic cost bases. Content conversion raises the value but not the margin structure. Participants with verification data assets or tachograph approvals earn considerably more per vehicle from businesses that price competition does not reach in the same way.

Players Tracked

Prominent Players

Continental
Robert Bosch
DENSO
Visteon
Nippon Seiki

Other Key Players

Marelli
Valeo
Yazaki
Aptiv
LG Electronics
Panasonic Automotive Systems
Pricol
Minda Corporation
Stoneridge
Hyundai Mobis
Desay SV Automotive
Shenzhen Hangsheng Electronics
Carfax
carVertical
Actia Group

Recent Developments

JANUARY 2025

A leasing group required telematics-verified mileage on new contracts

A European vehicle leasing group made telematics-reported mileage a contractual requirement for excess distance charging across new agreements, replacing reliance on dashboard readings at contract end. This was an underwriting policy decision rather than any commercial transaction between instrumentation suppliers. Dashboard readings became advisory only.
Signal: Financial businesses are converting verification from an optional check into a contractual requirement they price against
MAY 2025

A market extended odometer record exchange to imported vehicles

A European market extended its national odometer record system to capture readings on vehicles imported second hand from other member states, addressing fraud concentrated in cross-border used vehicle trade. Imported readings are now checked at registration. This was a regulatory extension rather than any commercial transaction.
Signal: Cross-border corridors concentrate mileage fraud, and record exchange is the only mechanism that has measurably reduced it
SEPTEMBER 2025

A two-wheeler manufacturer standardised digital instrumentation across its range

An Indian two-wheeler manufacturer standardised digital instrument clusters across its volume model range, replacing analogue units and adding connectivity features at price points previously considered incompatible with digital instrumentation. This was a product decision rather than any supplier transaction. Analogue units were withdrawn entirely from the range.
Signal: Two-wheeler content conversion is happening across tens of millions of units annually and is widely overlooked

What Drives Supplier Economics

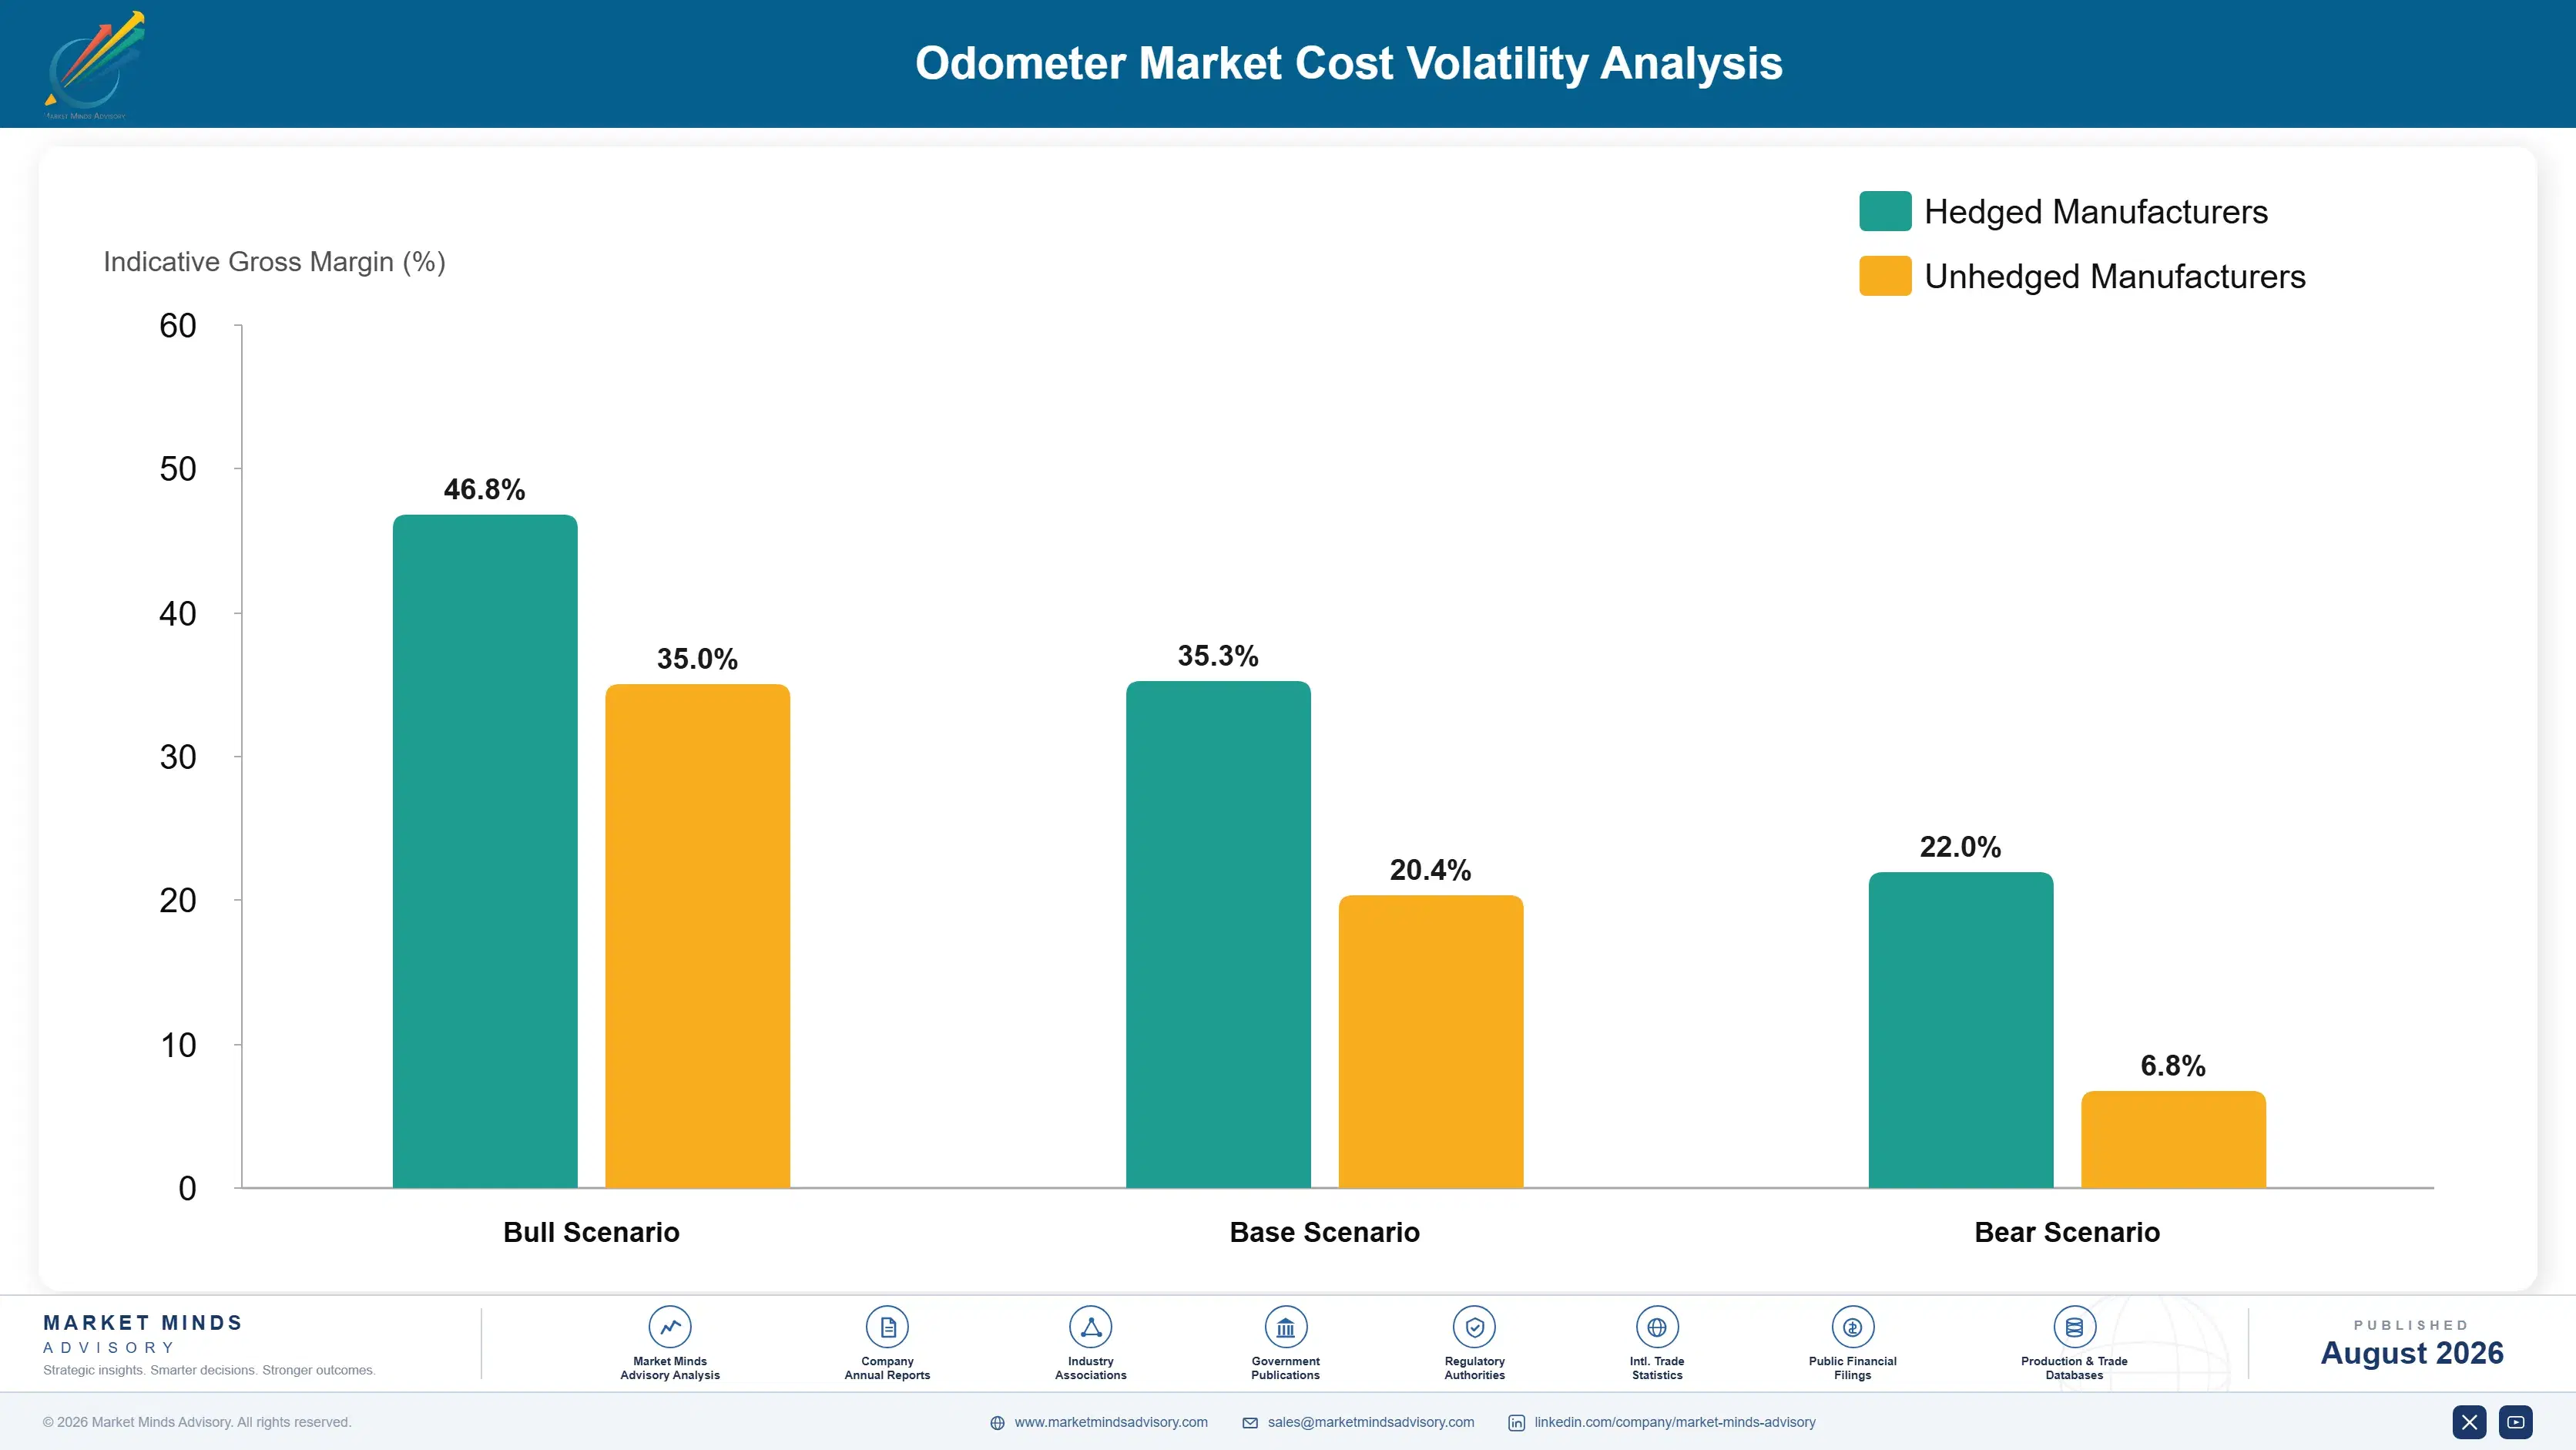
Displays, microcontrollers and memory account for roughly 58% of instrumentation hardware cost, and all three follow semiconductor and display markets rather than vehicle demand. Housing, connectors and assembly add around 21%. Software and validation take about 12% and rise sharply where type approval is required. Verification services carry an entirely different structure, dominated by data acquisition and platform cost.
Semiconductor availability rather than price dominated cost through 2021 and 2022, with microcontroller lead times extending far beyond normal and forcing suppliers into spot purchasing at multiples of contract price. Continental noted semiconductor supply and cost pressure across its automotive operations in its Annual Report 2022. Suppliers on fixed programme pricing absorbed most of it, and several renegotiated with vehicle manufacturers who had no alternative source available.

The disadvantage falls on hardware-only suppliers, and it operates through where value is growing rather than through any cost gap. Instrumentation content grows with display size and feature count, which is real but slow, while verification services grow at 11.4% on data assets that no component supplier holds. A supplier competing purely on cluster cost is competing well in the part of this market that is expanding least.
odometer-market-cost-volatility-analysis-1787559379742

Secure display and microcontroller supply on multi-year terms

Semiconductors and displays at roughly 58% of hardware cost proved to be an availability problem rather than a price problem, and availability is what stops a production line. Multi-year allocation agreements cost a modest premium over spot in normal conditions and preserve programme delivery when conditions are not normal. Vehicle manufacturers remember which suppliers delivered.

Build or acquire data access rather than only instrumentation content

Verification services grow at 11.4% while instrumentation content grows with display size and feature count alone. Record access through inspection data, registries and telematics is what those services are actually built on, and a component supplier holds none of it. Partnership or acquisition is faster than attempting to assemble decades of records from nothing.

Amortise type approval across multiple jurisdictions deliberately

Tachograph software and validation cost rises sharply where enforcement approval is required, and a single jurisdiction rarely justifies it alone. Designing for multi-jurisdiction approval from the outset spreads that cost across far more volume. Suppliers approaching each market separately carry validation expense that better-planned competitors recover several times over. Planning approval breadth early costs almost nothing.

Portfolio Architecture for Margin Defence

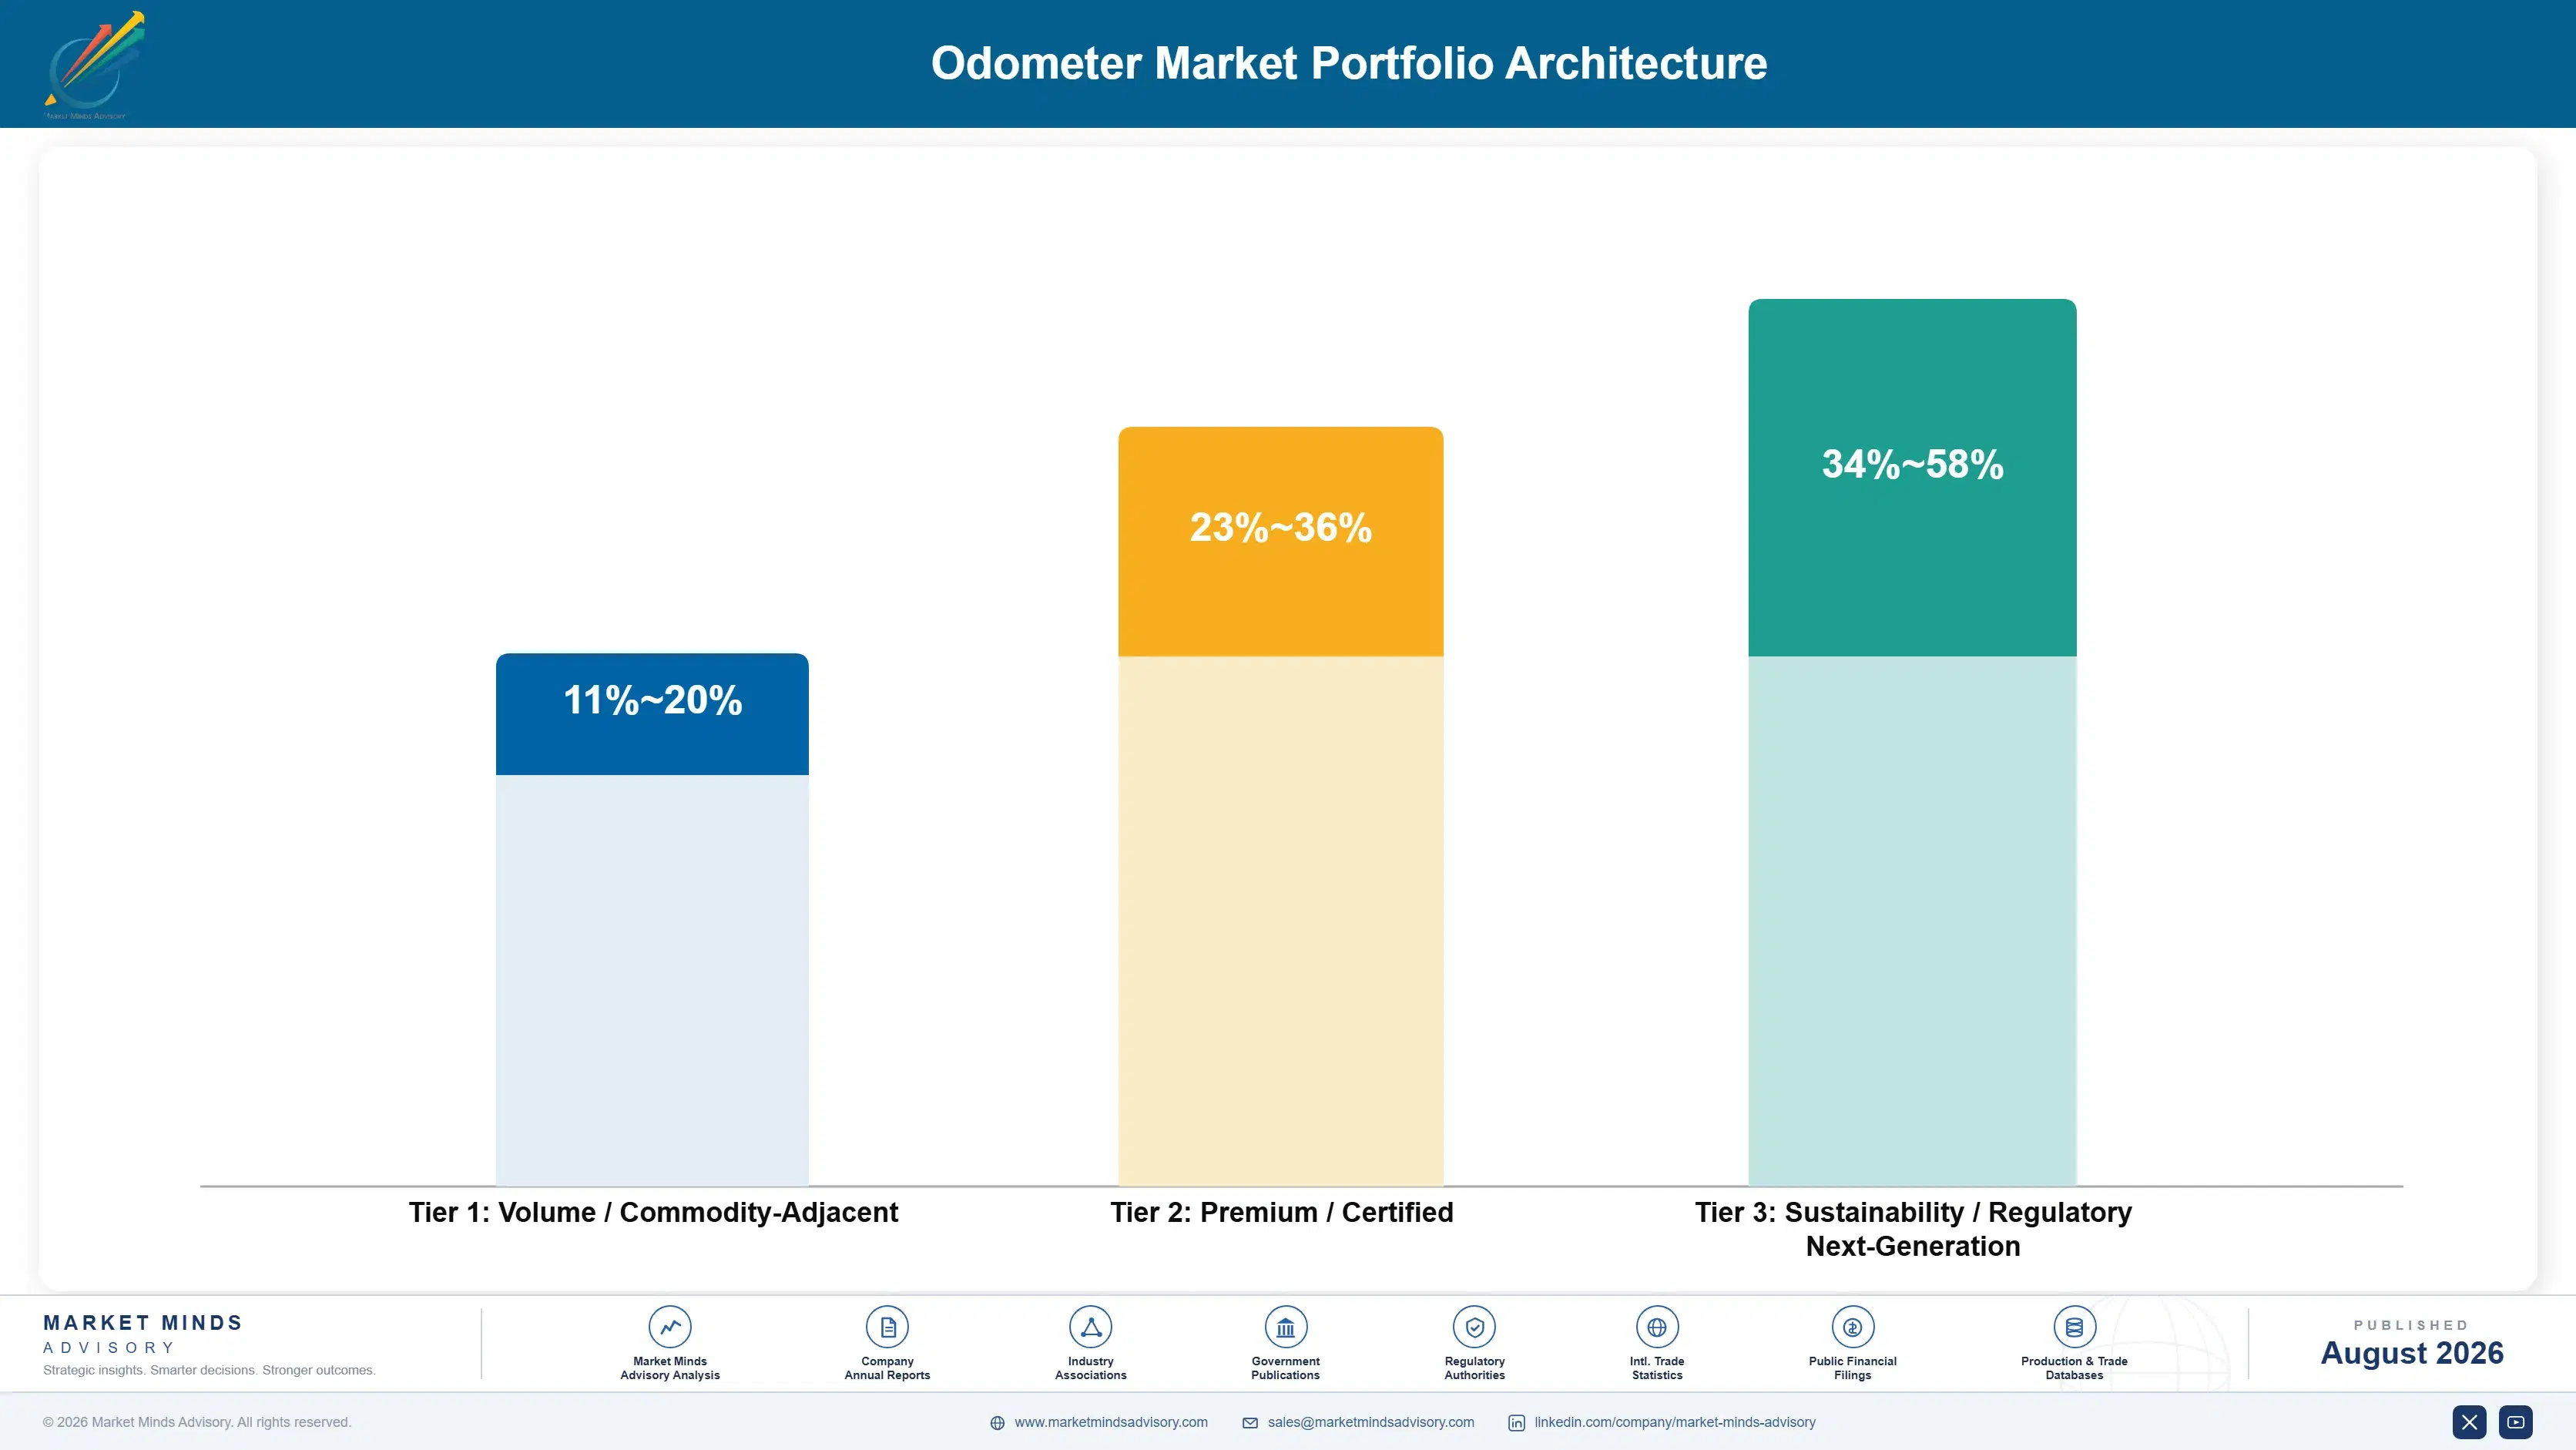
Margin separates on data assets and approvals rather than on instrumentation capability, which is not where a components business expects to end up. Two-wheeler and entry instrumentation runs at gross margins in the low teens against Indian and Chinese suppliers on domestic cost bases. Passenger vehicle cluster content runs modestly better on display and software content. Tachograph systems run considerably higher on type approval scarcity. Verification and data integrity services run highest of all, because the asset is a record nobody else can assemble quickly.
The tension is that instrumentation volume fills the factories while verification earns the returns, and there is no path from one to the other through engineering investment. A cluster supplier cannot build decades of inspection and title records by deciding to. Partnership or acquisition is the realistic route, and several suppliers have concluded the businesses are too different to combine, which is defensible and leaves the fastest growth to somebody else entirely.

High-value pools sit in verification data, tachograph approvals and two-wheeler content conversion. Passenger cluster hardware is where display and semiconductor cost decide everything and instrumentation expertise earns very little.

Volume / Commodity-Adjacent

Two-wheeler, entry vehicle and basic cluster instrumentation competing on delivered cost against Indian and Chinese suppliers. The nine-point range separates suppliers with semiconductor purchasing scale from those buying displays and controllers at prevailing terms.
Gross Margin: 11%-20%

Premium / Certified

Passenger vehicle cluster content with display, software and connectivity features specified into vehicle programmes. The thirteen-point spread reflects software and integration capability rather than any advantage in the underlying instrumentation itself.
Gross Margin: 23%-36%

Sustainability / Regulatory / Next-Generation

Tachograph systems carrying enforcement type approval and verification services built on record access. The twenty-four-point range is wide because approval breadth and data coverage depth vary enormously between participants and jurisdictions.
Gross Margin: 34%-58%
odometer-market-portfolio-architecture-1787559380243

High-value Sub-segments and Strategic Watch-out

Verification Data Services

Compounding at 11.4% on record assets that component suppliers do not hold and cannot build quickly. Leasing and insurance underwriting needs continuous verified mileage, which is a recurring contract rather than a single check. Partnership beats attempting to build it. Coverage depth alone decides who wins contracts.
Gross Margin: 38%-58%

Tachograph Approved Systems

Growing at 7.2% with enforcement authorities rather than fleets specifying content, which makes demand insensitive to operator preference. Type approval across jurisdictions is narrow and takes years to obtain properly. Operator preference does not enter the specification decision at all. Approvals take years to obtain.
Gross Margin: 34%-48%

Passenger Cluster Content

The programme volume, where display size and feature count drive value while semiconductor and display cost drive margin. Software and integration capability rather than instrumentation expertise separates suppliers here. Semiconductor and display purchasing scale decides the margin outcome. Display size drives the content value here.
Gross Margin: 23%-36%

Two-Wheeler Digital Conversion

Analogue to digital conversion across tens of millions of units annually, raising content value where passenger-focused suppliers are not competing. Unit values stay low and Indian and Chinese cost bases set pricing. Passenger-focused suppliers dismiss it on unit value and miss the aggregate. Aggregate value is substantial.
Gross Margin: 13%-24%

How Distance Demand Renews

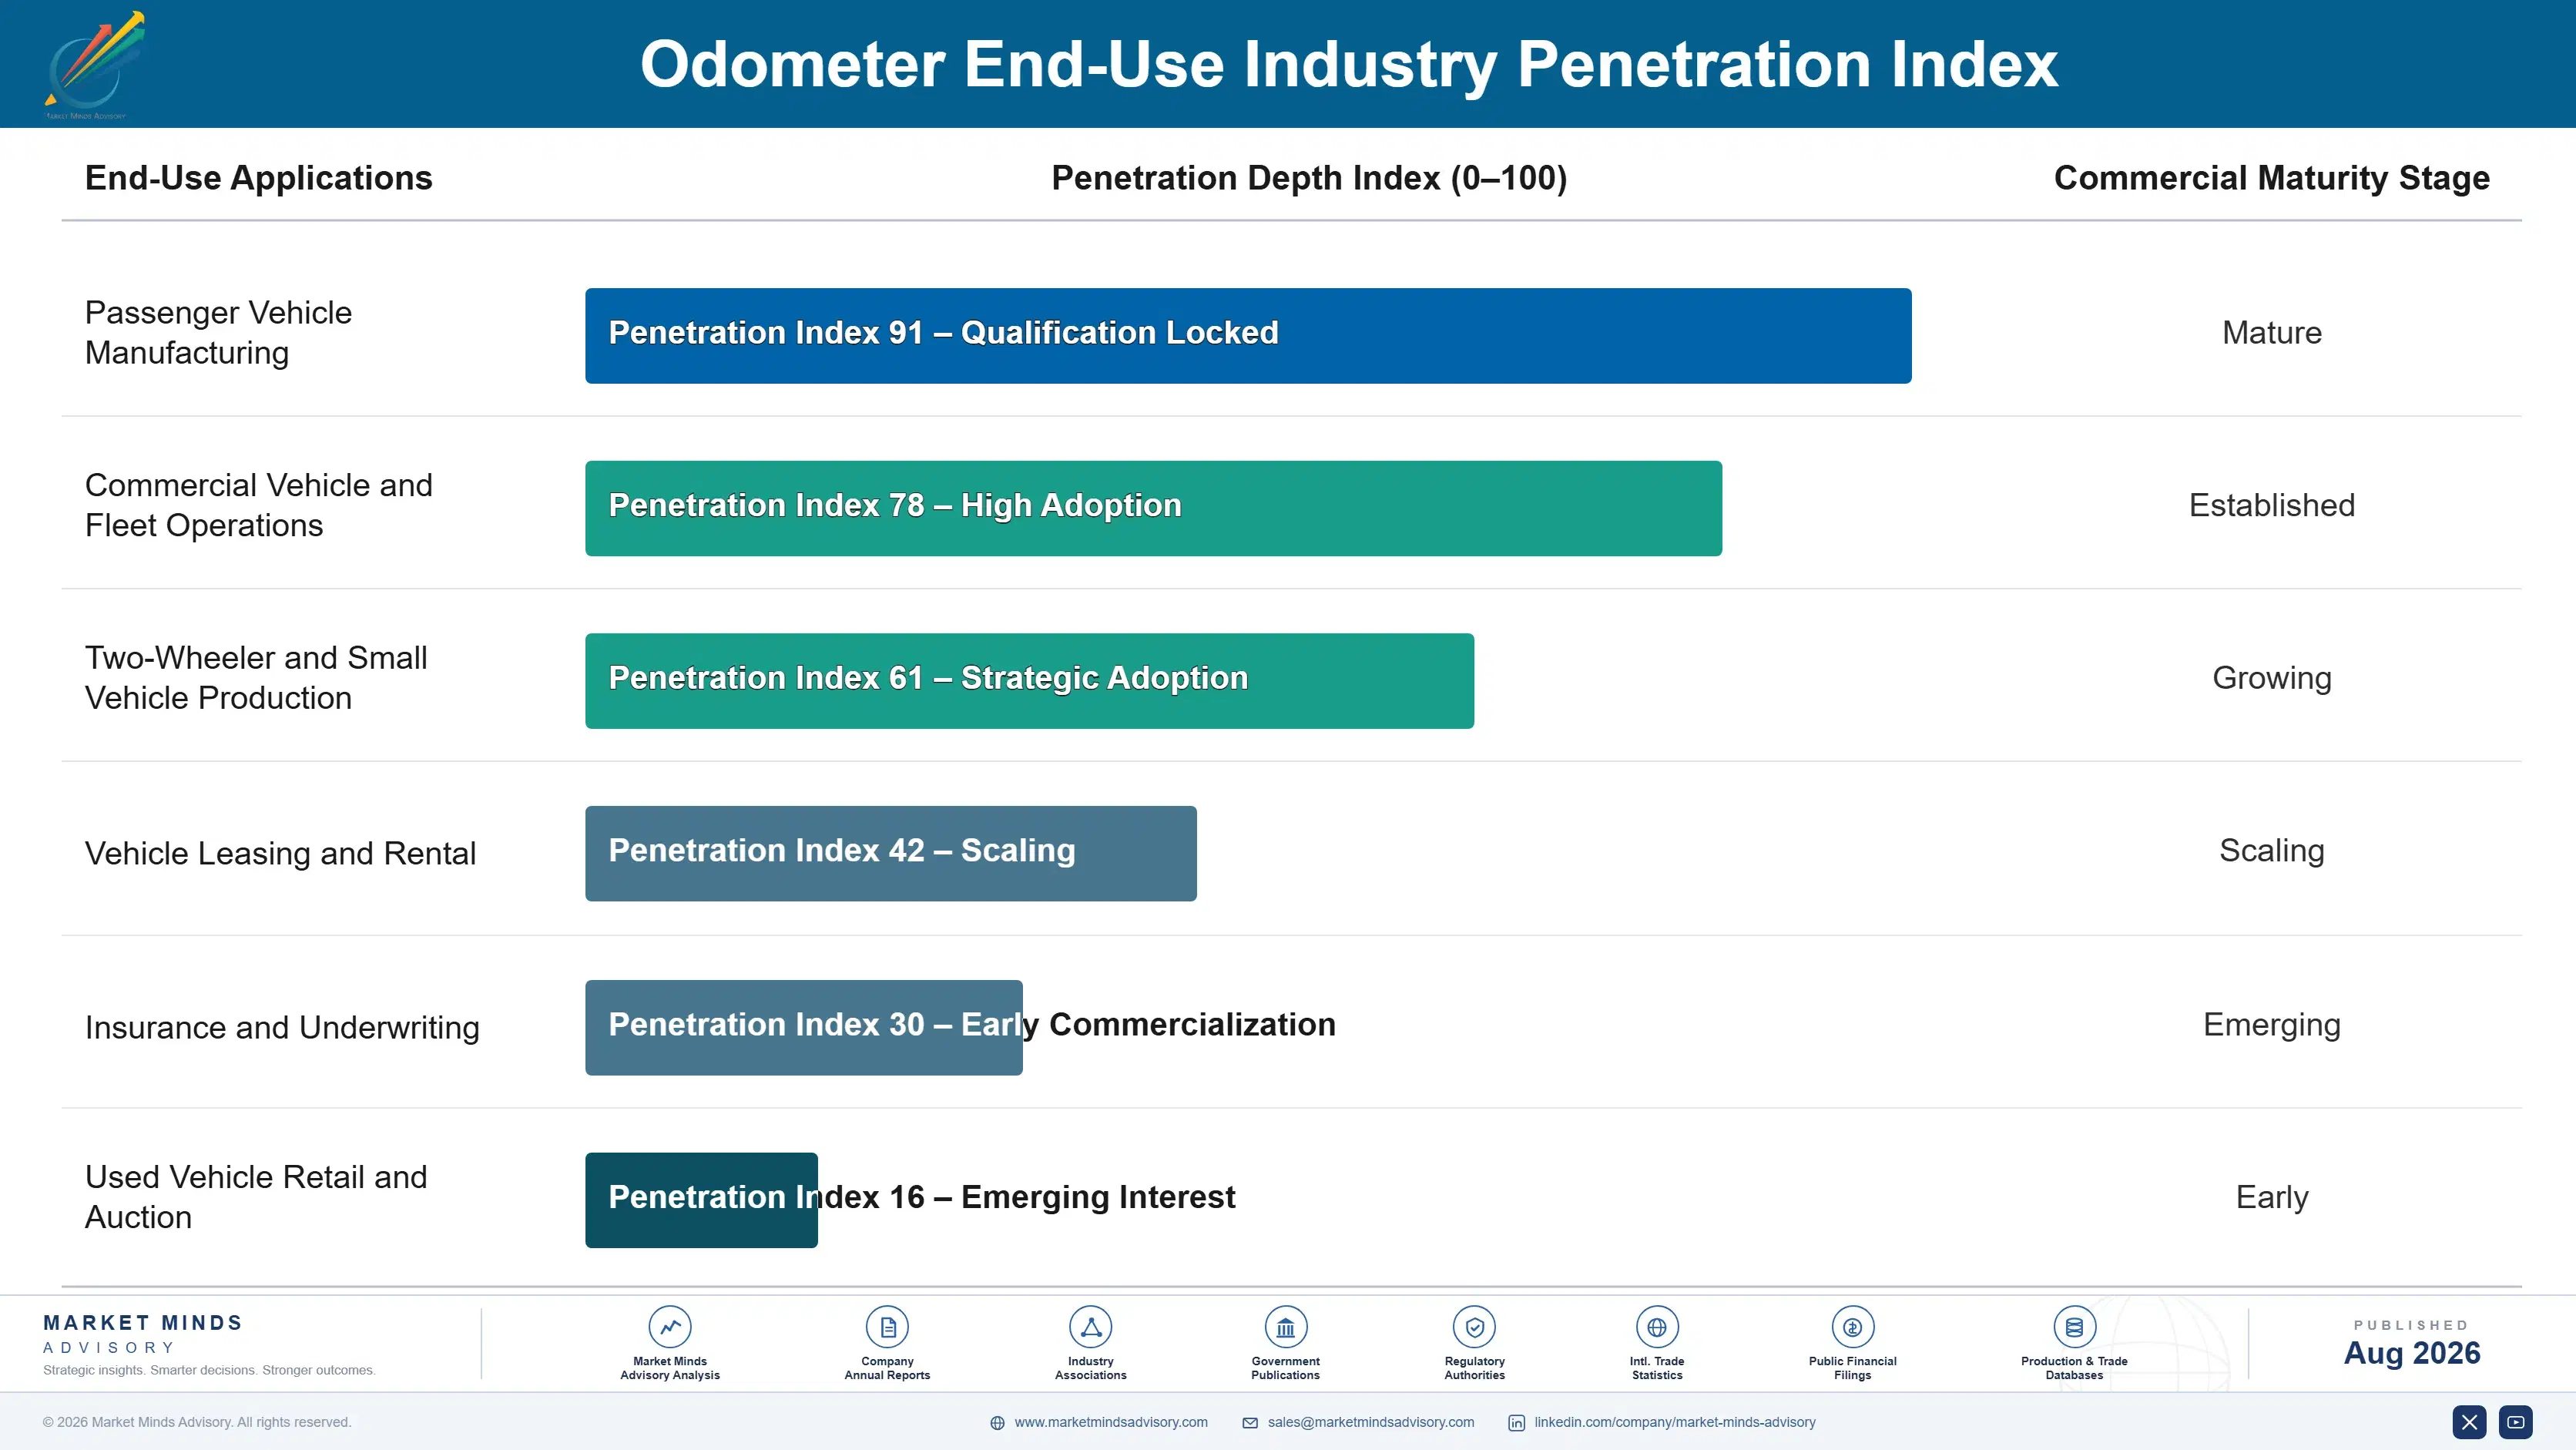
Hardware demand renews with vehicle production and follows somebody else's build schedule entirely, which makes it an annuity attached to a platform rather than a business with its own cycle. A cluster qualified into a vehicle programme ships at every build for six or seven years with no purchasing decision in between. Verification demand renews on an entirely different clock, tied to used vehicle transactions, lease terminations and insurance renewals, none of which depend on new vehicle output at all.
Stickiness varies sharply between the two. A cluster programme cannot change supplier mid-cycle without revalidation nobody will fund, which makes those positions durable and their loss permanent for a platform generation. Tachograph systems are similarly locked by type approval. Verification contracts with lessors and insurers renew annually and switch on coverage quality and price, which makes them less durable but considerably more numerous.

The buyer has split into two groups that share nothing. Instrumentation is bought by vehicle manufacturer engineering and purchasing teams on content specification and cost per unit. Verification is bought by underwriters, risk functions and used vehicle platforms who have never spoken to a component supplier and evaluate coverage depth rather than any technical specification at all.
odometer-market-end-use-penetration-index-1787559380727

Where To Place The Bet

These are among the four positions where our research anticipates prominent divergence between winners and laggards over the coming forecast period. Each is grounded in the demand model, the regulatory perimeter, and the announced capacity pipeline.
01 / UNDERWRITER CHANNEL FOCUS

Sell verified distance to the people pricing risk

Leasing excess mileage charges and usage-based insurance premiums both collapse entirely if the distance figure cannot be trusted, which makes verification a requirement for two substantial financial businesses rather than reassurance an individual consumer might optionally purchase before buying a car. A consumer check is a single low-value transaction completed once. An insurer or lessor requires continuously verified mileage across an entire book of vehicles, which converts an occasional purchase into a recurring data contract worth many multiples per vehicle.
02 / CROSS-BORDER RECORD COVERAGE

Follow the vehicles that cross a border

Used vehicles moving between markets arrive carrying readings the receiving market frequently has no means of checking, and roughly 8% of used transactions already involve an altered figure while a rolled-back reading adds about 25% to the advertised price. Trade corridors into Eastern Europe, Africa and parts of the Gulf concentrate that exposure very heavily indeed. Verification coverage in origin markets becomes far more valuable when the record travels with the vehicle, and record exchange captures demand domestic-only providers cannot serve.
03 / ENFORCEMENT SPECIFIED CONTENT

Win where the authority writes the specification

Commercial vehicle recording content grows at 7.2% because enforcement authorities rather than fleet operators effectively determine what must be fitted to every vehicle. Positional recording, tamper detection and encrypted remote reading all raise content value considerably above anything an operator would have specified voluntarily. Demand is therefore insensitive to fleet purchasing preference, which is unusual and genuinely valuable in a market where operators otherwise optimise every single component down to its cheapest acceptable version available from anybody willing to supply it.
04 / TWO-WHEELER CONTENT TRANSITION

Do not dismiss the highest volume conversion happening

Two-wheeler instrumentation is converting from analogue to digital across Indian and Southeast Asian production, raising content value per unit substantially even where the vehicle itself remains inexpensive, and Indian country growth at 10.6% leads every country in this entire market. The unit volumes involved dwarf passenger vehicle production across those same markets by a wide margin. Suppliers organised around automotive cluster programmes routinely dismiss the segment on unit value and miss a content transition happening across tens of millions of vehicles every single year.

Engagement Snapshot From the Field

A live engagement with an industry participant carrying material or product regulatory and market exposure ahead of a defining policy shift, showing how our research translates into a defensible multi-year portfolio strategy.
MARKET MINDS ADVISORY · CLIENT ENGAGEMENT SUMMARY
Odometer Producer Strategic Portfolio Review and Transition Roadmap 2026·Investment Scenario on Odometer Exposure Evaluation 2025-26
CLIENT PROFILE
A European vehicle instrumentation supplier with annual revenue around EUR 340 million (client-reported, unverified by MMA), supplying instrument clusters to passenger and commercial vehicle manufacturers across Europe. Tachograph type approval existed in two jurisdictions only. No verification or data services position existed anywhere in the business. Cluster revenue growth had been slow. Verification capability was absent.
STRATEGIC CHALLENGE
Cluster content revenue was growing slowly while management observed verification businesses expanding rapidly around them, and a proposal existed to build a mileage verification platform internally. Nobody had established what those businesses actually sell or whether a component supplier could assemble the underlying asset at all. Neither question had been tested.
MMA APPROACH
MMA decomposed verification provider revenue by customer type to establish who actually pays and for what, rather than assuming a consumer-facing model. Record asset requirements were assessed against what the client could realistically build or acquire. Tachograph approval economics were modelled across additional jurisdictions using existing validation work. Partnership options were assessed alongside.
KEY FINDINGS
  1. Verification revenue came overwhelmingly from lessors and insurers on recurring contracts rather than from consumers buying single checks, which the internal proposal had assumed was the model.
  2. The underlying asset is decades of inspection, service and title records, and no amount of engineering investment would allow the client to assemble an equivalent within any relevant timeframe.
  3. Extending tachograph type approval to four further jurisdictions required modest incremental validation against work already completed, opening enforcement-specified content at high margin.
  4. Two-wheeler instrumentation conversion in export markets was being served by Asian suppliers alone, at volumes the client had dismissed on unit value without ever modelling the aggregate.
CLIENT PROFILE
A European vehicle instrumentation supplier with annual revenue around EUR 340 million (client-reported, unverified by MMA), supplying instrument clusters to passenger and commercial vehicle manufacturers across Europe. Tachograph type approval existed in two jurisdictions only. No verification or data services position existed anywhere in the business. Cluster revenue growth had been slow. Verification capability was absent.
STRATEGIC CHALLENGE
Cluster content revenue was growing slowly while management observed verification businesses expanding rapidly around them, and a proposal existed to build a mileage verification platform internally. Nobody had established what those businesses actually sell or whether a component supplier could assemble the underlying asset at all. Neither question had been tested.
MMA APPROACH
MMA decomposed verification provider revenue by customer type to establish who actually pays and for what, rather than assuming a consumer-facing model. Record asset requirements were assessed against what the client could realistically build or acquire. Tachograph approval economics were modelled across additional jurisdictions using existing validation work. Partnership options were assessed alongside.
KEY FINDINGS
  1. Verification revenue came overwhelmingly from lessors and insurers on recurring contracts rather than from consumers buying single checks, which the internal proposal had assumed was the model.
  2. The underlying asset is decades of inspection, service and title records, and no amount of engineering investment would allow the client to assemble an equivalent within any relevant timeframe.
  3. Extending tachograph type approval to four further jurisdictions required modest incremental validation against work already completed, opening enforcement-specified content at high margin.
  4. Two-wheeler instrumentation conversion in export markets was being served by Asian suppliers alone, at volumes the client had dismissed on unit value without ever modelling the aggregate.
RECOMMENDED STRATEGY
Phase 1: Phase one: abandon the internal verification platform proposal, since the required record asset cannot be built by a component supplier within any commercially relevant period. Phase 2: Phase two: extend tachograph type approval across four additional jurisdictions using existing validation work, capturing enforcement-specified content at materially better margin. Phase 3: Phase three: evaluate partnership with an established verification provider rather than competing, offering instrumentation integration in exchange for data access.
OUTCOME
The internal platform proposal was withdrawn before significant spending. Tachograph approval now covers six jurisdictions and enforcement-specified revenue has grown materially. A verification partnership is under negotiation, and the client reports margin mix improving without any acquisition (client-reported, unverified by MMA). Capital was redeployed toward approvals instead.

Frequently Asked Questions

Foundational context covering the market sizes, CAGR, scope, country, region and competition that inform every finding below. This section is provided to cover basics and most often pre-purchase conversations, answered from the MMA Primary Research Dataset.

What is the current size of the Odometer Market?

The market was valued at USD 3.8 billion in 2025, rising to an estimated USD 4.09 billion in 2026. East Asia holds the largest regional share at 36% of value.

How large will the Odometer Market be by 2036?

MMA forecasts USD 8.51 billion by 2036 under the base case, an expansion multiple of 2.08 times the 2026 value. That represents USD 4.42 billion of incremental value.

What is the CAGR for the Odometer Market 2026 to 2036?

The base case runs at 7.6% compound annual growth between 2026 and 2036, with a bull case at 8.8% and a bear case at 6.4%. Historical growth from 2020 to 2025 was 6.2%.

Which segment is growing fastest?

Mileage verification and data integrity services lead at 11.4%, half again the market rate, because a forty dollar tool can alter a value worth a quarter of resale price. Tachograph systems follow at 7.2%.

Who are the major companies in the Odometer Market?

Continental, Robert Bosch, DENSO, Visteon and Nippon Seiki hold 46% of supply. Cluster electronics capability rather than anything specific to distance recording sustains those positions.

Which country is growing fastest?

India leads at 10.6%, driven by two-wheeler production at volumes no other country approaches, alongside passenger vehicle output that is expanding under domestic manufacturing incentive programmes.

Report Segmentation Architecture

The full report scope spans multiple orthogonal segmentation dimensions, with cross-tabulated demand data provided for each dimension pair. Coverage extends further to regional breakdowns, trend trajectories, and the competitive detail needed to support segment-level decision-making.

By Product and Service Type

  • Digital Instrument Cluster Odometry
  • Mechanical and Hybrid Analogue Units
  • Commercial Vehicle Tachograph-Linked Systems
  • Two-Wheeler and Small Vehicle Instrumentation
  • Mileage Verification and Data Integrity Services
  • Replacement, Repair and Cluster Programming

By End-Use Industry

  • Passenger Vehicle Manufacturing
  • Commercial Vehicle and Fleet Operations
  • Two-Wheeler and Small Vehicle Production
  • Vehicle Leasing and Rental
  • Insurance and Underwriting
  • Used Vehicle Retail and Auction

By Commercial Channel

  • Original Equipment Programme Supply
  • Aftermarket Replacement and Repair
  • Registry and Inspection Data Services
  • Telematics-Sourced Mileage Feeds
  • Vehicle History Report Providers

By Region

  • North America
  • Western Europe
  • East Asia
  • South Asia and Pacific
  • Latin America
  • Middle East and Africa
  • Eastern Europe

Scope, Methodology, and Coverage

Every figure in this report is reproducible from documented input assumptions. The scope below maps the historical period, the forecast horizon, the segmentation dimensions, and the countries covered, alongside the underlying primary and qualitative methodology.
Historical Period
2020 to 2025
Forecast Period
2026 to 2036
Base Year
2025 (USD billions; MMA Primary Research Dataset, August 2026)
Market Definition
The market comprises vehicle distance recording instrumentation and the services that verify it, including digital instrument cluster odometry, mechanical and hybrid analogue units, commercial vehicle tachograph-linked systems, two-wheeler and small vehicle instrumentation, mileage verification and data integrity services, and replacement repair and cluster programming, reaching customers through original equipment, aftermarket, registry, telematics and history report channels. Value is measured at supplier level across instrumentation hardware and mileage service revenue. Complete instrument clusters where distance recording is incidental, full fleet telematics platforms, vehicle history reporting beyond mileage, and speedometer or navigation functions fall outside scope.
Quantitative Units
USD billions (current prices); units shipped and verified records issued; USD per unit by product and service type
Segmentation Dimensions
By Product and Service Type; By End-Use Industry; By Commercial Channel; By Region
Regions Covered
North America, Western Europe, East Asia, South Asia and Pacific, Latin America, Middle East and Africa, Eastern Europe
Countries Covered
China, Japan, South Korea, Taiwan, India, Indonesia, Thailand, Vietnam, Australia, United States, Canada, Mexico, Brazil, Argentina, Colombia, Germany, France, Italy, Spain, Belgium, Netherlands, United Kingdom, Sweden, Poland, Czechia, Slovakia, Romania, United Arab Emirates, Nigeria, South Africa
Key Companies Profiled
Continental, Robert Bosch, DENSO, Visteon, Nippon Seiki, Marelli, Valeo, Yazaki, Aptiv, LG Electronics, Panasonic Automotive Systems, Pricol, Minda Corporation, Stoneridge, Hyundai Mobis, Desay SV Automotive, Shenzhen Hangsheng Electronics, Carfax, carVertical, Actia Group
Quantitative Methodology
Primary survey, n=3,800 respondents, Q4 2025, six countries; demand-side model with trade association cross-validation
Qualitative Methodology
47 expert interviews, Q4 2025; applied to validate demand model assumptions, identify emerging dynamics, and assess competitive positioning
Report Format
PDF and XLSX data workbook (Word format preview document)
Publisher
Market Minds Advisory
Report Code
MMA-2026-AUT-362
Published
August 2026
Contact
sales@marketmindsadvisory.com | www.marketmindsadvisory.com

Purchase the full Odometer Market Report (2026 to 2036).

The full report sizes the global vehicle distance recording market to 2036 across six product and service types and seven regions, measured at supplier level across hardware and mileage service revenue. It treats odometry as a function inside a cluster rather than a discrete component, and sizes verification services as the place value has actually relocated. Competitive analysis covers 20 participants on one consistent revenue basis, with moat and risk assessment for the two leaders. Mileage fraud incidence and cross-border exposure are quantified by corridor. Four quantified revenue levers close the analysis.
Six product and service segments with individual growth rates
Verification services sized separately from instrumentation hardware
Mileage fraud incidence and value impact quantified by region
Cross-border used vehicle corridors mapped against record coverage
Twenty-participant competitive map on one consistent revenue basis
Four quantified revenue levers with commercial impact ranges

Built For The People Who Decide

From boardroom strategy to bench-side execution, this report is read cover-to-cover by leaders shaping the next decade of their industry, turning demand scenarios, market dynamics and valuation benchmarks into decisions.
CXOs/ Presidents/ VPs/ Managers
M&A and Corporate Development
Strategy Teams and R&D Heads
Procurement and Product Directors
Regulatory and Compliance Leaders
Investor Relations and Equity Analysts