
Market Minds Advisory
MENA Commercial Vehicles Market

MENA Commercial Vehicles Market: Giga-Project Demand and the Chinese Truck Push

MENA commercial vehicle demand rides on giga-project construction and last-mile delivery growth, while Chinese truck brands displace decades-old European and Japanese distributor networks on price, and Gulf transit authorities push early electric bus adoption.

Lead Analyst

David Horsley

Published

September 2026

Make Smarter Decisions with Customized Research Insights

Request a free sample report and evaluate market opportunities, growth trends, and competitive dynamics relevant to your business needs.

2025 MARKET VALUE$18.6BMarket Size 2025
2036 FORECAST VALUE$33.9BBase Case , 2026 to 2036
CAGR 2026 TO 20365.6 %Bull 6.8% / Bear 4.4%
INCREMENTAL OPPORTUNITY$14.2BNet 10- year value creation
EXPANSION MULTIPLE1.72x2036 value over 2026 base
Strategic Levers
M&A Pipeline
Regional Outlook
Country Rankings
Competitive Intelligence
Segmental Deep-dive
Call-Us : 91 93563 13602

Executive Snapshot and Market Trajectory

Commercial vehicle demand across MENA now rides on two separate engines at once. Giga-project construction in Saudi Arabia pulls in heavy trucks and vocational vehicles by the thousand, while e-commerce growth across the Gulf and Egypt keeps expanding light commercial van demand for last-mile delivery.
Electric and alternative-fuel vehicles are growing fastest as Gulf transit authorities electrify public bus fleets years ahead of most emerging markets, led by Dubai's RTA and Riyadh's public transport authority. East Asian OEMs, led by Chinese heavy truck makers, now supply the largest share of vehicles sold across the region, overtaking European brands that dominated fleet purchasing decisions for decades on reputation and dealer network depth alone.
Twenty manufacturers compete across radically different price tiers, from premium European heavy trucks to value-priced Chinese and Indian light commercial vehicles. Currency volatility and import tariff exposure remain a genuine commercial risk for markets without domestic assembly, since several North African currencies have moved sharply against the dollar in recent years, directly raising landed vehicle cost for fleet buyers. Fleet financing terms increasingly decide contract winners more than badge reputation alone across most large tenders.
Market Definition
The market covers new commercial vehicle sales across the Middle East and North Africa, spanning light commercial vehicles, medium and heavy trucks, buses and coaches, and specialized vocational vehicles. Used vehicle resale, passenger cars, and aftermarket parts and service revenue are excluded.
Base Year Value
$18.6B in 2025 (MMA Primary Research Dataset, August 2026)
Forecast Period
2026 to 2036, eleven discrete annual values
CAGR
5.6% base case. Bull 6.8%. Bear 4.4%.
Fastest Growth Segment
Electric and Alternative-Fuel Commercial Vehicles: 11.8% CAGR
Fastest Growth Country
Saudi Arabia: 9.5% CAGR
Fastest Growth Region
South Asia and Pacific: 7.9% CAGR
Largest Region
East Asia: 29% of 2025 global value
Market Leaders
Mercedes-Benz Trucks, Tata Motors, Sinotruk, Isuzu Motors, Volvo Group. Source: MMA Analysis based on company annual reports.
Primary Survey
n=3,800 procurement and R&D decision-makers, Q4 2025, six countries
Methodology
Demand-side build-up, cross-validated against public data, 47 expert interviews

MENA Commercial Vehicles Market Forecast Scenarios

mena-commercial-vehicles-market-trends-size-forecast-scenario-1787555111122
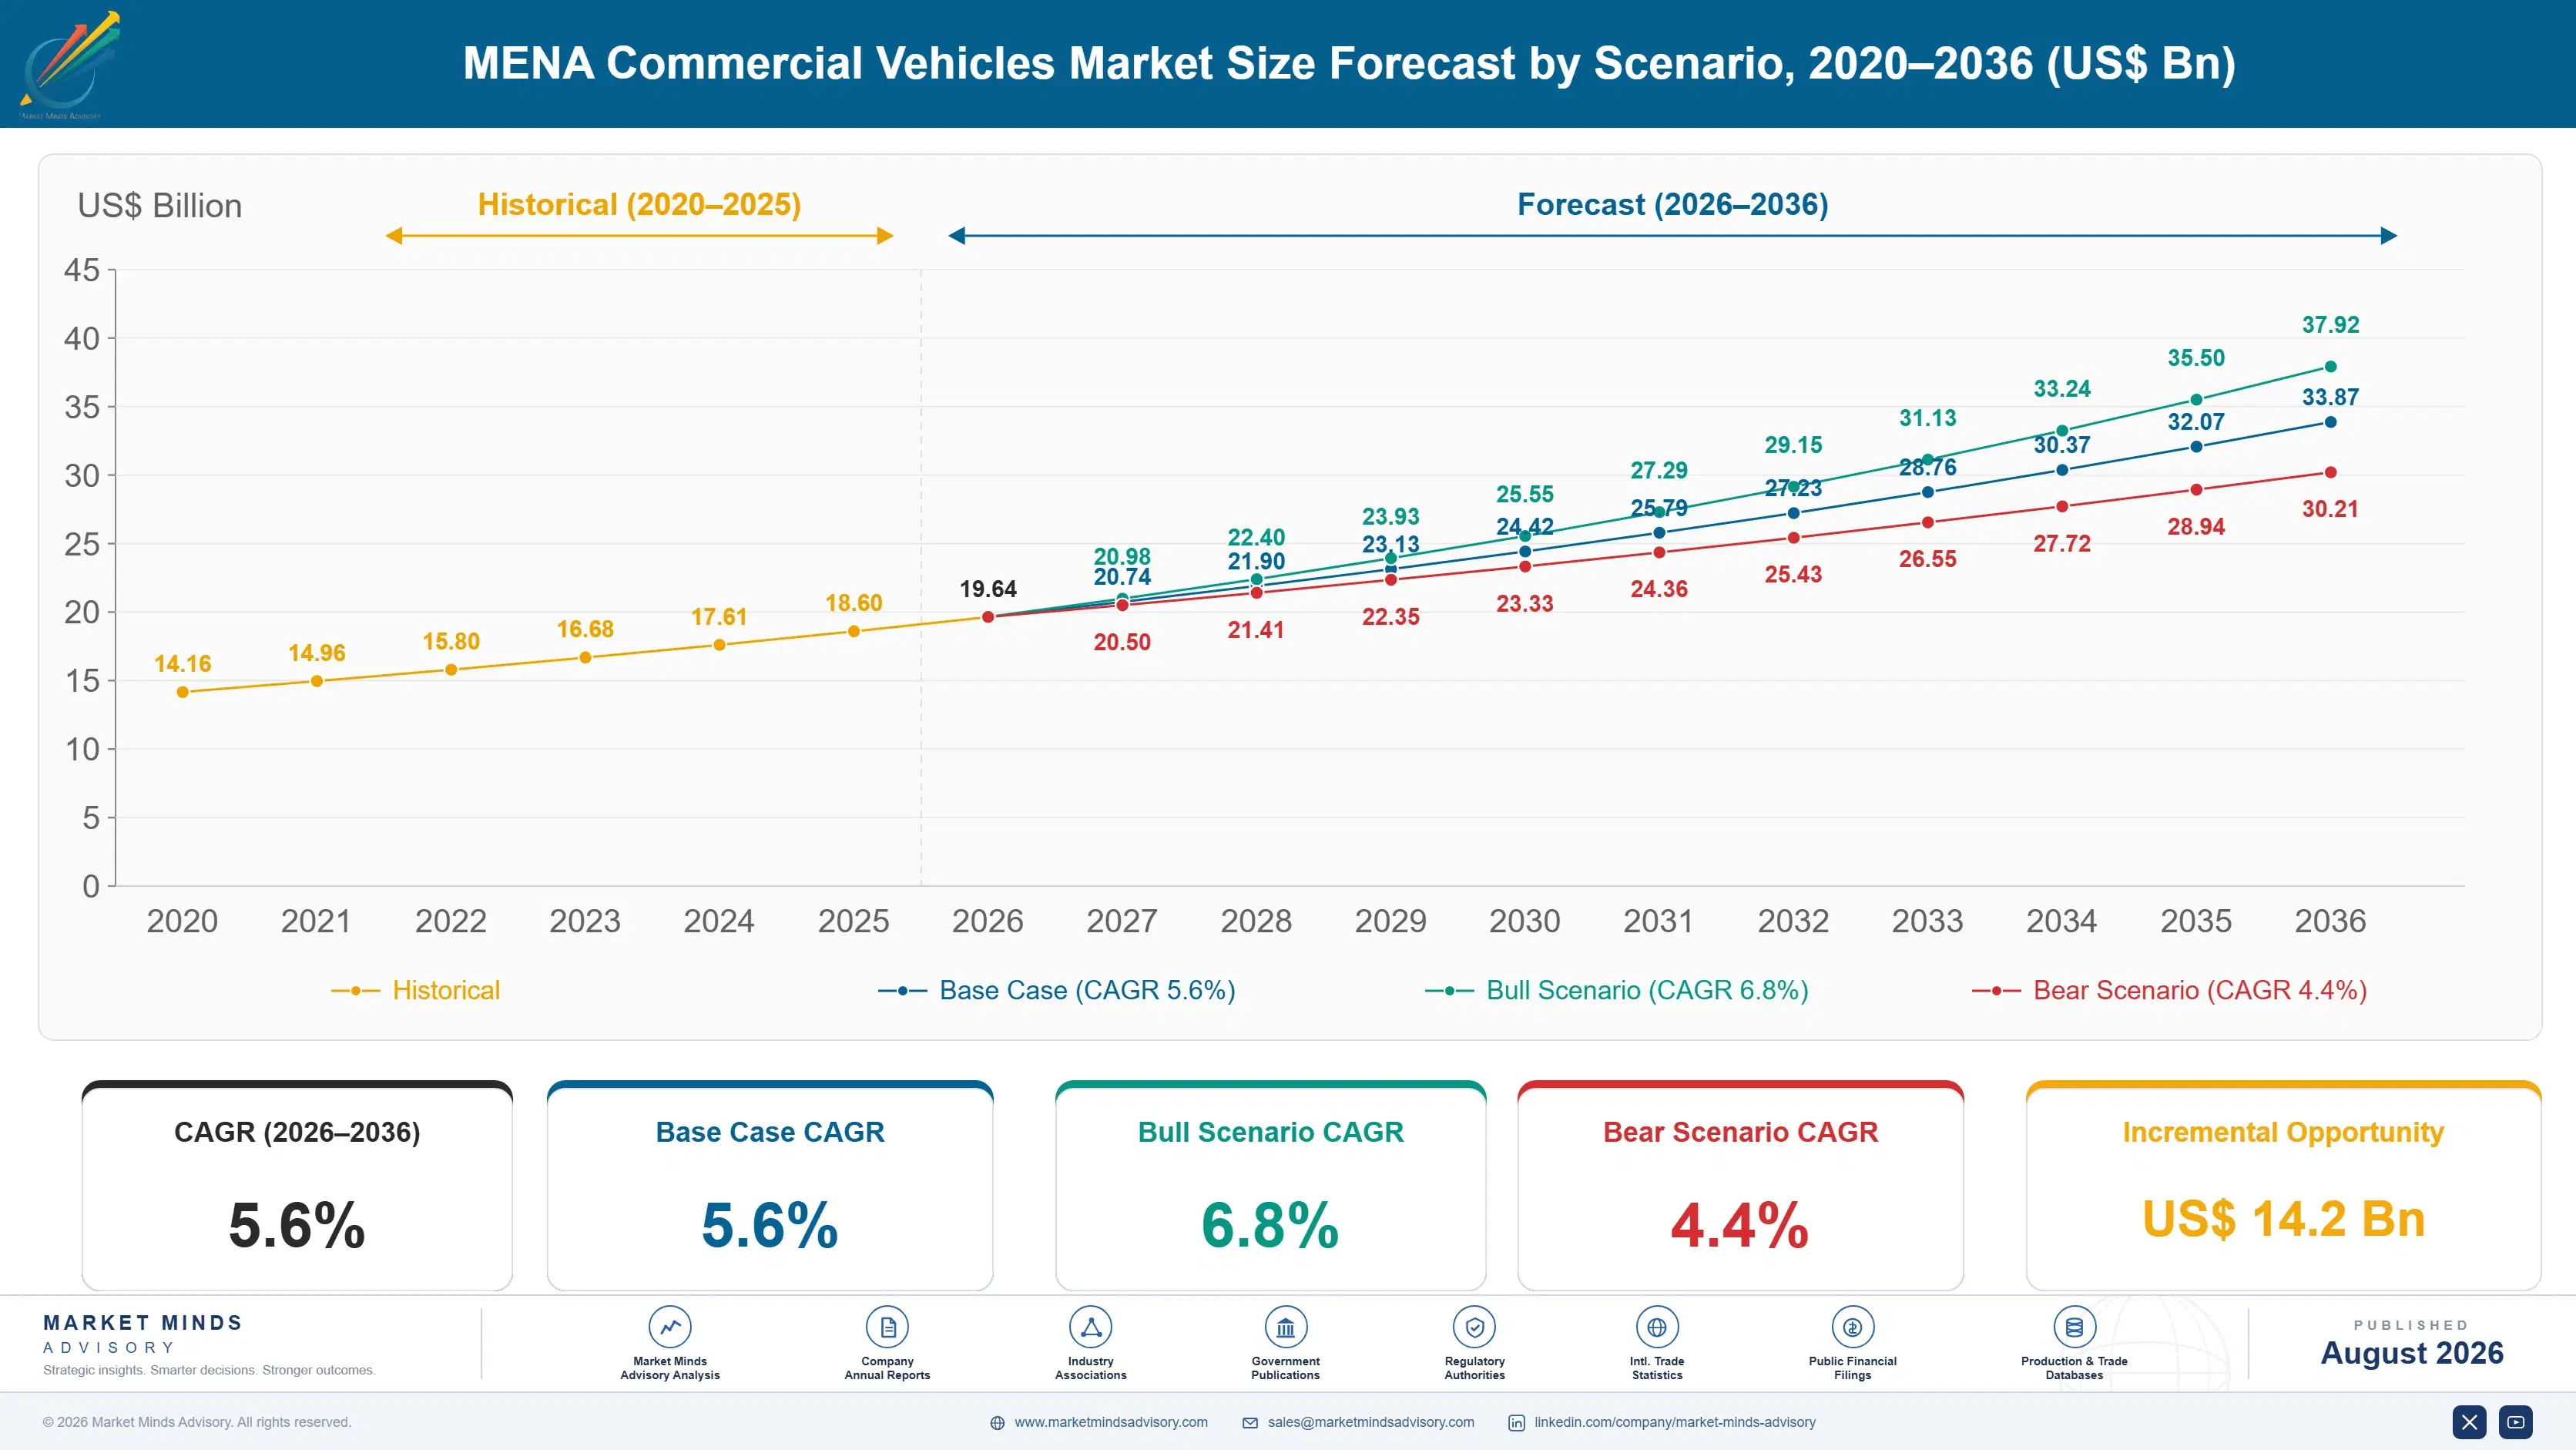
Between 2020 and 2025 the market grew near 4.3% a year, held back early by pandemic-era construction halts and fleet deferrals before recovering sharply from 2022 onward as Saudi giga-project spending accelerated and delivery-driven van demand expanded across Gulf and Egyptian cities alike. Government-linked construction spending proved the single most reliable demand anchor across that stretch.
The base case carries the market to 5.6% CAGR on three mechanisms: continued Saudi and UAE giga-project construction pulling heavy and vocational truck demand, e-commerce and quick-commerce expansion lifting light commercial van sales across every major MENA city, and Chinese OEM price competitiveness widening the addressable fleet-replacement base to buyers who previously could not afford European heavy trucks. None of these depends on oil price alone, which is what makes the base case durable across commodity cycles.
The bull case at 6.8% assumes faster-than-expected Saudi Vision 2030 project completion pulling forward vehicle procurement well ahead of schedule. The bear case at 4.4% assumes oil price weakness delays government-linked construction spending and currency pressure in Egypt or other import-dependent markets further raises landed vehicle cost, pushing fleet buyers to delay replacement cycles.

Giga-Projects, Delivery Vans, and the China Shift

Three forces converge on this market at once, and each moves on its own separate timeline. Government-linked giga-project spending in Saudi Arabia pulls heavy and vocational truck demand regardless of consumer sentiment, e-commerce growth keeps expanding light commercial van demand across dense Gulf and Egyptian cities, and Chinese OEM price competitiveness keeps widening the addressable buyer base beyond fleets that could previously only afford European trucks.
FLEET REPLACEMENT CYCLE7 to 9 yearstypical service life before commercial fleet replacement occurs
AVERAGE SELLING PRICEUSD 42,000/unitblended price across light and heavy vehicle segments
TOP ORIGIN SHARE29%East Asian OEM share of new MENA commercial vehicle sales
IMPORT DEPENDENCY91% of unitsshare of units arriving imported or as CKD kits
TRADE INTENSITY88%share of regional demand met through cross-border vehicle trade
HHI CONCENTRATION410a moderately concentrated regional manufacturer landscape overall
Commercially, the market behaves like a project-driven capital goods business wearing a consumer vehicle label. Brand loyalty genuinely exists, Mercedes-Benz and Volvo commanding real premiums among established fleet operators, but purchasing decisions increasingly track total cost of ownership and financing terms more than badge prestige alone. A Chinese OEM offering aggressive financing now wins fleet tenders that European brands would have won on reputation alone a decade ago.
Over the next decade, electrification and Chinese OEM expansion will decide winners more than giga-project spending cycles alone, since giga-project demand is already largely contracted and visible. Manufacturers investing early in Gulf electric bus and van programmes will capture transit authority relationships that legacy diesel-focused competitors cannot easily displace once established.
"Everyone still talks about European trucks as the default, but the fleet tender data tells a different story. Price and financing terms decide most contracts now, not the badge on the grille."
Director, Automotive and Mobility Practice · MMA Automotive Practice · August 2026

Market Trends

Chinese OEMs Displace European Brands on Fleet Price

Sinotruk, FAW, Dongfeng, and JAC have expanded heavy truck market share across Gulf and North African fleet tenders sharply over recent years, offering vehicles priced meaningfully below comparable European models while closing much of the historical quality gap that once protected incumbent brands. Egyptian and Saudi fleet operators facing currency pressure and tight financing have proven especially receptive to this value proposition, since total cost of ownership now often favours Chinese trucks once financing terms are included. Several Chinese OEMs have also opened regional CKD assembly facilities specifically to bypass import tariffs and shorten delivery lead times.
Market Impact: Adds 45,000 heavy trucks by 2028
Gulf Transit Authorities Electrify Public Bus Fleets Early

Dubai's Roads and Transport Authority and Riyadh's public transport programme have both committed to meaningful electric bus fleet conversion targets well ahead of most emerging markets globally, driven by air quality goals and each city's sustainability branding ambitions tied to giga-project marketing. Mercedes-Benz, BYD, and Yutong have all delivered electric buses into these programmes, competing on total cost of ownership across battery life and charging compatibility rather than sticker price alone. Private logistics fleets are following more cautiously, constrained by charging infrastructure gaps outside major metro areas. This early public-sector adoption is nonetheless building charging and maintenance infrastructure private fleets will eventually use.
Market Impact: Adds 62,000 LCV units annually

Market Opportunities and Growth Drivers

Saudi Giga-Project Construction Pulls Heavy Truck Demand

NEOM, the Red Sea Project, Qiddiya, and dozens of related Saudi Vision 2030 developments continue driving sustained demand for heavy trucks, concrete mixers, and vocational construction vehicles well beyond what organic Saudi economic growth alone would generate. Contractors on these projects typically commit to multi-year vehicle leasing and purchase agreements tied directly to construction schedules, giving OEMs unusually visible forward demand compared with most consumer vehicle categories. Delays to any single giga-project can shift demand timing but rarely eliminates it, since the broader national development programme keeps replacing individual project slippage with fresh activity elsewhere.
Market Impact: Raises landed cost up to 18%

E-Commerce Growth Expands Light Commercial Van Demand

Online retail and quick-commerce delivery services have expanded rapidly across Gulf cities and Egypt, and nearly all last-mile delivery capacity depends on light commercial vans and pickups rather than passenger cars or motorcycles common in other emerging markets. Regional logistics companies and quick-commerce platforms have signed large fleet orders directly with manufacturers rather than buying through traditional dealer networks, changing how OEMs structure regional sales relationships. Ford, Toyota, and Hyundai have all expanded light commercial van lineups specifically targeting this fleet channel rather than individual consumer buyers. This channel shift is also pulling telematics and fleet management software revenue into what was once a pure hardware sale.
Market Impact: Delays deployment 3 to 5 months

Market Restraints and Challenges

Currency Volatility Raises Landed Cost in Import-Dependent Markets

Egypt's pound and several other regional currencies have moved sharply against the dollar over recent years, and since roughly 91% of MENA commercial vehicles arrive fully imported or as CKD kits priced in dollars, that movement passes directly into landed vehicle cost for local fleet buyers. The root cause is heavy dependence on imported vehicles and components rather than any single policy decision, since most MENA markets lack the scale to support fully localised manufacturing. Manufacturers are responding by expanding regional CKD assembly specifically to reduce dollar-denominated import content. Some fleet buyers are also shifting toward longer replacement cycles to spread currency risk further.
Market Impact: Chinese OEM share adds 9 points

Driver Shortage Constrains Fleet Expansion Across the Region

Regional logistics and construction companies report persistent shortages of qualified heavy vehicle drivers, particularly for specialized vocational equipment requiring specific licensing and safety training that most vocational training programmes have not scaled to match demand. The root cause is a combination of rapid fleet growth outpacing driver training capacity and continued reliance on expatriate labor whose visa and recruitment processes add real delay to fleet deployment timelines. Fleet operators are responding by investing directly in driver training academies and by favouring automated transmission and driver-assistance technology that reduces the skill threshold required for new hires entering the workforce.
Market Impact: Adds 4,200 electric buses by 2030
2 additional market trends, 3 additional growth drivers, and 2 additional restraints and challenges are covered in the full report. Contact sales@marketmindsadvisory.com to access the complete intelligence.

Segment CAGR and Growth Architecture

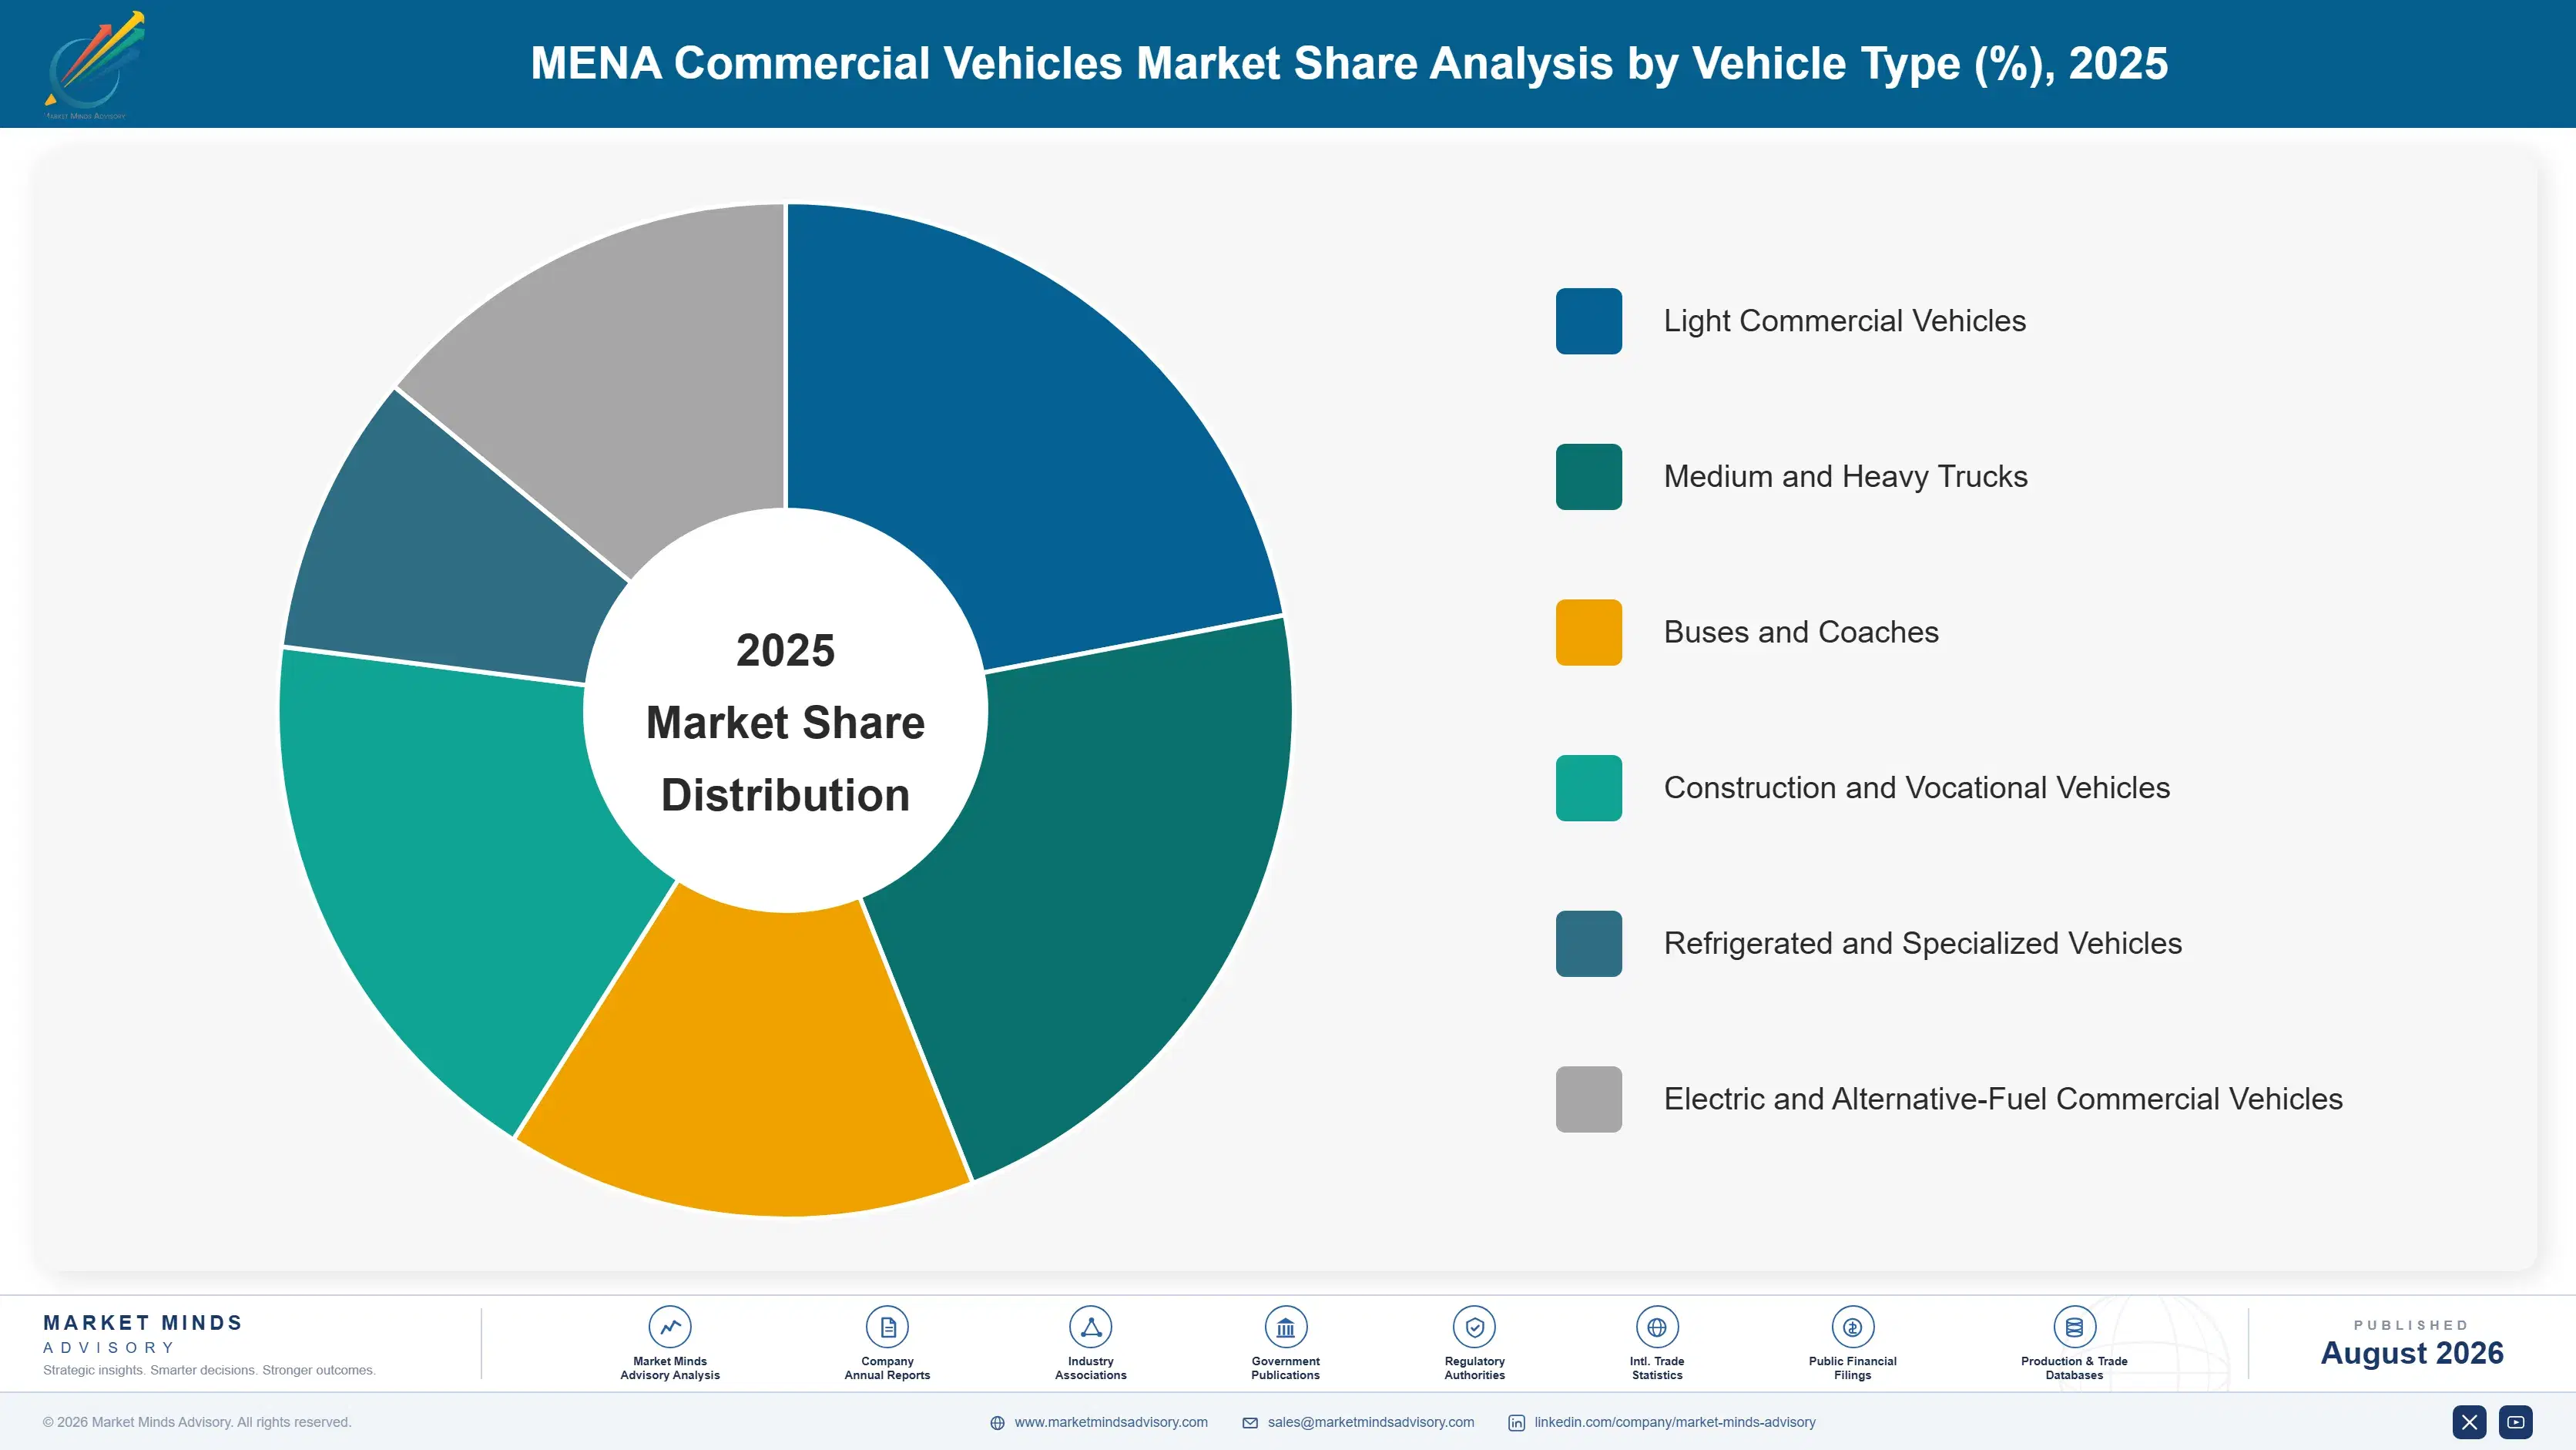
Segmentation follows vehicle type, the single commercial logic determining chassis specification, financing structure, and buyer base. Light commercial vehicles dominate by unit volume, while electric and specialized vehicle categories are growing fastest on transit electrification and giga-project vocational demand. Buses, refrigerated vehicles, and vocational trucks each carry distinct buyer bases and procurement cycles of their own.
mena-commercial-vehicles-market-trends-market-share-analysis-1787555111659

Electric and Alternative-Fuel Commercial Vehicles

Electric and alternative-fuel commercial vehicles grow fastest at 11.8%, about 2.11 times the overall 5.6% rate, as Gulf transit authorities commit to public bus fleet electrification years ahead of most emerging markets globally. Dubai's Roads and Transport Authority and Riyadh's public transport programme anchor current deployment, while private logistics fleets remain more cautious given charging infrastructure gaps outside major metro areas. Mercedes-Benz, BYD, and Yutong compete directly for these transit contracts on total cost of ownership rather than sticker price, since public buyers evaluate battery life and charging compatibility carefully before committing to any single supplier. Growth from this small base should keep accelerating as charging infrastructure expands and battery costs keep falling relative to diesel alternatives.
CAGR 11.8%

Refrigerated and Specialized Vehicles

Refrigerated and specialized vehicles grow second-fastest at 6.9%, driven by expanding cold-chain logistics for food and pharmaceutical distribution across Gulf and North African markets where temperature-sensitive supply chains have historically been underdeveloped relative to consumer demand growth. Regional supermarket chains and pharmaceutical distributors increasingly specify reefer trucks with continuous temperature monitoring rather than basic insulated bodies, reflecting tightening food safety and pharmaceutical distribution regulation across several MENA countries. Tanker and specialized construction vehicles serving giga-project sites also fall within this category, adding further demand beyond pure cold-chain applications. Suppliers here compete on specialized body-building expertise rather than pure chassis price.
CAGR 6.9%
Full segment breakdown across 6 segments available in the complete report.

Regional Architecture and Country Demand Map

This report sizes the MENA commercial vehicle market itself, and the regional split reflects the geographic origin of vehicles sold into it. East Asian OEMs supply the largest share, ahead of established Western European heavy truck and bus manufacturers.

North America

American OEMs supply 22% of MENA commercial vehicle sales, with 5.5% growth, anchored heavily on Ford's Transit van and Ranger pickup lineups that remain genuinely popular fleet choices across Gulf logistics and construction companies. General Motors and Chevrolet contribute a smaller share concentrated in heavier pickup and van segments favoured by construction contractors. American brands compete less directly in the heavy truck and bus categories dominated by European and Chinese manufacturers, concentrating instead on light commercial vehicles where financing terms and dealer network depth matter more than badge prestige. Growth here tracks Gulf construction and delivery fleet expansion rather than any shift in underlying American manufacturing capacity or export strategy.
Share: 22% | CAGR: 5.5% (2026 to 2036)

Western Europe

Decades of established dealer networks and fleet operator trust explain Western Europe's 24% share, even as 4.0% growth trails every other origin region tracked here. Mercedes-Benz Trucks, MAN, Volvo, Scania, and IVECO built their regional position over generations of heavy truck and bus sales to government and large corporate fleets, and that installed base still generates meaningful replacement and parts demand today. Chinese OEM price competition has eroded European share specifically in price-sensitive heavy truck tenders, though premium construction and long-haul fleets still favour European brands for total lifecycle reliability. Growth stays modest because European OEMs are defending an already mature installed base rather than capturing genuinely new fleet buyers entering the market for the first time.
Share: 24% | CAGR: 4.0% (2026 to 2036)
Regional intelligence for 5 additional markets available in the complete report: East Asia, South Asia and Pacific, Latin America, Middle East and Africa, Eastern Europe. Contact sales@marketmindsadvisory.com.
mena-commercial-vehicles-market-trends-country-cagr-analysis-1787555112171

Where Manufacturers Can Defend Fleet Share

Giga-project timing and currency exposure set real limits on fleet buyer budgets, but four commercial moves let manufacturers capture more value regardless of origin country, and regardless of where any single oil price or construction cycle currently sits. Manufacturers ignoring all four risk losing share to competitors who combine several of these moves at once.

Offer Localised Financing Ahead of Fleet Tenders

Fleet operators increasingly award large contracts based on financing terms and total cost of ownership rather than sticker price alone, and manufacturers offering competitive local currency financing through regional banking partnerships win tenders that pure price competition alone would not secure. Chinese OEMs have used this approach specifically to win contracts against European incumbents who historically relied on brand reputation rather than aggressive financing structures, often trimming effective monthly payments by roughly 8%. Building dedicated regional financing partnerships requires real investment but has proven decisive in recent large fleet tender outcomes across Saudi Arabia and Egypt.
Market Impact: Wins 15% to 20% more fleet tenders

Expand CKD Assembly to Bypass Import Tariffs

Manufacturers operating local CKD assembly in Saudi Arabia, Egypt, or Morocco avoid the full import tariff and currency exposure that pure import-based competitors carry, cutting landed cost by 12% to 18% and giving them an advantage that grows more valuable whenever regional currencies weaken further. This investment also positions manufacturers favourably against increasingly common giga-project local content requirements that pure importers cannot satisfy at all. The capital requirement is meaningful but has already paid off for several Chinese and Korean OEMs expanding regional assembly specifically to capture this advantage.
Market Impact: Cuts landed cost by 12% to 18%

Build Dedicated Vocational and Giga-Project Sales Teams

Giga-project contractors specify vocational trucks and construction vehicles through multi-year procurement relationships rather than standard dealer showroom sales, and manufacturers building dedicated sales and service teams around individual giga-projects capture disproportionate share of this genuinely large demand pipeline. This approach requires manufacturers to embed technical and logistics staff near major project sites, typically under agreements spanning 5 to 7 years, rather than relying purely on national distributor networks. Early movers in Saudi Arabia's NEOM and Red Sea Project have already secured multi-year supply agreements that later entrants will find considerably harder to displace.
Market Impact: Captures 20% to 30% of project share

Invest Early in Gulf Electric Bus and Charging Partnerships

Gulf transit authorities are awarding electric bus fleet contracts years ahead of most emerging markets, and manufacturers building charging infrastructure partnerships alongside vehicle sales secure multi-year transit relationships worth 10 years or more that pure vehicle suppliers cannot match on total service value. This investment also builds regional maintenance and charging infrastructure that private fleets will eventually access, creating a second revenue stream beyond the initial contract itself. Mercedes-Benz, BYD, and Yutong have all pursued this integrated approach specifically to win Dubai and Riyadh transit tenders ahead of competitors offering vehicles alone.
Market Impact: Locks in 10 years of transit contract value

Who Controls the Margin Pool

Concentration sits at a moderate CR5 of 34%, measured consistently across all participants on new MENA commercial vehicle unit sales. Mercedes-Benz Trucks and Tata Motors lead on established distributor depth and value pricing respectively, and the gap to Sinotruk and other Chinese challengers is narrowing quickly as price-sensitive fleet buyers increasingly favour total cost of ownership over brand heritage alone.
Competitive activity today runs along three lines: Chinese OEM price and financing expansion into traditionally European-dominated heavy truck tenders, CKD assembly investment to bypass import tariffs and currency exposure, and early positioning around Gulf transit authority electric bus programmes. Manufacturers lacking regional assembly increasingly pursue joint ventures with local partners rather than relying purely on direct import, given mounting currency and tariff exposure.

Pressure is building from Chinese and Indian OEMs simultaneously, both targeting the same price-sensitive fleet buyers that European incumbents have historically served through reputation rather than aggressive commercial terms. Any manufacturer still competing purely on brand heritage without matching financing and localisation investment faces a widening share disadvantage that pure product quality cannot offset on its own. That widening gap should keep accelerating as Chinese and Indian OEMs expand regional financing capability further.
mena-commercial-vehicles-market-trends-company-positioning-matrix-1787555112693

Competitive Moat and Risk Dimensions

MERCEDES-BENZ TRUCKS

Moat: Decades of fleet operator trust

Mercedes-Benz Trucks built its MENA position over decades of heavy truck and bus sales to government and large corporate fleets, and that installed base generates substantial recurring parts and service revenue beyond new vehicle sales alone. Its early move into Gulf electric bus programmes also positions it favourably ahead of competitors still purely focused on diesel fleet renewal.
MERCEDES-BENZ TRUCKS

Risk: Price disadvantage against Chinese entrants

Mercedes-Benz Trucks carries meaningfully higher list pricing than Chinese competitors offering comparable specification, and that gap has already cost it share in several recent price-sensitive fleet tenders across Egypt and North Africa. Continued Chinese OEM expansion into CKD assembly threatens to erode its cost position further unless it matches that localisation investment directly.
TATA MOTORS

Moat: Value pricing, service reach

Tata Motors competes specifically on value pricing for light and medium commercial vehicles, winning share among smaller fleet operators across Egypt, the Levant, and parts of the Gulf who cannot justify premium European pricing. Its established regional distributor and service network, built over many years, gives it credibility that newer Chinese entrants still lack in some markets.
TATA MOTORS

Risk: Squeezed by Chinese entrants

Tata Motors faces intensifying pressure from Chinese OEMs offering comparable value pricing with increasingly competitive quality, while giga-project contractors requiring heavier vocational specification often bypass it entirely for European or American alternatives. This squeeze between two directions leaves less room for margin expansion than its unit volume alone would suggest.

Players Tracked

Prominent Players

Mercedes-Benz Trucks
Tata Motors
Sinotruk
Isuzu Motors
Volvo Group

Other Key Players

MAN Truck and Bus
Scania
IVECO Group
Ashok Leyland
Ford Motor Company
Toyota Motor Corporation
Hyundai Motor Company
Dongfeng Motor Corporation
FAW Group
JAC Motors
Hino Motors
Mitsubishi Fuso Truck and Bus Corporation
King Long United Automotive
Ford Otosan
GB Auto

Recent Developments

JANUARY 2025

Sinotruk forms Saudi CKD assembly joint venture

Sinotruk formed a genuine joint venture with a Saudi industrial partner to build a CKD heavy truck assembly facility near Jeddah, with both parties holding equity stakes. The plant targets giga-project vocational truck demand and aims to satisfy local content requirements tied to major Saudi construction programmes specifically.
Signal: Chinese OEMs are moving from pure import competition to genuine local manufacturing presence across the Gulf.
OCTOBER 2024

Tata Motors signs GCC logistics fleet supply agreement

Tata Motors signed a multi-year fleet supply agreement with a major GCC logistics operator covering several thousand light and medium commercial vehicles. The arrangement was a commercial supply contract, not an equity transaction, and included integrated telematics and maintenance terms.
Signal: Large fleet operators increasingly negotiate multi-year volume contracts directly rather than via dealer networks.
APRIL 2025

Mercedes-Benz Trucks expands Dubai electric bus deployment

Mercedes-Benz Trucks signed an expanded vehicle supply and charging infrastructure agreement with Dubai's Roads and Transport Authority. The deal was a commercial supply and services agreement rather than a joint venture, extending an existing electric bus relationship with added charging commitments.
Signal: Vehicle suppliers are bundling charging infrastructure into transit contracts to deepen switching costs against new entrants.

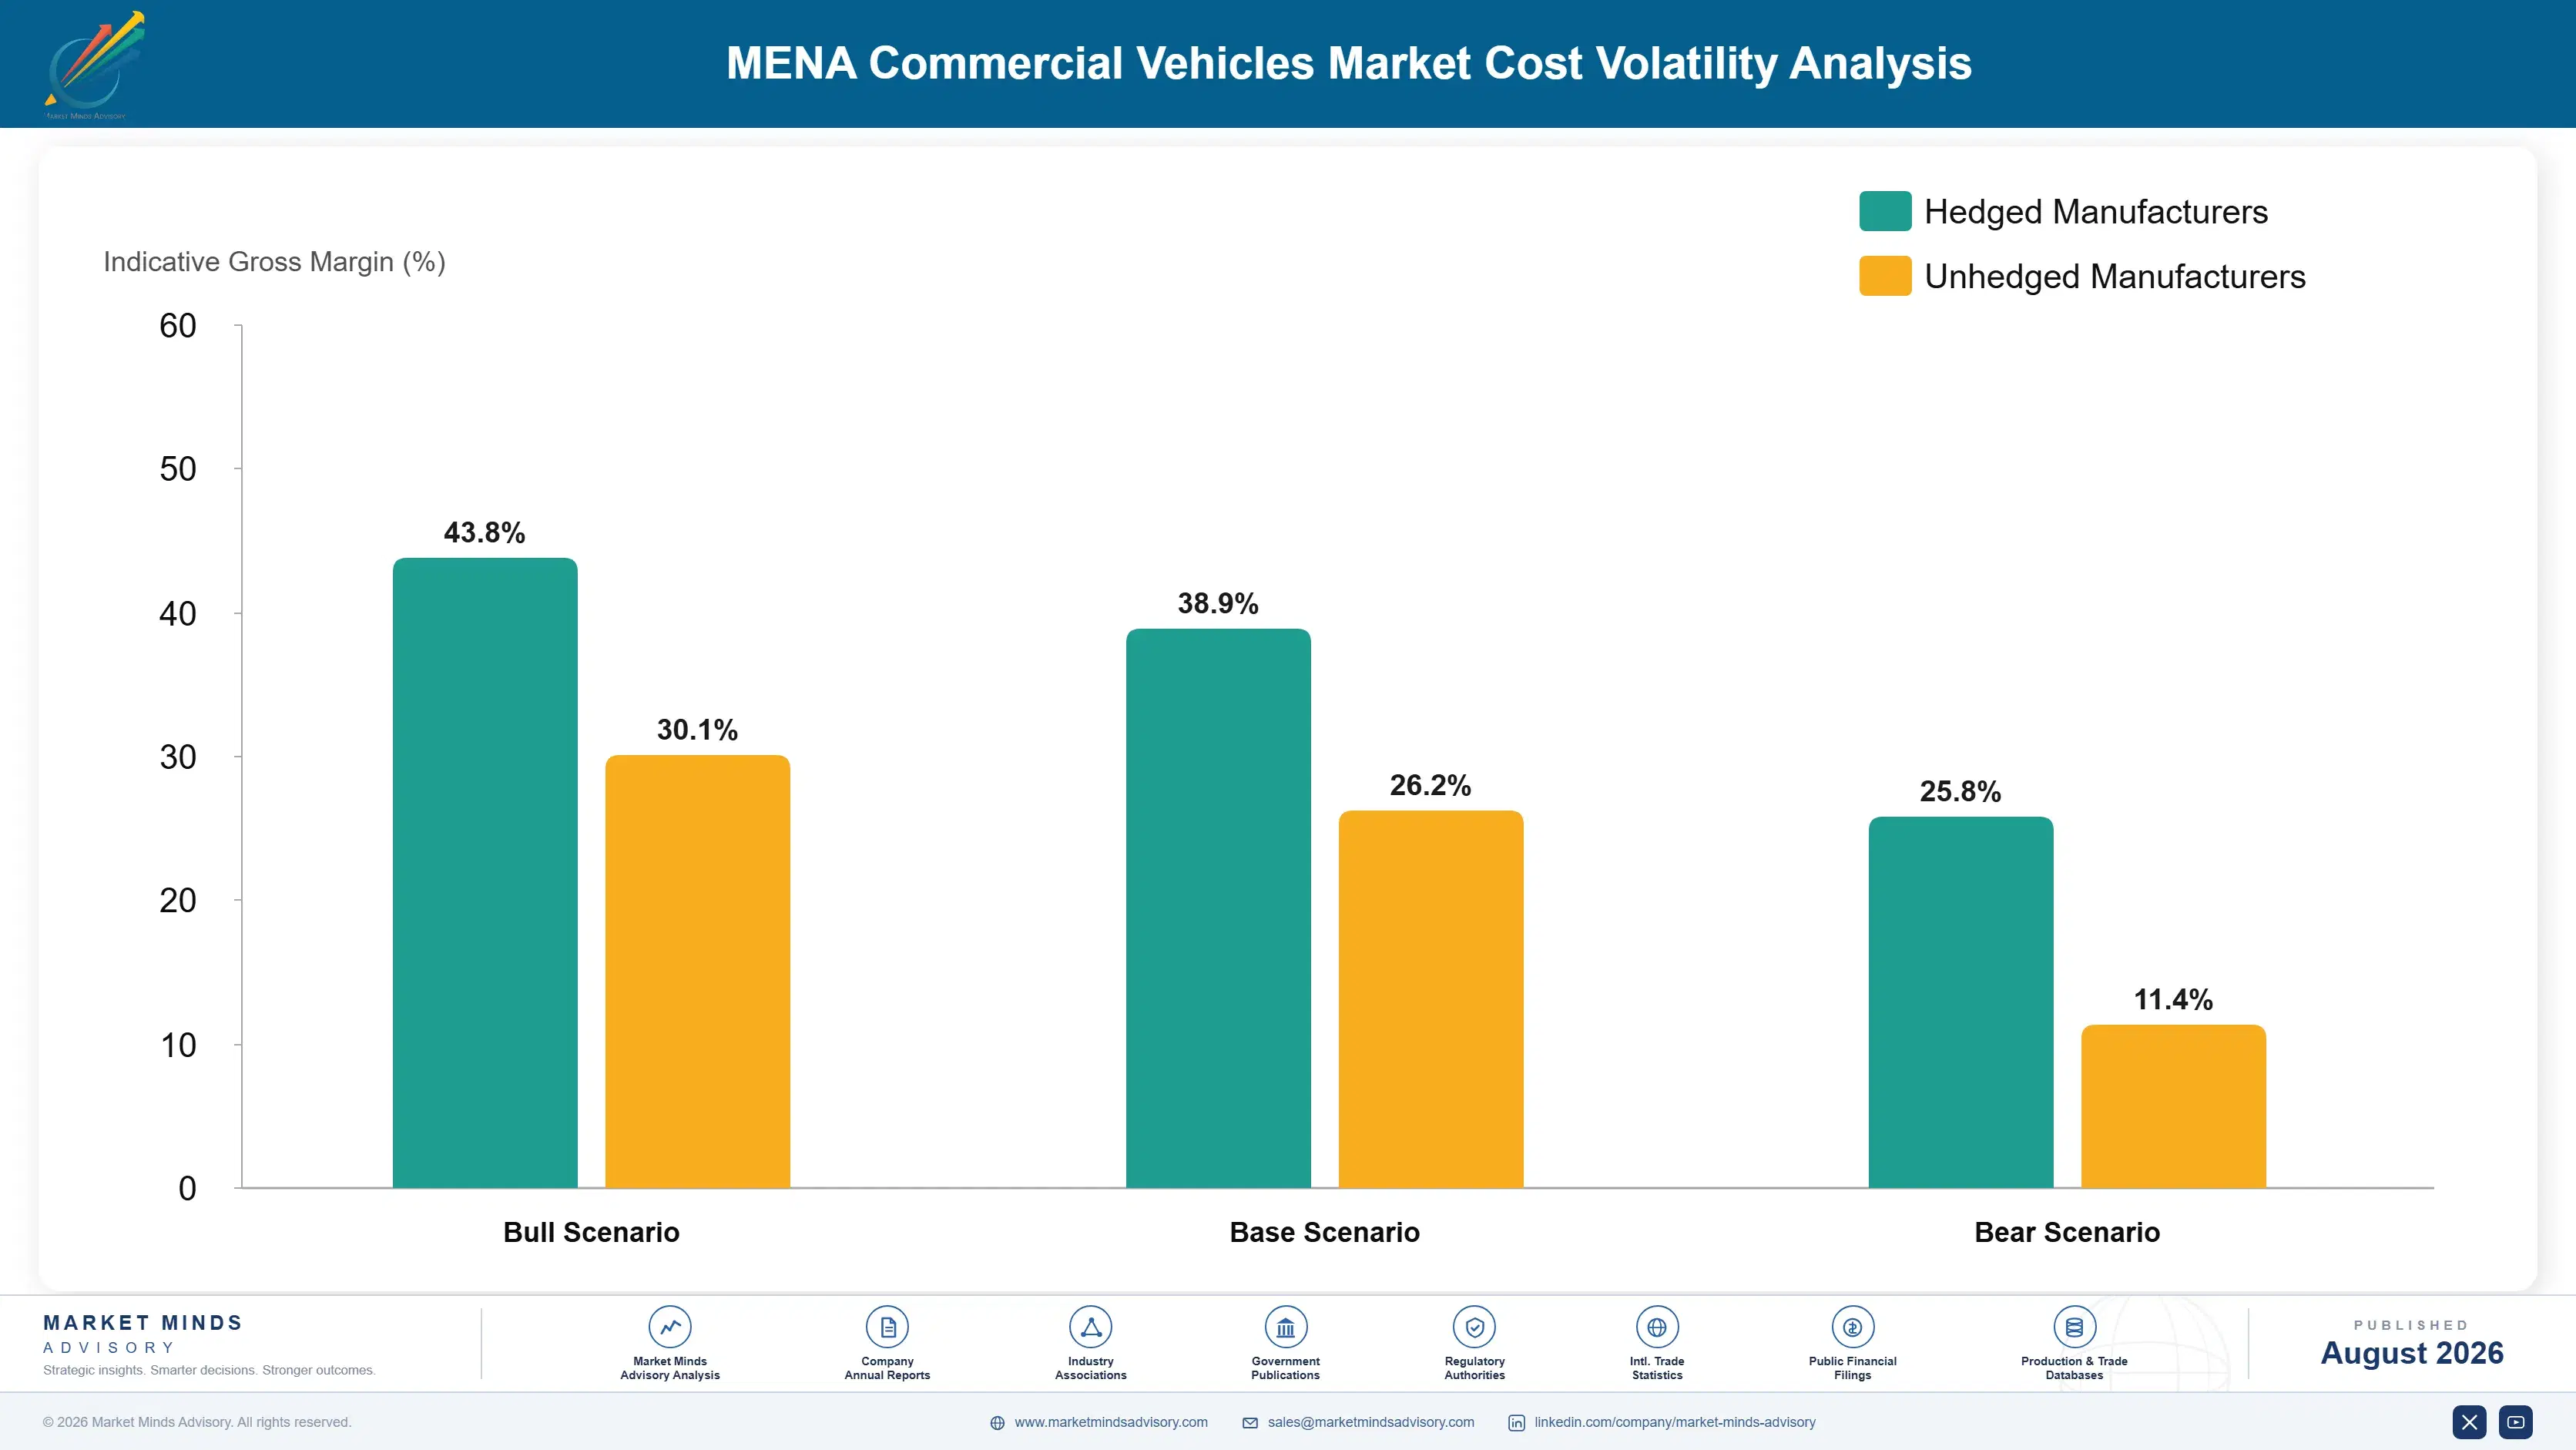
Import Content and Currency Pass-Through

Imported vehicle and component content runs roughly 68% of landed cost of goods sold across MENA commercial vehicle sales, priced predominantly in dollars or euros regardless of the local currency in which vehicles are ultimately sold to fleet buyers. Freight, tariffs, and local assembly labor add a further 15% to 20%, with dealer margin and financing cost making up the remainder of total landed cost.
The 2022 to 2023 Egyptian pound devaluation showed how directly that exposure translates into buyer cost. Egypt's central bank allowed the pound to float and depreciate sharply against the dollar, and industry trade data recorded new commercial vehicle prices in Egypt rising substantially within a single year as importers passed dollar-denominated cost directly through to local buyers. Fleet operators without hedging absorbed the increase almost immediately.

Exposure separates buyers cleanly by market and sourcing strategy. Gulf fleet operators in dollar-pegged currencies like the Saudi riyal and UAE dirham avoided most of that shock entirely, while Egyptian and other floating-currency buyers carried the full pass-through directly into fleet replacement budgets. That gap has hardened into a durable disadvantage for buyers in non-pegged markets lacking local assembly.
mena-commercial-vehicles-market-trends-cost-volatility-analysis-1787555112888

Expand CKD assembly in dollar-pegged Gulf markets

Building assembly capacity in Saudi Arabia or the UAE, both dollar-pegged currencies, reduces the currency mismatch that hits floating-currency markets like Egypt directly. This approach also positions vehicles to satisfy giga-project local content requirements increasingly common across major Gulf construction programmes and tenders. Several Chinese and Korean manufacturers have already committed capital specifically toward this approach.

Offer local currency financing to shift exchange risk

Manufacturers providing financing denominated in local currency, rather than passing dollar-linked pricing directly to buyers, can absorb exchange rate risk through hedging instruments unavailable to individual fleet operators. This approach has become a genuine competitive differentiator specifically in Egypt and other floating-currency markets facing continued devaluation pressure. Buyers increasingly favour manufacturers offering this protection over those quoting dollar-linked pricing alone.

Extend fleet replacement cycles to spread currency exposure

Fleet operators facing currency pressure increasingly extend vehicle service life beyond the typical seven to nine year replacement cycle, spreading the impact of any single currency shock across more years of service. This approach delays revenue for manufacturers but has proven necessary for buyers in markets experiencing sustained currency depreciation and rising import cost.

Portfolio Architecture for Margin Defence

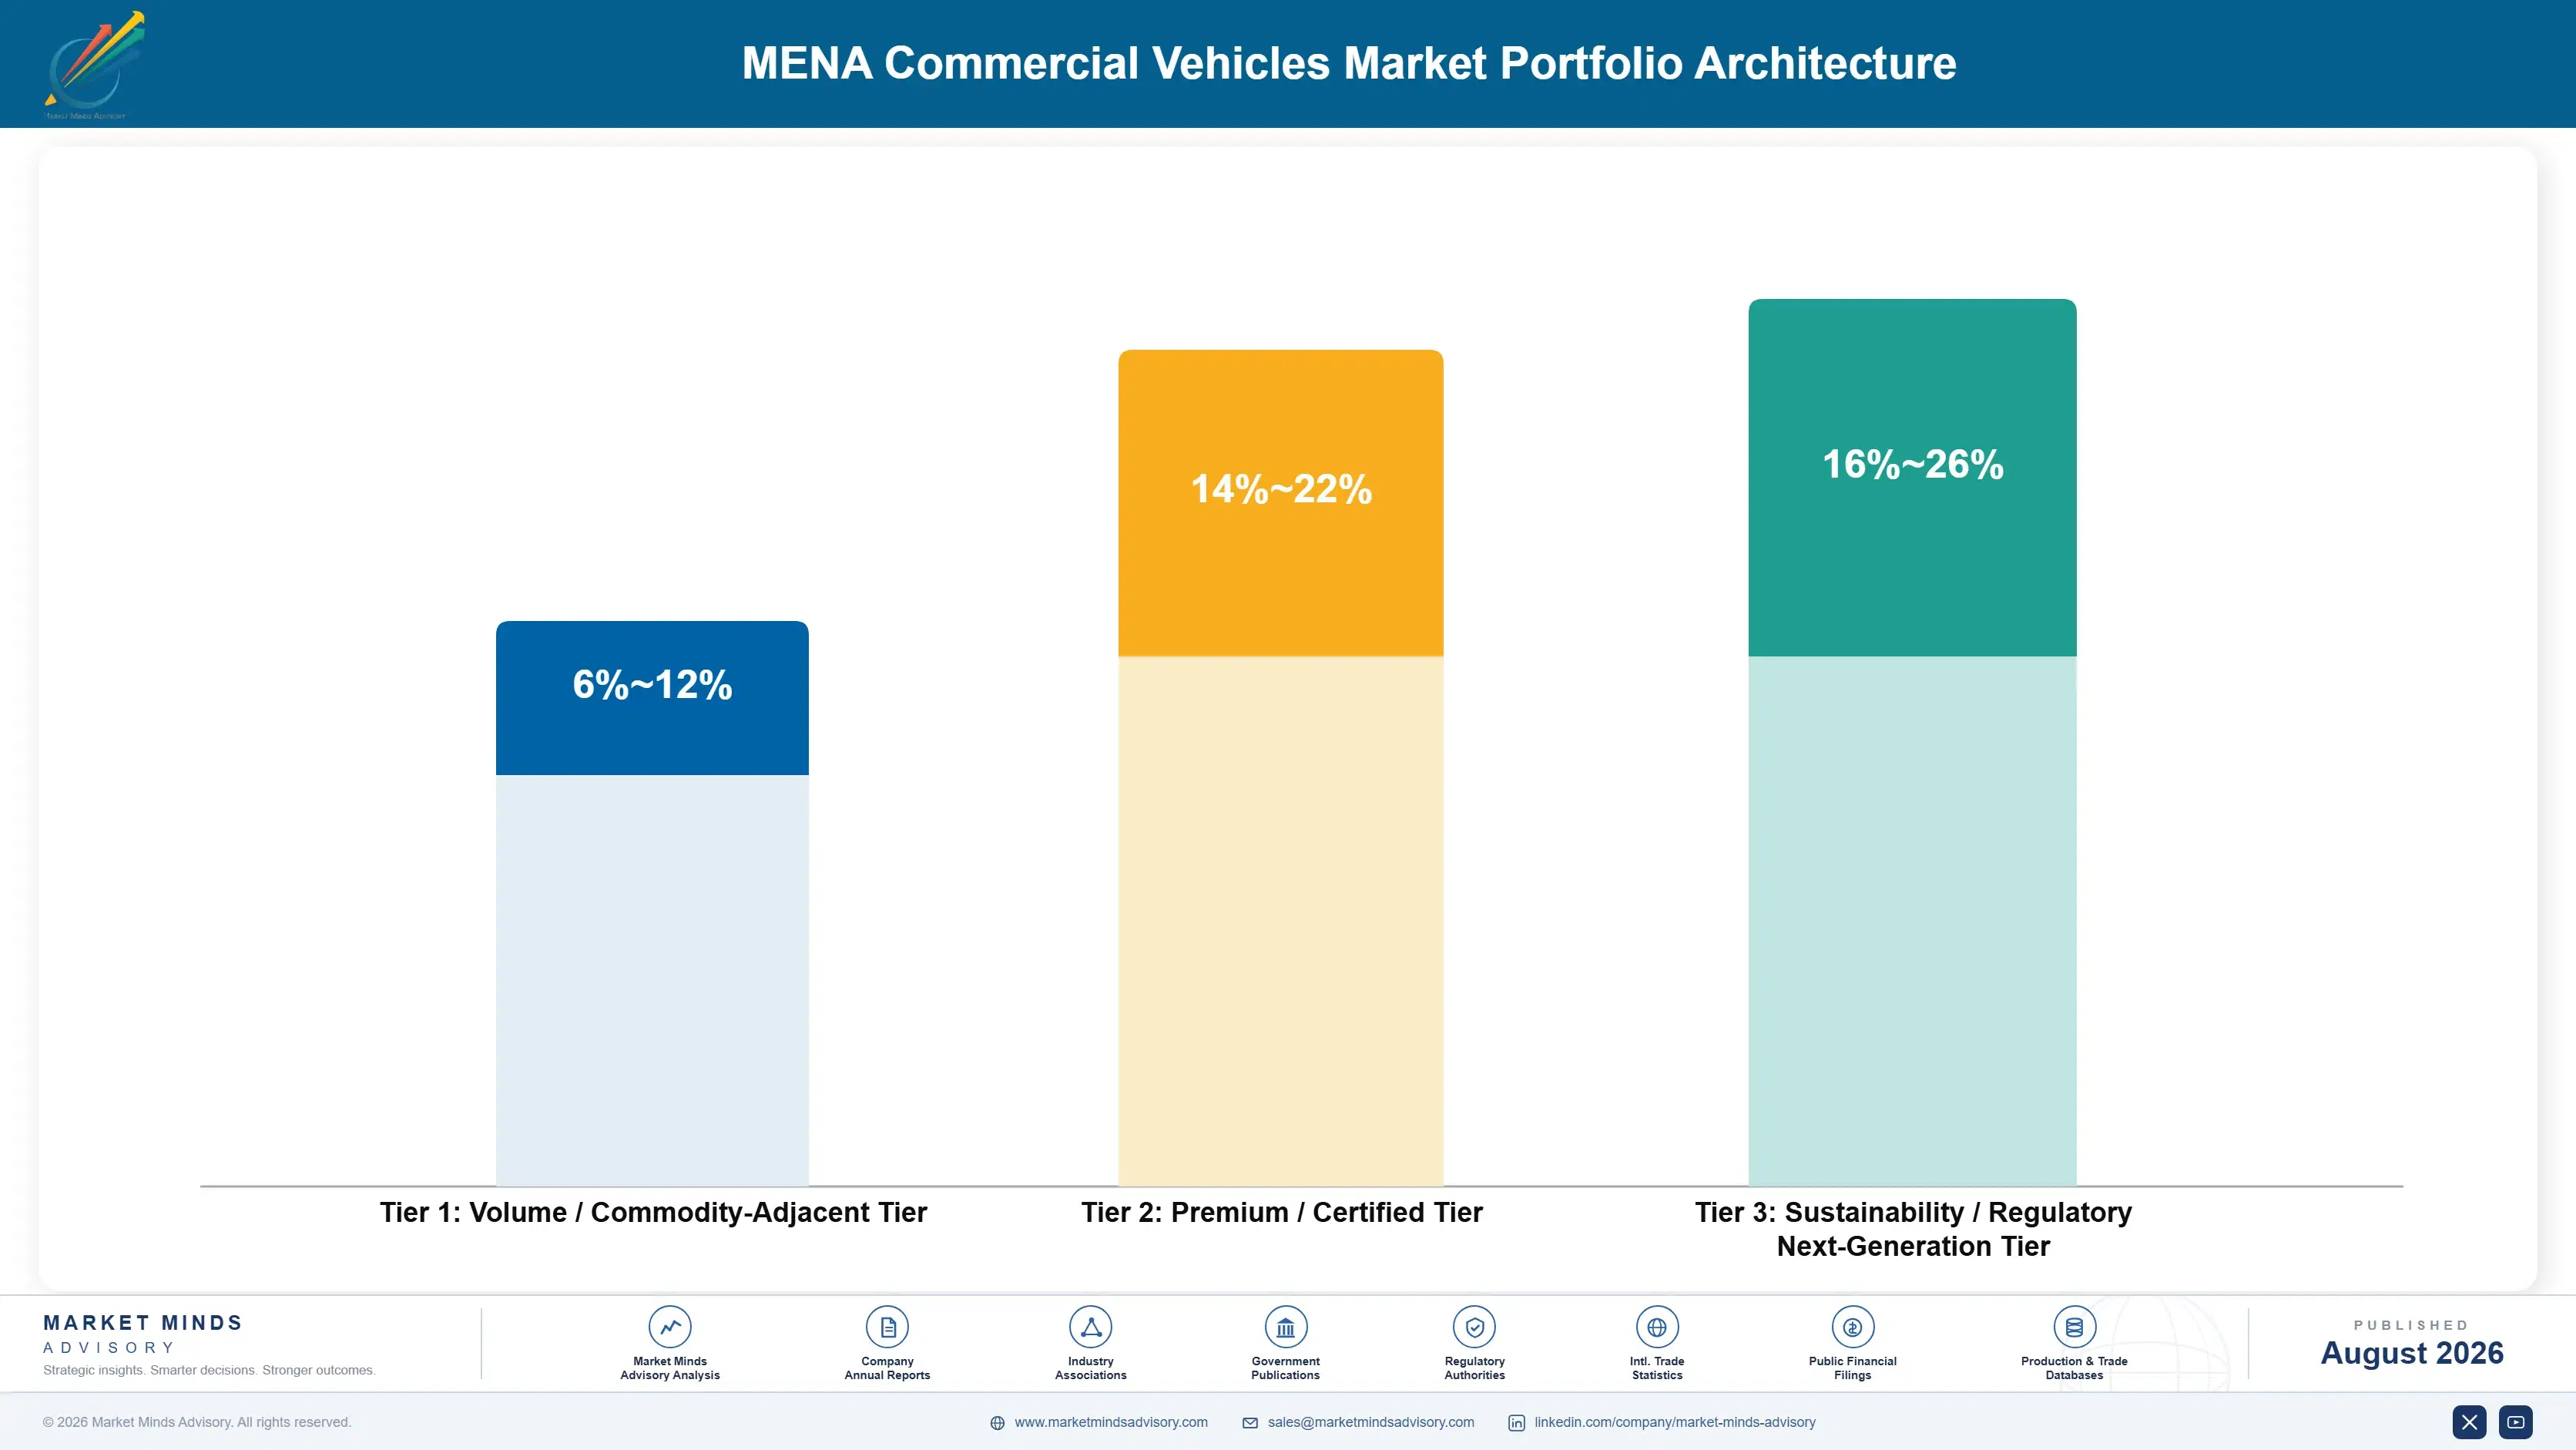
The portfolio splits into three tiers with real margin separation tied to brand positioning and financing structure rather than raw vehicle specification alone. Value-tier light and medium commercial vehicles compete almost entirely on price and financing terms, while certified premium and giga-project vocational vehicles earn meaningfully more on total lifecycle reliability that budget-tier vehicles simply cannot match at any price. Buyers increasingly specify tier explicitly during tender design rather than leaving grade selection open.
The tension between value and premium runs through every fleet buyer's procurement decision each cycle. Value-tier vehicle volume dwarfs premium categories and will likely keep doing so given continued Chinese and Indian OEM price competitiveness, yet margin increasingly concentrates in giga-project vocational trucks and electric transit vehicles that require dedicated technical support most value-tier manufacturers have not built.

High-value pools concentrate specifically where technical specification or transit authority procurement limits substitutable supply: giga-project vocational and specialized vehicles commanding real premiums for reliability guarantees, and electric transit buses rewarding manufacturers who invested in charging infrastructure partnerships well ahead of broader market demand for electrification. Manufacturers without that early investment are now finding transit and giga-project tenders increasingly closed to them.

Volume / Commodity-Adjacent Tier

Value-priced light and medium commercial vehicles sold largely on price and financing terms against Chinese and Indian benchmark competition. Buyers switch suppliers relatively freely here based on price alone. Financing terms decide most tenders here.
Gross Margin: 6-12%

Premium / Certified Tier

Established European and Japanese heavy trucks and buses commanding premiums for total lifecycle reliability and established dealer service networks. Fleet operators rarely switch once a service relationship is established. Parts and service revenue compound over the vehicle's full lifecycle.
Gross Margin: 14-22%

Sustainability / Regulatory / Next-Generation Tier

Electric transit buses and giga-project vocational vehicles meeting specialized procurement and sustainability requirements from government buyers. Supply here still depends heavily on public-sector procurement cycles. Multi-year public contracts anchor most of this tier's revenue base.
Gross Margin: 16-26%
mena-commercial-vehicles-market-trends-portfolio-architecture-1787555113385

High-value Sub-segments and Strategic Watch-out

Electric and Alternative-Fuel Commercial Vehicles

High value and the fastest-growing segment at 11.8% CAGR, anchored by Gulf transit authority electrification programmes years ahead of most emerging markets. Margins remain wide because battery cost and charging infrastructure investment vary sharply across early deployment contracts. Private fleet adoption should follow once public charging infrastructure matures further.
Gross Margin: 14-24%

Giga-Project Vocational Vehicles

High value with strong, visible growth tied directly to Saudi Vision 2030 construction schedules rather than broader economic cycles. Multi-year procurement relationships reward manufacturers who embedded technical teams near project sites early, ahead of standard dealer competition. Later entrants face a considerably steeper climb to win comparable project access.
Gross Margin: 16-24%

Value-Tier Light Commercial Vehicles

The volume core of the market, competing on price and financing terms against intense Chinese and Indian OEM competition across every major fleet tender. Growth tracks e-commerce and delivery fleet expansion directly with limited differentiation beyond total cost of ownership. Margin compression here tracks Chinese and Indian OEM expansion directly.
Gross Margin: 6-12%

Import-Dependent Floating-Currency Fleets

The strategic watch-out. Fleet buyers and manufacturers operating purely in Egypt and other floating-currency markets without local assembly carry real exposure to the devaluation risk that has already hit landed vehicle cost hard, threatening replacement cycle economics broadly. Manufacturers without local assembly face the same exposure as their buyers.
Gross Margin: 4-14%

Fleet Tender Cycles and Buyer Loyalty

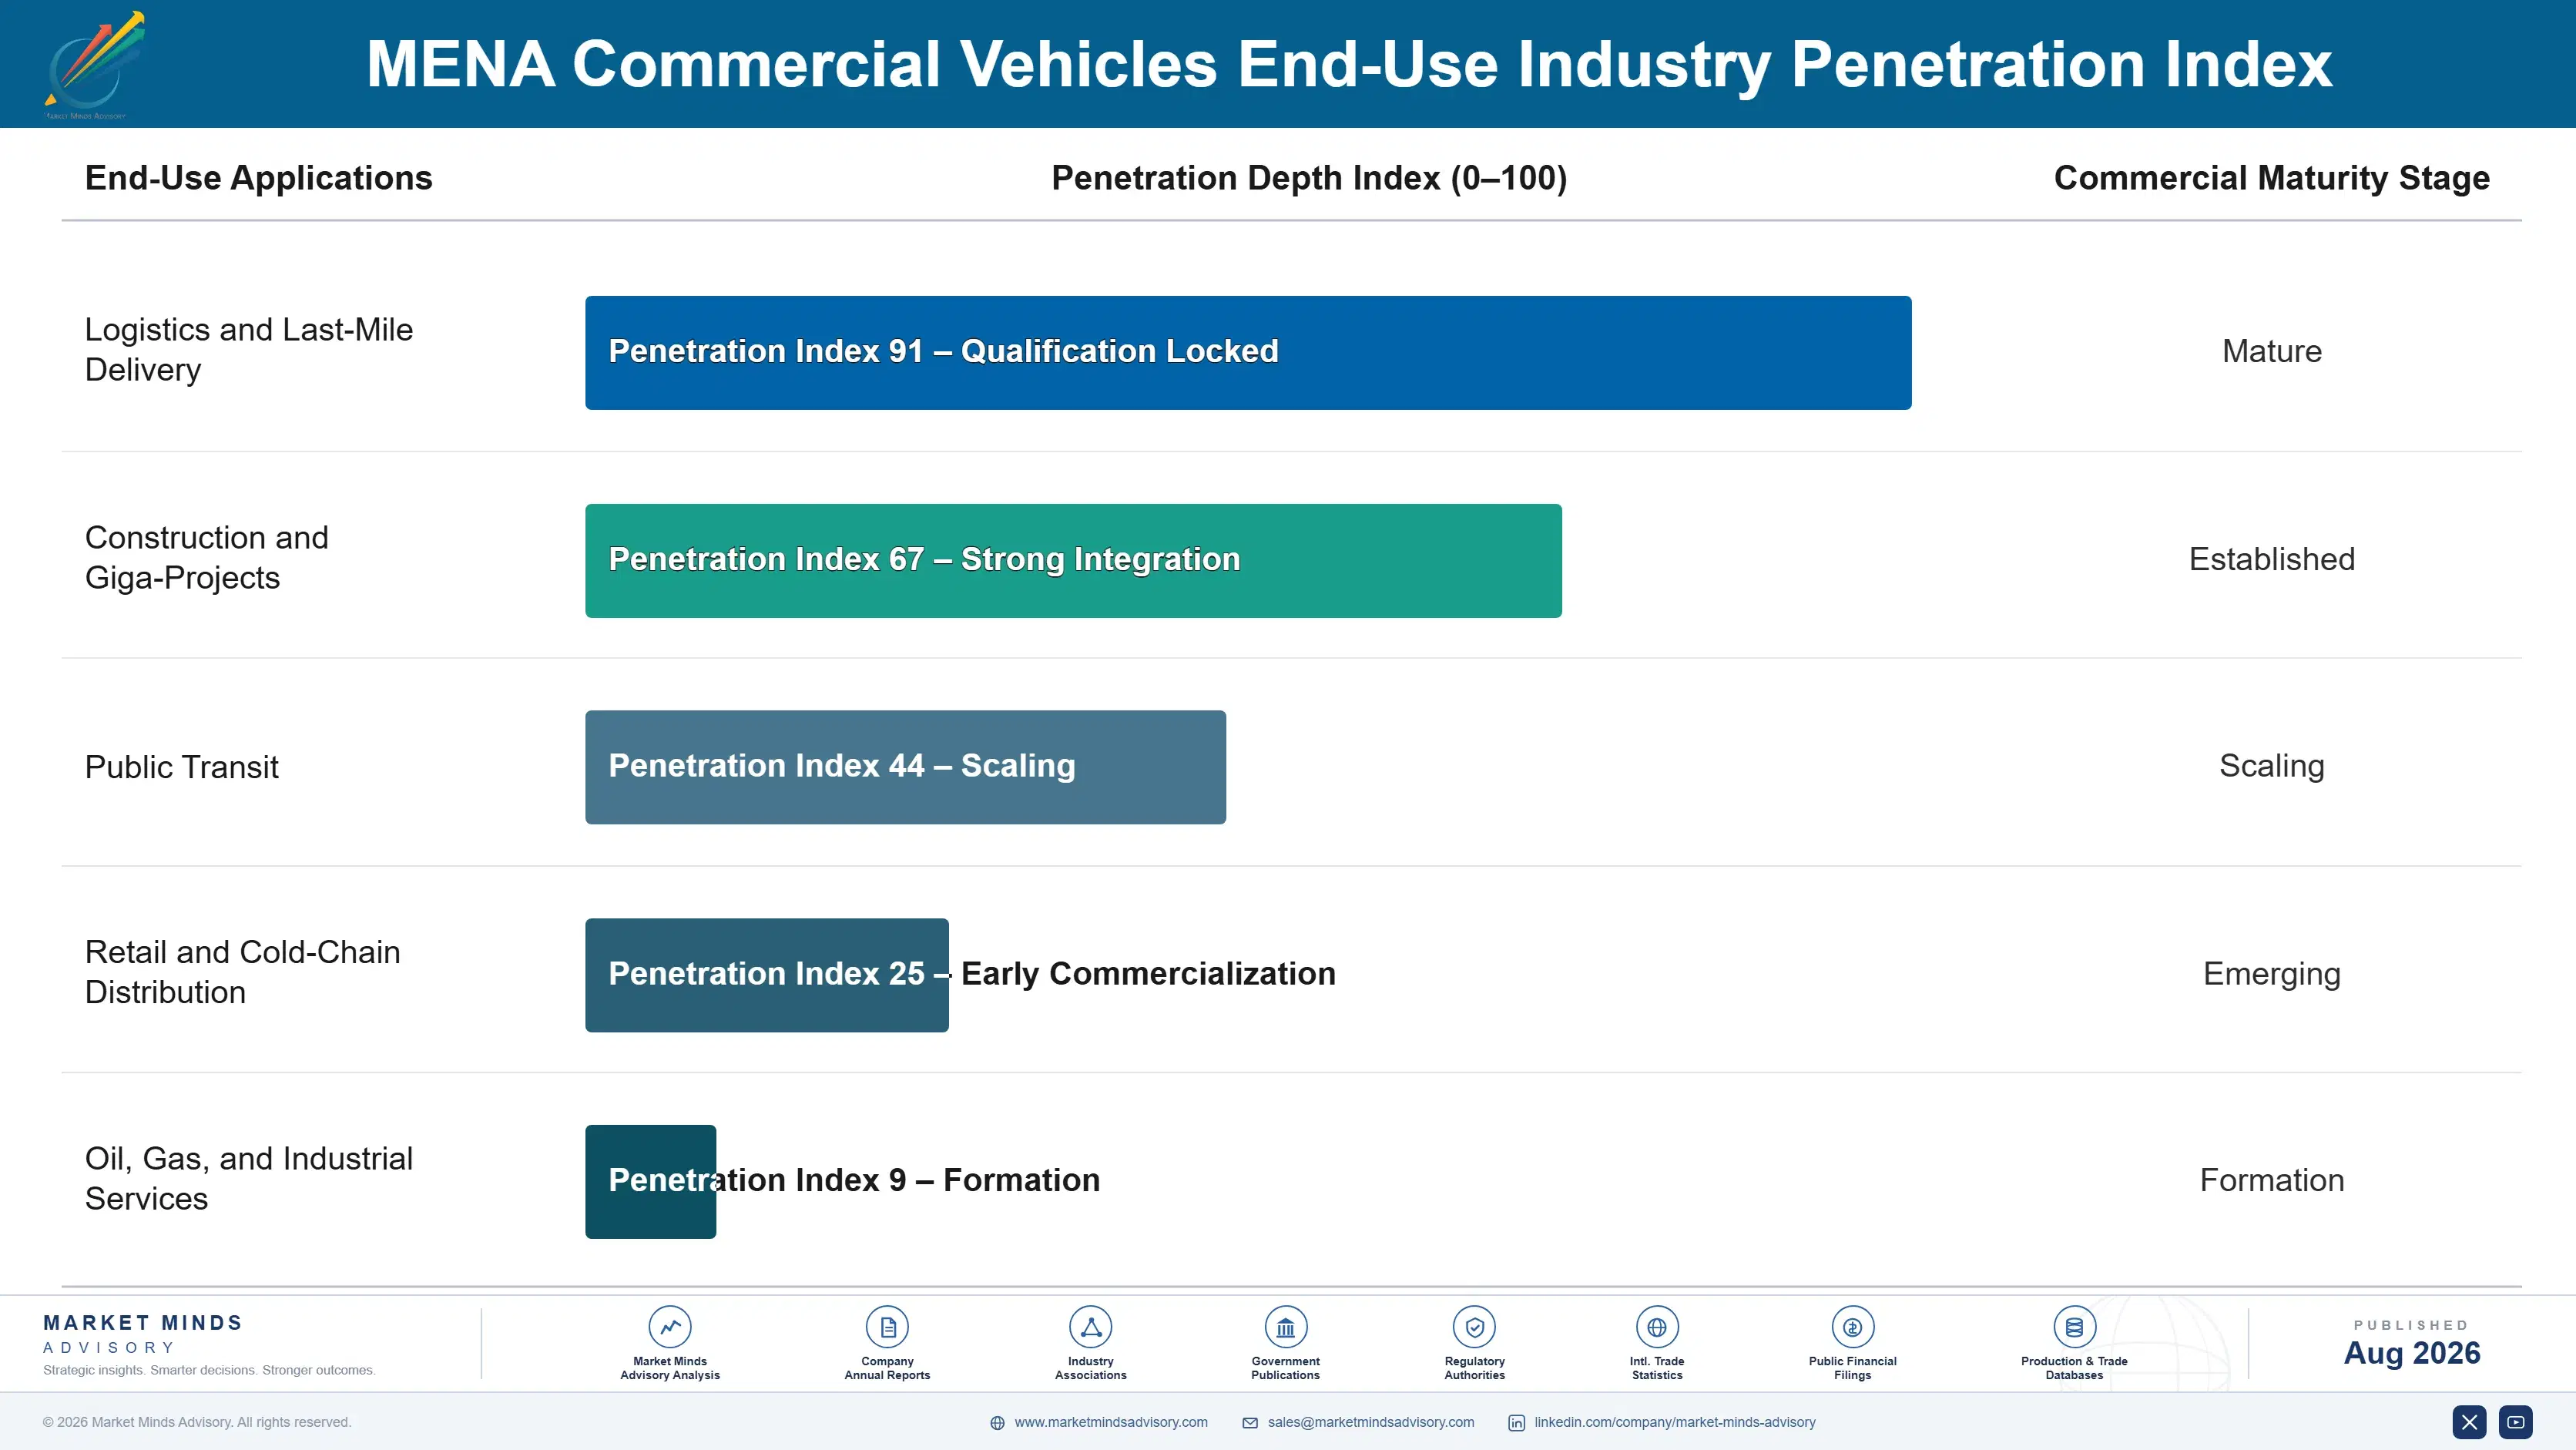
Demand here runs on multi-year fleet procurement contracts rather than individual vehicle sales for the majority of commercial volume, since large logistics, construction, and government fleet buyers need financing and service certainty locked in well before deployment begins. Contract renewal typically comes up every seven to nine years, tracking the standard commercial vehicle replacement cycle across most fleet operators.
Adoption depth varies sharply by end-use vertical. Giga-project contractors show the strongest switching cost once a manufacturer's technical and logistics team is embedded near a project site, while e-commerce and last-mile delivery fleets switch more readily based on financing terms and total cost of ownership alone. Government transit authorities sit closest to giga-project buyers, valuing long-term charging infrastructure and service partnerships over simple vehicle price.

Buyer profiles have shifted generationally as procurement moved from relationship-driven dealer purchasing toward data-driven fleet management decisions across most large accounts. Younger fleet managers now weigh total cost of ownership and telematics integration alongside brand reputation, a shift that favours manufacturers offering integrated financing and technology over those competing purely on badge prestige. That shift now shapes tender scoring criteria as much as it shapes brand perception among buyers.
mena-commercial-vehicles-market-trends-end-use-penetration-index-1787555113883

Where Fleet Financing Decides Outcomes

These are among the four positions where our research anticipates prominent divergence between winners and laggards over the coming forecast period. Each is grounded in the demand model, the regulatory perimeter, and the announced capacity pipeline.
01 / CHINESE OEM DISPLACEMENT RISK

Price and financing will keep eroding European incumbent share

European heavy truck brands built their MENA position over decades of fleet operator trust, and that reputation advantage will not protect share indefinitely against Chinese OEMs offering comparable specification at meaningfully lower total cost of ownership. The shift already visible in recent Egyptian and Saudi fleet tenders reflects financing and price rather than any genuine quality gap that once separated the two groups clearly. Expect continued share migration toward Chinese and Indian manufacturers unless European incumbents match localisation and financing investment directly.
02 / GIGA-PROJECT CONTRACT CAPTURE

Early technical presence near project sites will lock in vocational share

Saudi giga-project contractors procure vocational vehicles through multi-year relationships rather than standard dealer transactions, and manufacturers embedding technical and logistics staff near major project sites early capture disproportionate share of this large, visible demand pipeline. Later entrants will find these relationships considerably harder to displace once established, since switching mid-project carries real operational risk for contractors, and later bidders typically face higher qualification hurdles once a project's technical standards are already set. Expect the manufacturers already present at NEOM and the Red Sea Project to consolidate their advantage further as additional giga-projects reach construction phase.
03 / GULF TRANSIT ELECTRIFICATION

Early electric bus wins will compound into broader mobility relationships

Gulf transit authorities are awarding electric bus contracts years ahead of most emerging markets, and manufacturers building charging infrastructure partnerships alongside vehicle sales are securing relationships that extend well beyond the initial contract into maintenance and future fleet expansion. This head start matters because transit authorities rarely switch charging-dependent suppliers once infrastructure is installed and staff are trained on a specific system. Expect Mercedes-Benz, BYD, and Yutong to keep extending their current transit relationships into adjacent Gulf cities over the coming years.
04 / CURRENCY EXPOSURE DIVERGENCE

Dollar-pegged and floating-currency markets will diverge further

Gulf fleet buyers in dollar-pegged currencies have avoided the currency shocks that hit Egyptian and other floating-currency markets directly, and that divergence in landed cost stability will keep shaping where manufacturers prioritise CKD assembly investment going forward. Markets without local assembly and without a pegged currency face a widening cost disadvantage that pure product competitiveness cannot offset on its own, and that gap will keep widening until floating-currency markets find a durable way to hedge import cost. Expect continued manufacturer investment concentrating in Gulf assembly over floating-currency North African markets unless devaluation risk eases meaningfully.

Engagement Snapshot From the Field

A live engagement with an industry participant carrying material or product regulatory and market exposure ahead of a defining policy shift, showing how our research translates into a defensible multi-year portfolio strategy.
MARKET MINDS ADVISORY · CLIENT ENGAGEMENT SUMMARY
MENA Commercial Vehicles Producer Strategic Portfolio Review and Transition Roadmap 2026·Investment Scenario on MENA Commercial Vehicles Exposure Evaluation 2025-26
CLIENT PROFILE
A regional logistics operator running last-mile delivery fleets across Egypt and Saudi Arabia approached MMA after Egyptian pound devaluation sharply raised its vehicle replacement budget mid-cycle. The client reported an annual fleet replacement budget near USD 85 million, with roughly 70% of its light commercial vehicle fleet sourced from a single European manufacturer prior to the disruption (client-reported, unverified by MMA).
STRATEGIC CHALLENGE
Management needed to rebuild its fleet sourcing strategy after currency devaluation made its existing European-heavy procurement plan unaffordable, while maintaining delivery service levels across two very different currency environments. The procurement team wanted to shift quickly toward lower-cost alternatives, while operations worried that switching brands mid-fleet would create maintenance and parts availability problems across its existing depot network.
MMA APPROACH
MMA benchmarked total cost of ownership across Chinese, Indian, and European light commercial vehicle options specifically for the client's Egyptian and Saudi operating environments, incorporating currency exposure, financing terms, and regional parts availability into the comparison. We also assessed CKD-assembled alternatives that would reduce the client's dollar-denominated exposure directly rather than simply switching brands within the same import-dependent structure.
KEY FINDINGS
  1. The client's single-brand European sourcing concentrated more than 70% of its currency exposure in one manufacturer relationship, a risk considerably larger than management had previously recognised (client-reported, unverified by MMA).
  2. Chinese and Indian alternatives matched the client's technical specification requirements closely enough that parts and maintenance risk proved smaller than operations had originally feared.
  3. CKD-assembled vehicles from Saudi facilities reduced dollar-denominated exposure meaningfully compared with fully imported alternatives from any origin. reducing the client's projected currency exposure meaningfully within a single fleet cycle.
  4. A blended three-origin fleet strategy would have avoided most of the recent currency-driven budget overrun without requiring a full brand switch. while preserving service continuity across the client's existing depot network.
CLIENT PROFILE
A regional logistics operator running last-mile delivery fleets across Egypt and Saudi Arabia approached MMA after Egyptian pound devaluation sharply raised its vehicle replacement budget mid-cycle. The client reported an annual fleet replacement budget near USD 85 million, with roughly 70% of its light commercial vehicle fleet sourced from a single European manufacturer prior to the disruption (client-reported, unverified by MMA).
STRATEGIC CHALLENGE
Management needed to rebuild its fleet sourcing strategy after currency devaluation made its existing European-heavy procurement plan unaffordable, while maintaining delivery service levels across two very different currency environments. The procurement team wanted to shift quickly toward lower-cost alternatives, while operations worried that switching brands mid-fleet would create maintenance and parts availability problems across its existing depot network.
MMA APPROACH
MMA benchmarked total cost of ownership across Chinese, Indian, and European light commercial vehicle options specifically for the client's Egyptian and Saudi operating environments, incorporating currency exposure, financing terms, and regional parts availability into the comparison. We also assessed CKD-assembled alternatives that would reduce the client's dollar-denominated exposure directly rather than simply switching brands within the same import-dependent structure.
KEY FINDINGS
  1. The client's single-brand European sourcing concentrated more than 70% of its currency exposure in one manufacturer relationship, a risk considerably larger than management had previously recognised (client-reported, unverified by MMA).
  2. Chinese and Indian alternatives matched the client's technical specification requirements closely enough that parts and maintenance risk proved smaller than operations had originally feared.
  3. CKD-assembled vehicles from Saudi facilities reduced dollar-denominated exposure meaningfully compared with fully imported alternatives from any origin. reducing the client's projected currency exposure meaningfully within a single fleet cycle.
  4. A blended three-origin fleet strategy would have avoided most of the recent currency-driven budget overrun without requiring a full brand switch. while preserving service continuity across the client's existing depot network.
RECOMMENDED STRATEGY
Phase 1: Phase 1 (0 to 6 months): Qualify Chinese and Indian alternatives in parallel while maintaining existing depot parts inventory unchanged. Phase 2: Phase 2 (6 to 18 months): Shift 40% of new fleet orders toward CKD-assembled and diversified-origin vehicles across both markets. Phase 3: Phase 3 (18 to 36 months): Formalise a three-origin sourcing model with currency-matched financing terms for each specific market. Review terms annually against realised currency movement.
OUTCOME
The client completed diversified sourcing qualification within one replacement cycle and reduced projected currency exposure by roughly 35% across its combined Egyptian and Saudi fleets. The revised strategy also secured a reported three-year fleet financing agreement worth USD 22 million from a regional bank partner (client-reported, unverified by MMA).

Frequently Asked Questions

Foundational context covering the market sizes, CAGR, scope, country, region and competition that inform every finding below. This section is provided to cover basics and most often pre-purchase conversations, answered from the MMA Primary Research Dataset.

What is the current size of the MENA Commercial Vehicles Market?

The MENA commercial vehicles market reached USD 18.6 billion in 2025. This figure covers new light and heavy commercial vehicle sales across the Middle East and North Africa.

How large will the MENA Commercial Vehicles Market be by 2036?

The market is projected to reach USD 33.87 billion by 2036 under the base case scenario. That represents a 1.72 times expansion over the 2026 starting value.

What is the CAGR for the MENA Commercial Vehicles Market 2026 to 2036?

The base case CAGR is 5.6%, with a bull case of 6.8% and a bear case of 4.4%. Giga-project timing and currency stability drive most of the variance between scenarios.

Which segment is growing fastest?

Electric and alternative-fuel commercial vehicles grow fastest at 11.8% CAGR, about 2.11 times the overall market rate. Gulf transit authority bus electrification programmes drive this growth directly.

Who are the major companies in the MENA Commercial Vehicles Market?

Leading manufacturers include Mercedes-Benz Trucks, Tata Motors, Sinotruk, Isuzu Motors, and Volvo Group. These five hold roughly 34% combined market share on a unit sales basis.

Which country is growing fastest?

Saudi Arabia posts the fastest national growth at 9.5% CAGR, driven directly by Vision 2030 giga-project construction demand. Heavy truck and vocational vehicle orders anchor most of this growth.

Report Segmentation Architecture

The full report scope spans multiple orthogonal segmentation dimensions, with cross-tabulated demand data provided for each dimension pair. Coverage extends further to regional breakdowns, trend trajectories, and the competitive detail needed to support segment-level decision-making.

By Vehicle Type

  • Light Commercial Vehicles
  • Medium and Heavy Trucks
  • Buses and Coaches
  • Construction and Vocational Vehicles
  • Refrigerated and Specialized Vehicles
  • Electric and Alternative-Fuel Commercial Vehicles

By End-Use Industry

  • Logistics and Last-Mile Delivery
  • Construction and Giga-Projects
  • Public Transit
  • Retail and Cold-Chain Distribution
  • Oil, Gas, and Industrial Services

By Commercial Dimension

  • Direct Fleet Procurement
  • Dealer and Distributor Channel
  • Government Tender Sales
  • Leasing and Fleet Financing

By Region

  • North America
  • Western Europe
  • East Asia
  • South Asia and Pacific
  • Latin America
  • Middle East and Africa
  • Eastern Europe

Scope, Methodology, and Coverage

Every figure in this report is reproducible from documented input assumptions. The scope below maps the historical period, the forecast horizon, the segmentation dimensions, and the countries covered, alongside the underlying primary and qualitative methodology.
Historical Period
2020 to 2025
Forecast Period
2026 to 2036
Base Year
2025 (USD billions; MMA Primary Research Dataset, August 2026)
Market Definition
This market comprises new commercial vehicle sales across the Middle East and North Africa, spanning light commercial vehicles, medium and heavy trucks, buses and coaches, and specialized vocational vehicles. Used vehicle resale, passenger cars, and aftermarket parts and service revenue are excluded from this scope.
Quantitative Units
USD billions (current prices); vehicle units sold where applicable
Segmentation Dimensions
By Vehicle Type; By End-Use Industry; By Commercial Dimension; By Region
Regions Covered
North America, Western Europe, East Asia, South Asia and Pacific, Latin America, Middle East and Africa, Eastern Europe
Countries Covered
USA, China, Germany, France, UK, Japan, South Korea, India, Australia, Canada, Brazil, Mexico, Indonesia, Vietnam, Thailand, Malaysia, UAE, Saudi Arabia, South Africa, Nigeria, Turkey, Poland, Netherlands, Italy, Spain, Sweden, Switzerland, Argentina, Colombia, Singapore, and additional markets relevant to this sector
Key Companies Profiled
Mercedes-Benz Trucks, Tata Motors, Sinotruk, Isuzu Motors, Volvo Group, MAN Truck and Bus, Scania, IVECO Group, Ashok Leyland, Ford Motor Company, Toyota Motor Corporation, Hyundai Motor Company, Dongfeng Motor Corporation, FAW Group, JAC Motors, Hino Motors, Mitsubishi Fuso Truck and Bus Corporation, King Long United Automotive, Ford Otosan, GB Auto
Quantitative Methodology
Primary survey, n=3,800 respondents, Q4 2025, six countries; demand-side model with trade association cross-validation
Qualitative Methodology
47 expert interviews, Q4 2025; applied to validate demand model assumptions, identify emerging dynamics, and assess competitive positioning
Report Format
PDF and XLSX data workbook (Word format preview document)
Publisher
Market Minds Advisory
Report Code
MMA-2026-AUT-312
Published
August 2026
Contact
sales@marketmindsadvisory.com | www.marketmindsadvisory.com

Purchase the full MENA Commercial Vehicles Market Report (2026 to 2036).

The full MMA MENA Commercial Vehicles report sizes the market across six vehicle type segments, five end-use industries, four commercial channels, and seven origin regions through 2036. It profiles twenty manufacturers on a consistent basis of new MENA unit sales, scoring each on CKD localisation, financing competitiveness, and electric transit readiness. Scenario models quantify how Saudi giga-project timing, Chinese OEM expansion, and currency volatility move both demand and realised pricing. The report also includes delivered-cost modelling by origin, a currency exposure screen by market, and giga-project vocational vehicle demand detail built for procurement, strategy, and investment teams.
Six-segment vehicle type demand breakdown detail
Origin-by-origin delivered-cost bridge model
Currency exposure screening by market segment
Manufacturer localisation benchmarking data review
Giga-project vocational demand pipeline mapping detail
Electric transit readiness scoring framework detail

Built For The People Who Decide

From boardroom strategy to bench-side execution, this report is read cover-to-cover by leaders shaping the next decade of their industry, turning demand scenarios, market dynamics and valuation benchmarks into decisions.
CXOs/ Presidents/ VPs/ Managers
M&A and Corporate Development
Strategy Teams and R&D Heads
Procurement and Product Directors
Regulatory and Compliance Leaders
Investor Relations and Equity Analysts