
Market Minds Advisory
Mechanical Performance Tuning Components Market

Mechanical Performance Tuning Components Market: Certification Barriers, Electrification Survival and Track Demand to 2036     

Regulators stopped ignoring this industry and started prosecuting it, and the cost of certifying a part for legal road use is quietly consolidating a business that was famously impossible to consolidate.

Lead Analyst

David Horsley

Published

September 2026

Make Smarter Decisions with Customized Research Insights

Request a free sample report and evaluate market opportunities, growth trends, and competitive dynamics relevant to your business needs.

2025 MARKET VALUE$24.6BMarket Size 2025
2036 FORECAST VALUE$45.7BBase Case , 2026 to 2036
CAGR 2026 TO 20365.8 %Bull 7.0% / Bear 4.6%
INCREMENTAL OPPORTUNITY$19.7BNet 10- year value creation
EXPANSION MULTIPLE1.76x2036 value over 2026 base
Strategic Levers
M&A Pipeline
Regional Outlook
Country Rankings
Competitive Intelligence
Segmental Deep-dive
Call-Us : 91 93563 13602

Executive Snapshot and Market Trajectory

Certifying one component for legal road use costs around 42,000 dollars, and a supplier with four hundred catalogue lines cannot certify them all. That single arithmetic is consolidating an industry that resisted consolidation for fifty years, and it is doing so faster than any acquisition strategy managed.
Electronic control and calibration hardware grows at 8.7%, half again the market rate of 5.8%, because software-defined performance works on combustion and electric vehicles alike while exhaust and intake products work on neither. North America holds 32% of value on a modification culture nothing elsewhere matches. Only about 38% of catalogue product currently holds road use approval. Distributors increasingly refuse to stock the rest, which settles the question for everybody. That gate is new.
Five manufacturers hold just 19% of component supply, which makes this among the most fragmented markets in automotive anywhere. The problem nobody wants to size properly is that roughly 40% of the traditional parts basket survives electrification by value. Suppliers built around exhaust, intake, forced induction and engine internals are watching the other 60% disappear on a timetable regulation set for them. That timetable is published.
Market Definition
This report covers aftermarket components sold to modify vehicle performance beyond original specification, spanning intake and exhaust systems, forced induction components, suspension and chassis components, braking system upgrades, engine internal components, and electronic control and calibration hardware. Value is measured at manufacturer level. Excluded are original equipment supply, routine replacement and service parts, cosmetic and appearance products without performance function, tyres, and complete vehicle conversions.
Base Year Value
$24.6B in 2025 (MMA Primary Research Dataset, August 2026)
Forecast Period
2026 to 2036, eleven discrete annual values
CAGR
5.8% base case. Bull 7.0%. Bear 4.6%.
Fastest Growth Segment
Electronic Control and Calibration Hardware: 8.7% CAGR
Fastest Growth Country
China: 9.4% CAGR
Fastest Growth Region
South Asia and Pacific: 8.0% CAGR
Largest Region
North America: 32% of 2025 global value
Market Leaders
Holley Performance Brands, Edelbrock Group, Tenneco, Brembo and KW Automotive lead the market. Source: MMA Primary Research Dataset, July 2026.
Primary Survey
n=3,800 procurement and R&D decision-makers, Q4 2025, six countries
Methodology
Demand-side build-up, cross-validated against public data, 47 expert interviews

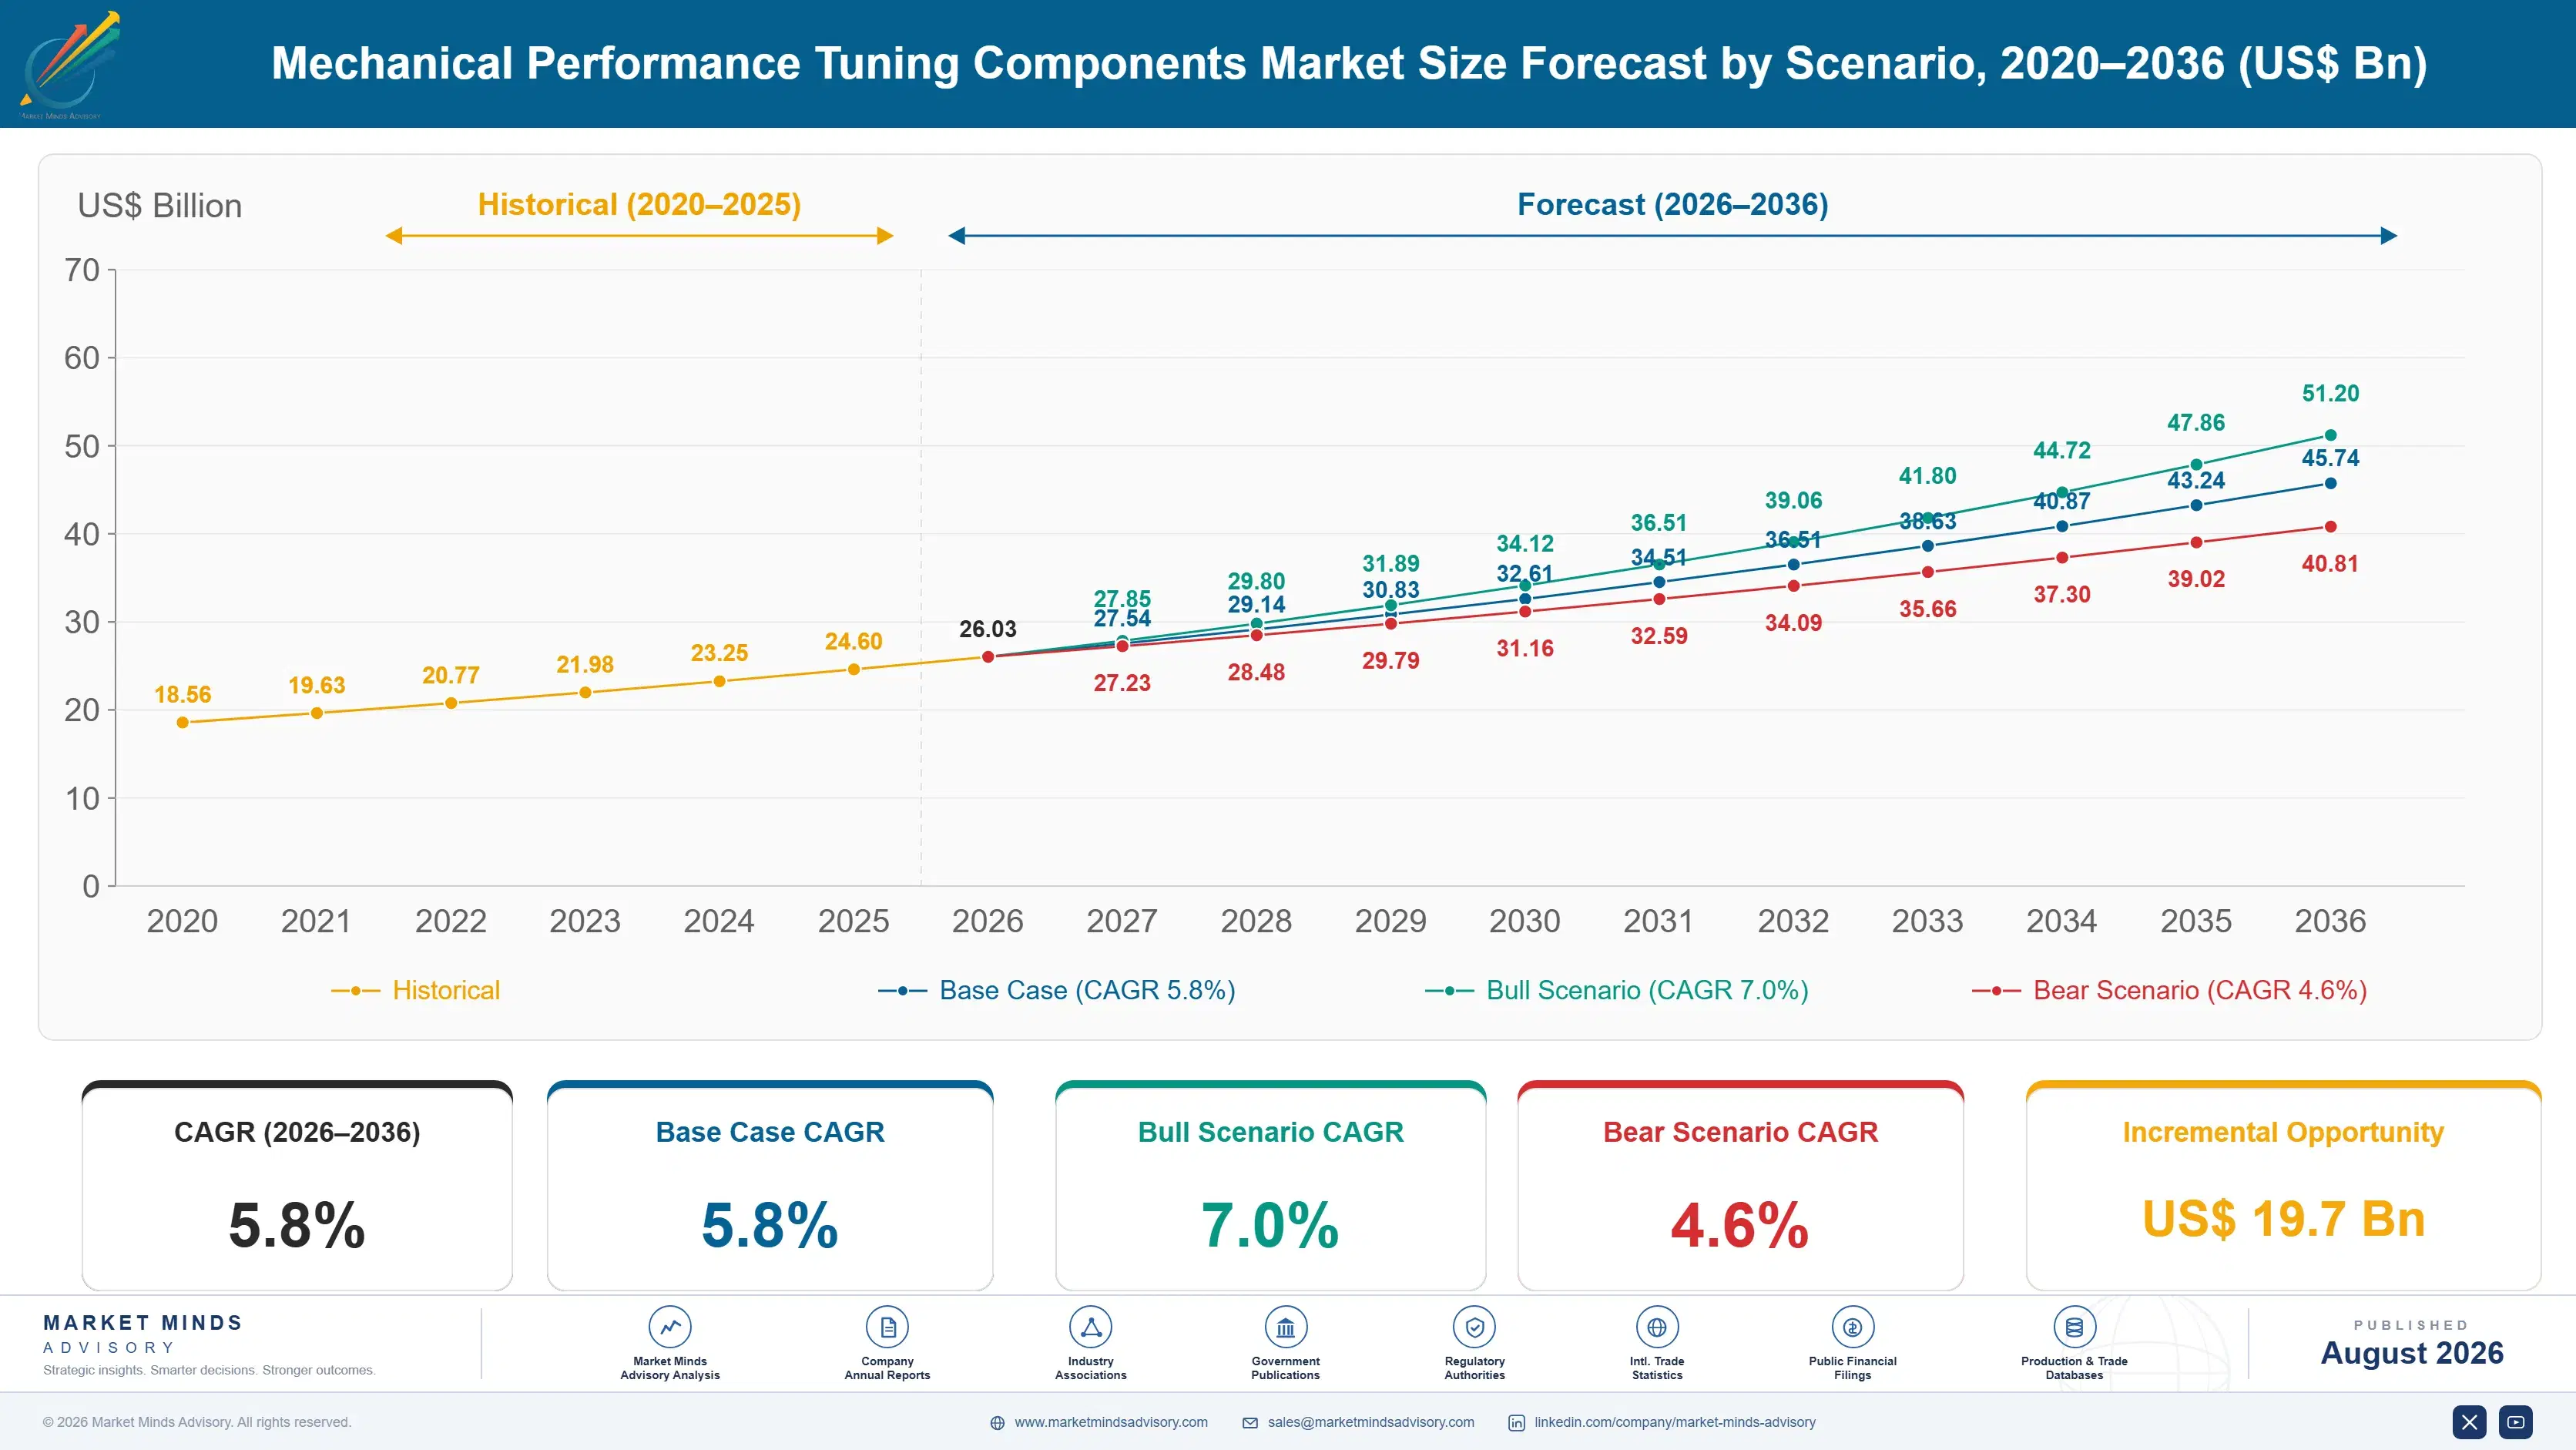
Mechanical Performance Tuning Components Market Forecast Scenarios

mechanical-performance-tuning-components-market-size-forecast-scenario-1787555479185
Growth ran at 4.8% between 2020 and 2025 and enforcement dominated the period more than demand did. Lockdown project spending lifted the category sharply through 2020 and 2021 as people worked on cars instead of travelling. Regulatory enforcement against defeat devices then removed product lines and imposed penalties across several suppliers, which cut catalogue breadth and forced certification investment nobody had budgeted for.
The 5.8% base case rests on three mechanisms. Certification investment keeps converting grey-area product into legally saleable inventory, which raises price and expands the addressable geography for anybody who funds it. Suspension, braking and calibration demand keeps growing on track day participation rising around 11% annually and on categories that survive electrification. And Chinese modification rule relaxation keeps opening a vehicle population larger than any other market holds. That population dwarfs everything else.
The 7.0% bull case is track and amateur motorsport participation continuing to compound, since those buyers purchase brakes, suspension and cooling that face no emissions exposure at all. The 4.6% bear case is electrification reaching mainstream enthusiast vehicles faster than expected, which removes 60% of the traditional parts basket before suppliers have rebuilt catalogues around what remains.

When Enforcement Arrived

This industry operated for decades in a regulatory space nobody enforced, selling parts that improved performance and quietly compromised emissions control, with a disclaimer about off-road use doing the legal work. Enforcement changed that abruptly rather than gradually. Penalties reaching several times the revenue earned on affected lines removed products from catalogues across the industry and made continued sale a balance sheet question rather than a compliance one. Suppliers who treated the disclaimer as protection discovered it was not.
TOP-FIVE CONCENTRATION19%Combined position across performance component supply held by leaders
EMISSIONS CERTIFIED PRODUCT SHARE38%Portion of catalogue holding regulatory approval for road use
CERTIFICATION COST PER PART$42,000Typical expense of obtaining road use approval for one component
ELECTRIC VEHICLE BASKET SHARE40%Portion of traditional part categories that survive electrification
ENFORCEMENT PENALTY EXPOSURE3.5xHow far penalties exceed revenue on non-compliant product lines
TRACK DAY PARTICIPATION GROWTH11%Annual increase in amateur circuit driving event attendance
What replaced it is certification, and the arithmetic is quietly transformative. Obtaining road use approval for a single component costs around 42,000 dollars, which is affordable for a part selling in volume and impossible for one selling in dozens. A supplier with four hundred catalogue lines built over thirty years cannot certify them and must choose. That is consolidating a market with a top five share of only 19%, and it is doing so through cost rather than through any acquisition anybody planned.
Electrification is the larger problem and receives less attention. Roughly 40% of the traditional parts basket survives by value: suspension, brakes, wheels, aerodynamics and software. Exhaust, intake, forced induction and engine internals do not survive at all.
"Everybody in this industry spent forty years arguing that regulators would never come after the aftermarket, and then they did, and the fine was bigger than the product line was worth. Certification cost is now doing what no private equity roll-up ever managed."
Director, Automotive Aftermarket and Specialty Equipment Practice · MMA Automotive Practice · August 2026

Market Trends

Certification cost consolidates a famously fragmented industry

Obtaining road use approval for one component costs around 42,000 dollars, which is trivial against a part selling thousands of units annually and prohibitive against one selling forty. Suppliers with catalogues built across decades of low-volume niche parts must now decide which lines justify the expense, and most of the catalogue does not. That converts breadth from an asset into a liability almost overnight. Concentration at only 19% among the top five has resisted every consolidation attempt for fifty years, and certification economics are achieving through cost what no acquisition strategy ever managed to accomplish.
Market Impact: Participation rises 11% annually
Software-defined performance survives what hardware does not

Calibration and control hardware works on combustion engines, hybrids and electric vehicles alike, since every one of them is governed by software that determines power delivery, torque distribution and response. Exhaust, intake and forced induction products work on exactly one of those and nothing else. Growth at 8.7% follows that survivability as much as any current demand, since suppliers and buyers alike can see which categories have a future. The complication is that calibration is also where enforcement concentrates, because a map that defeats emissions control is precisely what regulators prosecute rather than tolerate.
Market Impact: Delivers 9.4% Chinese growth

Market Opportunities and Growth Drivers

Track participation grows demand immune to emissions rules

Amateur circuit driving and track day attendance is rising around 11% annually across North America, Europe and increasingly Asia, and those participants buy brakes, suspension, cooling and tyres rather than anything that touches an emissions system. That demand faces no certification requirement, no enforcement exposure and no electrification threat, since an electric track car needs better brakes and cooling than a combustion one does. It is also a genuinely different customer, buying on lap time and consumable durability rather than on street presence. Suppliers organised around street modification frequently miss it entirely.
Market Impact: Removes 60% of category basket

Chinese modification rules opened the largest vehicle population

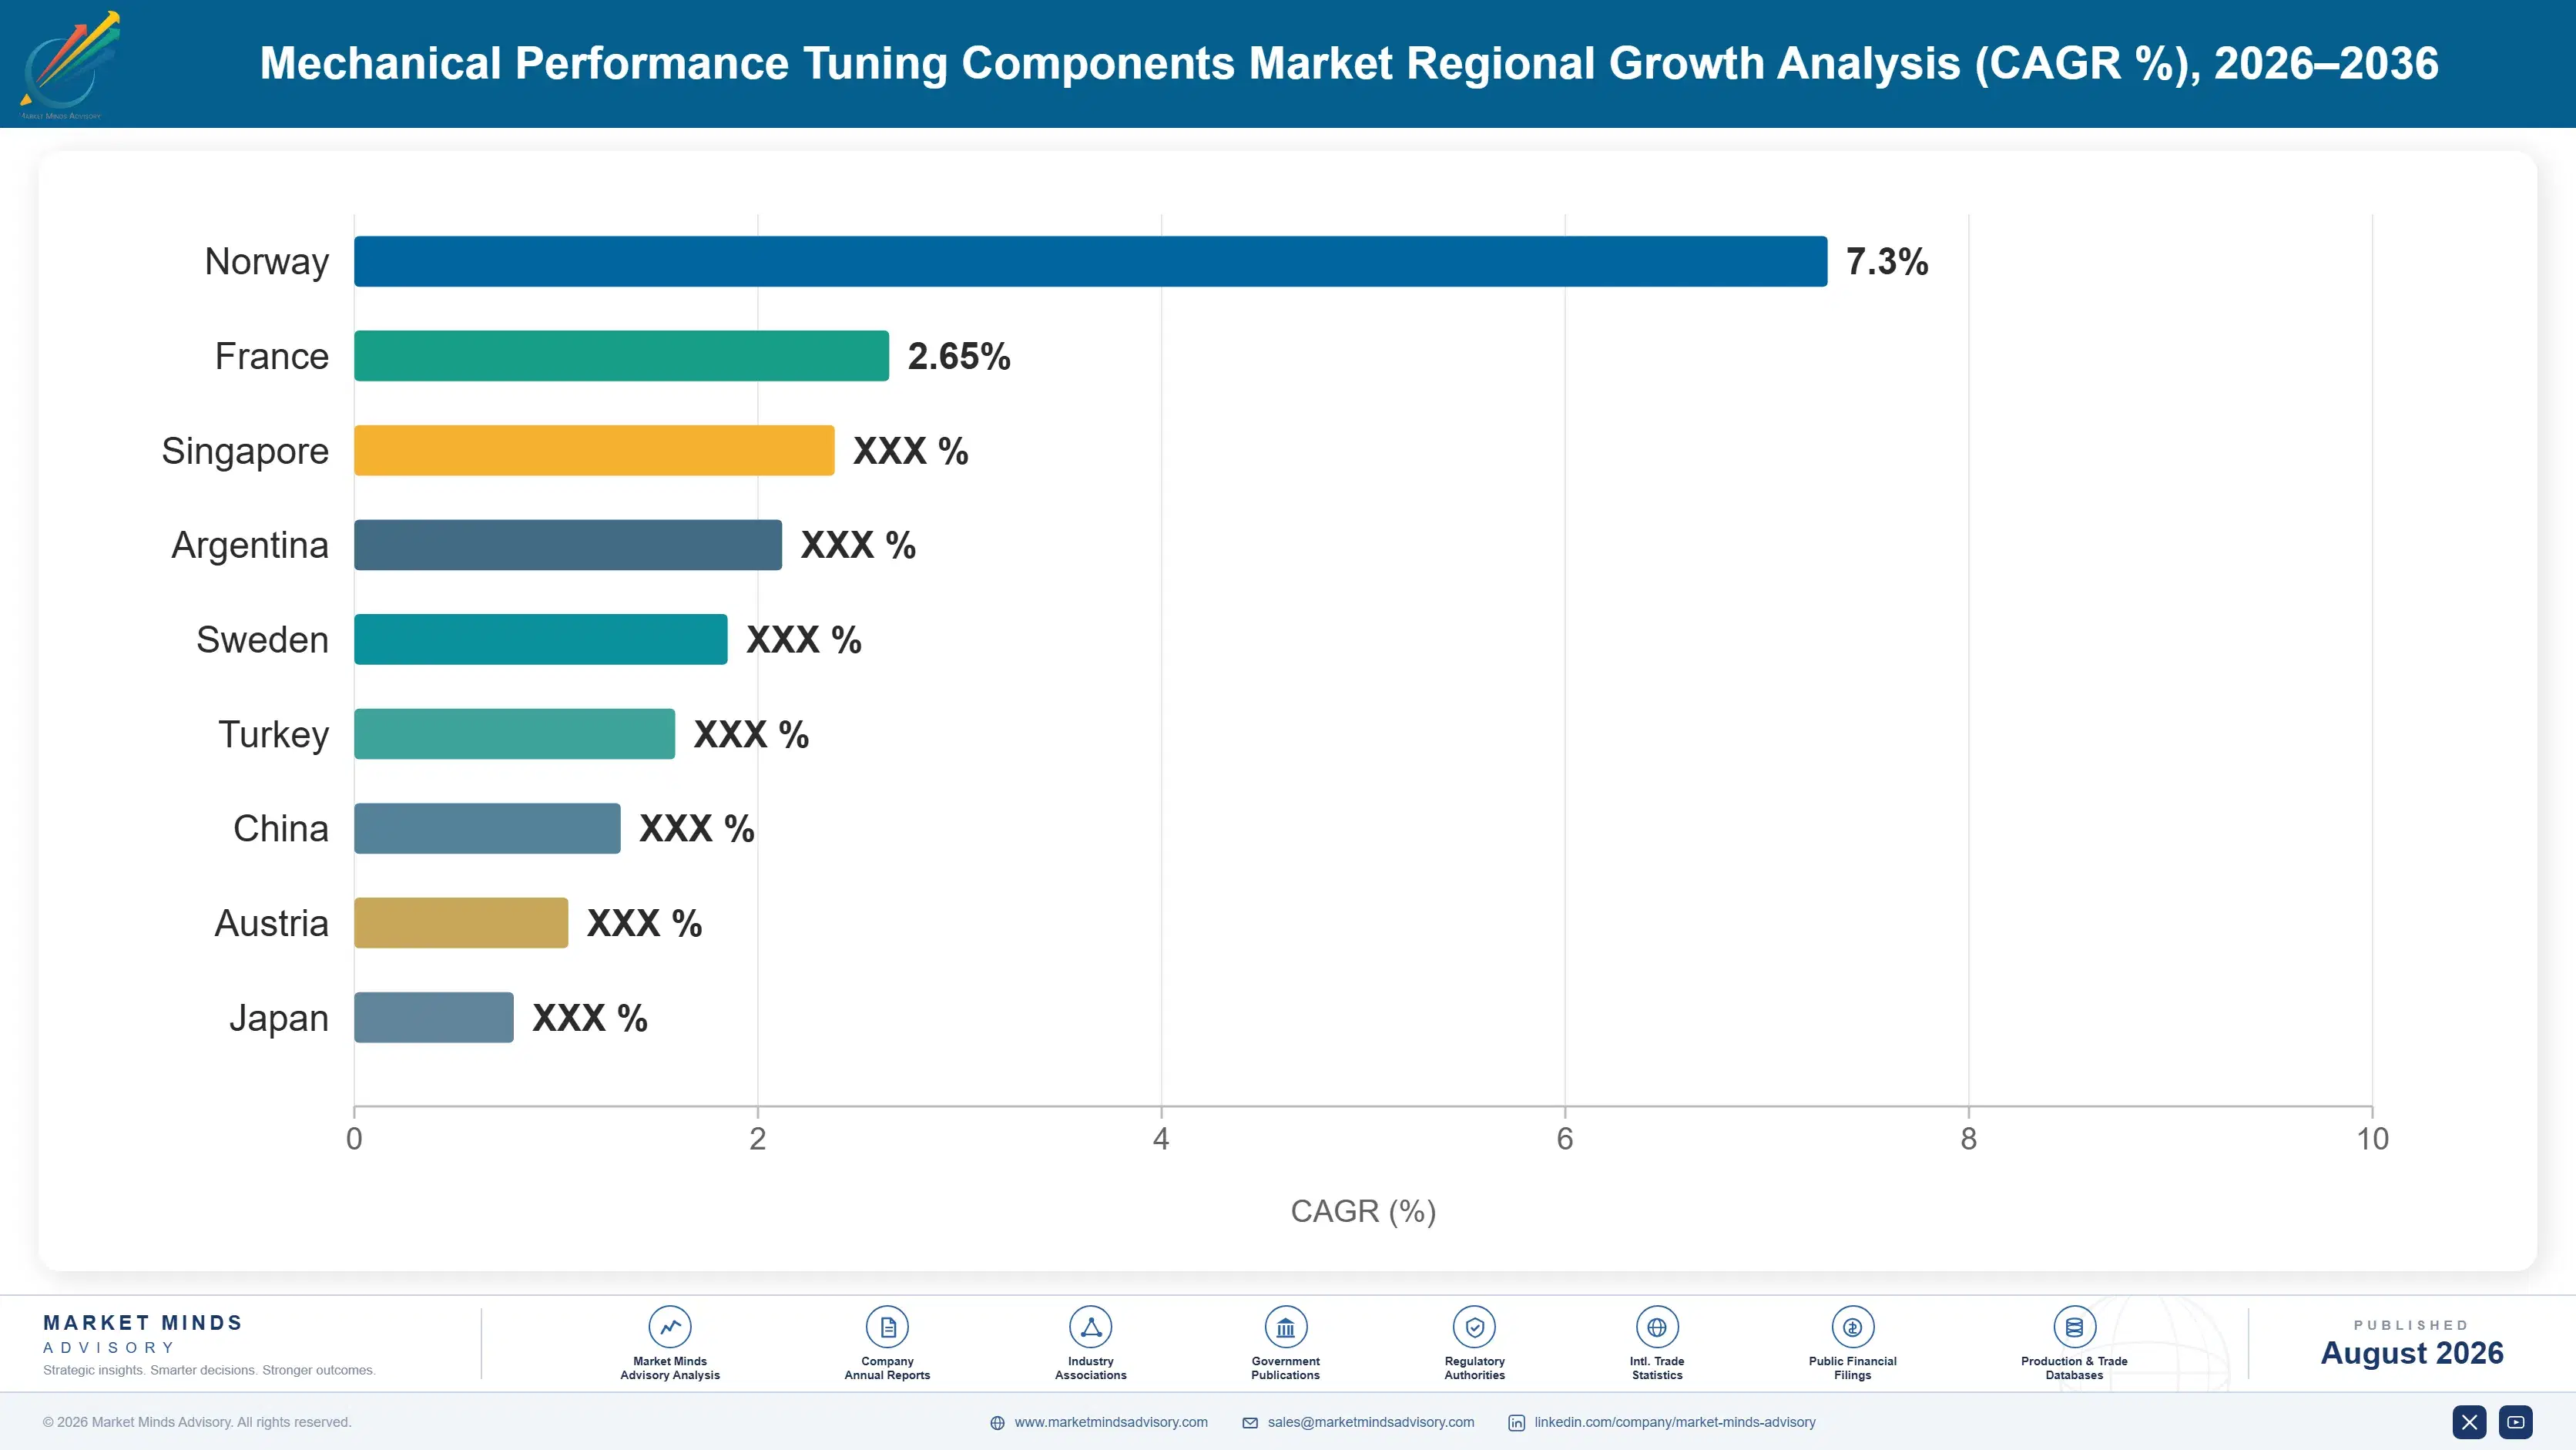
China relaxed restrictions on vehicle modification, permitting categories of change that were previously prohibited outright, and it did so across a vehicle population larger than any other market holds. Domestic enthusiast culture had developed regardless of legality and now has a legitimate channel to buy through. Growth at 9.4% is the fastest of any country on this table and comes from a base that barely registered five years ago. Domestic manufacturers have moved quickly and international suppliers have mostly not, which is leaving a very large opportunity to companies with no export ambitions whatever.
Market Impact: Penalties reach 3.5 times revenue

Market Restraints and Challenges

Electrification removes most of the traditional parts basket

Roughly 40% of traditional performance categories survive electrification by value, meaning suspension, brakes, wheels, aerodynamics and software, while exhaust, intake, forced induction and engine internals do not survive in any form. The root cause is that most of this industry sold products modifying an air and fuel process that electric vehicles simply do not have. Commercially this is existential for suppliers concentrated in the disappearing categories and largely irrelevant for chassis specialists. Suppliers are responding by acquiring suspension and brake capability, moving into calibration, or concentrating on the classic and restoration market where electrification never arrives.
Market Impact: Costs 42,000 dollars per part

Enforcement penalties exceed the revenue at stake

Regulatory penalties on non-compliant product lines have reached roughly 3.5 times the revenue those lines generated, which converts a compliance question into a solvency one for smaller suppliers. The root cause is that penalty structures scale with vehicles affected rather than with parts sold, so a cheap component fitted to many vehicles generates exposure far beyond its commercial contribution. Commercially this has removed product lines across the industry and made distributors refuse inventory they previously stocked freely. Suppliers are responding by certifying what they can and discontinuing what they cannot rather than continuing to sell it.
Market Impact: Segment compounds at 8.7% annually
3 additional market trends, 4 additional growth drivers, and 2 additional restraints and challenges are covered in the full report. Contact sales@marketmindsadvisory.com to access the complete intelligence.

Segment CAGR and Growth Architecture

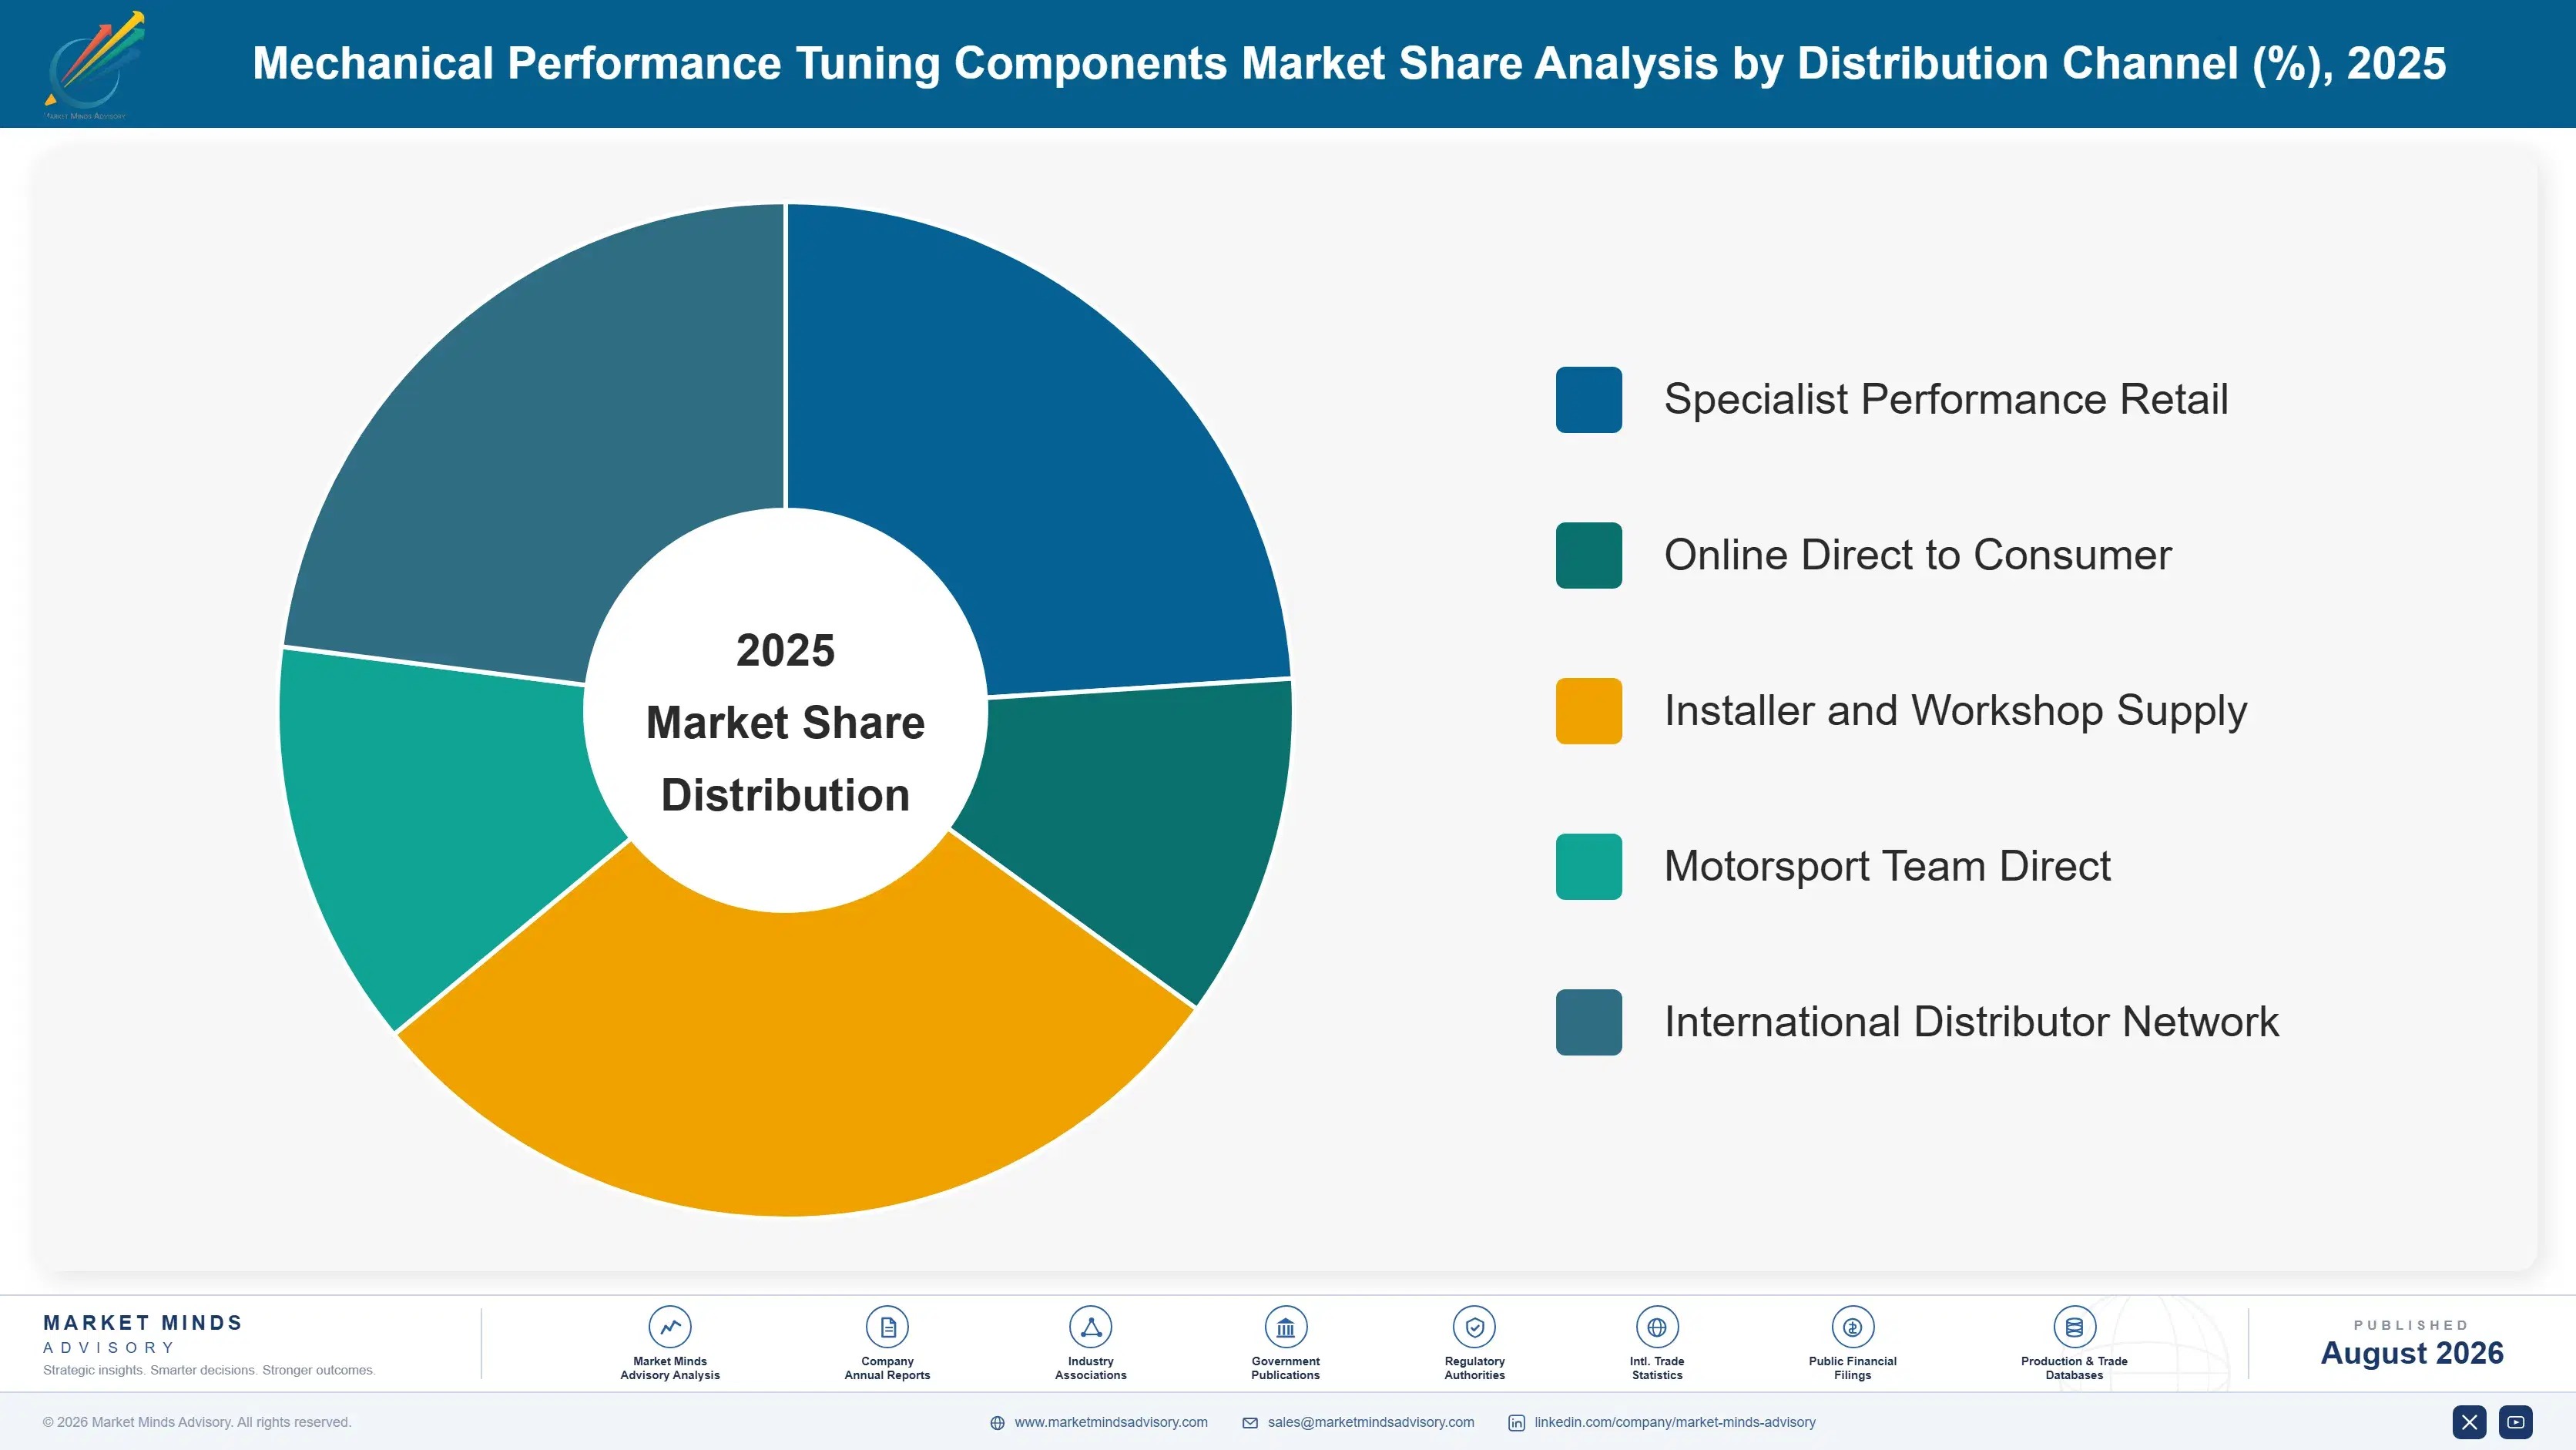
Components are classified here by vehicle system, since that determines the regulatory exposure, the certification requirement and whether the category survives electrification at all. Vehicle type, buyer motivation and distribution channel are handled separately in the framework, because one system category serves street, track and show buyers without any change to the part. Survival decides value here.
mechanical-performance-tuning-components-market-market-share-analysis-1787555479728

Electronic Control and Calibration Hardware

Growing at 8.7%, half again the market rate, this is the only category that works on everything. A combustion engine, a hybrid and an electric vehicle are all governed by software determining power delivery, torque distribution and throttle response, which means calibration hardware has a future that exhaust and intake products do not. Growth reflects that survivability as much as present demand, since buyers and suppliers alike can see which categories continue. The complication is regulatory concentration: a calibration defeating emissions control is exactly what enforcement targets, which makes this simultaneously the segment with the best prospects and the highest exposure. Suppliers separating performance calibration from emissions defeat are the ones with a business.
CAGR 8.7%

Suspension and Chassis Components

Suspension survives everything that threatens this industry. It faces no emissions certification requirement, no enforcement exposure and no electrification risk, and an electric vehicle carrying several hundred kilogrammes of battery arguably needs it more than a combustion equivalent did. Growth at 7.4% draws on track participation rising around 11% annually, on electric vehicle owners discovering what mass does to handling, and on a classic and restoration market that keeps expanding. The commercial attraction is that demand is genuinely durable rather than merely current. Suppliers concentrated in categories that electrification eliminates are acquiring suspension capability at valuations reflecting exactly how obvious this has become. Valuations in that category have risen materially across the last two years alone.
CAGR 7.4%
Full segment breakdown across 6 segments available in the complete report.

Regional Architecture and Country Demand Map

North America holds 32% of value on a modification culture and vehicle population nothing else matches, and it is also where enforcement hit hardest. East Asia follows at 26% with Chinese rule relaxation opening the largest untouched market anywhere. Culture and regulation both decide this map.

North America

Vehicle modification is a mainstream cultural activity here rather than a niche one, supported by a vehicle population, a distribution network and a trade show circuit nothing elsewhere approaches in scale. It is also where enforcement arrived first and hardest, with penalties reaching multiples of the revenue affected lines generated and distributors refusing inventory they had stocked for decades. Certification at around 42,000 dollars per component has begun consolidating a supplier base that resisted every previous attempt. Track day participation growth is strongest here. Growth at 5.0% sits below the market average because enforcement removed product faster than certification replaced it across the period. Certification is doing the consolidating now.
Share: 32% | CAGR: 5.0% (2026 to 2036)

Western Europe

Type approval and roadworthiness testing regimes across Europe have always been stricter than American practice, which means this market never developed the grey area that enforcement subsequently removed elsewhere. German technical inspection requirements in particular mean a modification is either approved or the vehicle fails, with no disclaimer available. That produced a supplier base built around certification from the start, and German suspension and brake manufacturers hold genuine engineering depth as a result. Electrification is arriving faster here than anywhere, removing engine categories early. Growth at 4.2% is the weakest of the seven regions and reflects that combination directly. Approval was always required here, so nothing was ever lost to enforcement.
Share: 21% | CAGR: 4.2% (2026 to 2036)
Regional intelligence for 5 additional markets available in the complete report: East Asia, South Asia and Pacific, Latin America, Middle East and Africa, Eastern Europe. Contact sales@marketmindsadvisory.com.
mechanical-performance-tuning-components-market-country-cagr-analysis-1787555480248

Where Performance Margin Actually Sits

Four moves matter in an industry that just discovered regulators were paying attention and that most of its catalogue has no future on an electric vehicle. Two are about the categories that survive both problems, and two are about turning certification cost from a burden into a barrier. Defending the old catalogue is not among them.

Certify deliberately and let the catalogue shrink

Road use approval costs around 42,000 dollars per component, which is trivial on a part selling thousands and impossible on one selling forty. Suppliers attempting to preserve catalogue breadth are spreading certification budget across lines that will never recover it. Choosing the fifty parts worth certifying and discontinuing the rest concentrates spend where it earns and turns a cost into a barrier competitors cannot clear. Certified product also sells legally in every geography rather than through disclaimers, which expands the addressable market for exactly the lines a supplier chose to keep.
Market Impact: Recovers a 42,000 dollar cost per certified component

Move capability toward what electrification does not remove

Roughly 40% of the traditional parts basket survives electrification by value, and it is suspension, brakes, wheels, aerodynamics and software rather than anything touching air and fuel. Suppliers concentrated in exhaust, intake, forced induction and engine internals are watching a category disappear on a timetable regulators set for them. Acquiring or building suspension and brake capability is expensive now precisely because the conclusion has become obvious to everybody. Suppliers who move later will pay considerably more for the same capability, and some will find nothing left worth buying. Some will find nothing left.
Market Impact: Protects the full 40% of surviving basket value

Serve track buyers rather than street modification

Amateur circuit participation grows around 11% annually and those buyers purchase brakes, suspension, cooling and consumables that face no emissions certification, no enforcement exposure and no electrification threat whatever. An electric track car needs better brakes and cooling than a combustion one, which makes this demand genuinely durable rather than merely current. The buyer is also different, judging products on lap time and durability rather than on appearance or sound. Suppliers organised entirely around street modification are missing a customer whose purchases nothing in this market threatens. Most suppliers miss them entirely.
Market Impact: Serves buyer demand now growing 11% every year

Enter China before domestic suppliers close it

Chinese modification rule relaxation opened the largest vehicle population anywhere to an enthusiast culture that had already developed without legal permission, and growth at 9.4% is the fastest of any country here. Domestic manufacturers moved quickly into that opening and international suppliers largely did not, which is unusual given the size involved. The window for establishing brand position before domestic alternatives define the category is measured in a few years rather than a decade. Suppliers waiting for the market to prove itself will arrive to find the positions taken and defended.
Market Impact: Enters the market now growing at 9.4% annually

Who Controls the Margin Pool

Five manufacturers hold just 19% of performance component supply, measured on component revenue at manufacturer level, the basis used throughout this section. That fragmentation is the defining feature of the industry and it has survived fifty years of attempted consolidation, because niche products serving specific vehicles reward small specialists over scale. Certification economics are changing that faster than any acquisition ever did. Cost is achieving what capital never did.
Competition runs on three dimensions. Certification portfolio, since only around 38% of catalogue product holds road use approval and that share decides what can be sold legally. Brand credibility with enthusiasts, which is earned across years and lost in a single product failure. And vehicle application coverage, because a buyer wants a part for their specific car rather than a general one. Price competes least of the three. Enthusiasts pay for credibility.

Rankings shift as certification cost forces catalogue decisions, which favours suppliers with volume lines over those with breadth. Chassis and brake specialists are being acquired by engine-focused suppliers at rising valuations. Chinese domestic manufacturers are establishing positions in a market international suppliers have barely entered.
mechanical-performance-tuning-components-market-company-positioning-matrix-1787555480764

Competitive Moat and Risk Dimensions

HOLLEY PERFORMANCE BRANDS

Moat: Certification portfolio scale

Holley operates at volumes that make the roughly 42,000 dollar certification cost per component recoverable across many product lines rather than a few, which is precisely the position smaller specialists cannot reach. As enforcement removes uncertified product from distribution, that portfolio becomes an advantage rather than merely an expense, and competitors face the same cost against far smaller unit volumes.
HOLLEY PERFORMANCE BRANDS

Risk: Combustion category concentration

A substantial share of the portfolio sits in exhaust, intake, forced induction and engine internals, which are exactly the categories electrification eliminates entirely rather than merely reducing. Certification investment in those lines earns back over a period shorter than anybody planned. Chassis and brake specialists face none of that exposure and are being valued accordingly by acquirers.
BREMBO

Moat: Braking engineering and motorsport

Brembo holds braking engineering credibility built through motorsport at the highest levels, which transfers directly into an aftermarket where enthusiasts buy reputation as much as performance. Braking also survives electrification and faces no emissions certification requirement at all, which makes the position durable against both threats defining this market's next decade.
BREMBO

Risk: Regenerative braking demand reduction

Electric vehicles recover much of their braking energy regeneratively, which reduces friction brake usage substantially in normal driving and extends component life considerably. Aftermarket replacement and upgrade demand follows wear rather than vehicle population. Track use reverses the effect entirely, though track buyers are a small share of the addressable market.

Players Tracked

Prominent Players

Holley Performance Brands
Edelbrock Group
Tenneco
Brembo
KW Automotive

Other Key Players

Borla Performance
Magnaflow
K&N Engineering
aFe Power
Garrett Motion
BorgWarner
Bilstein
Ohlins Racing
Eibach
H&R Special Springs
HKS
Tomei Powered
Mishimoto
AEM Performance Electronics
Cosworth

Recent Developments

MARCH 2025

A performance supplier discontinued uncertified product lines

An American performance component manufacturer discontinued a substantial number of catalogue lines lacking road use certification, citing enforcement exposure and distributor unwillingness to stock uncertified product. This was an internal catalogue decision rather than any transaction, and it reduced product breadth considerably in one step.
Signal: Catalogue breadth is being cut rather than certified, which means consolidation is happening through withdrawal rather than acquisition
AUGUST 2025

An engine specialist acquired a suspension component manufacturer

A performance manufacturer concentrated in engine and exhaust products acquired a suspension component business, buying capability in a category that survives electrification. This was a completed acquisition rather than any partnership, and the valuation reflected how widely the reasoning is now understood across the industry.
Signal: Chassis capability is being bought at rising valuations, which confirms suppliers have finally priced the electrification problem properly
DECEMBER 2025

Chinese domestic suppliers expanded performance component ranges

Chinese domestic manufacturers substantially expanded performance component ranges following modification rule relaxation, targeting an enthusiast base that had developed before any legal channel existed. This was organic product development rather than any transaction with international suppliers or partners. International brands have hesitated visibly throughout. Nobody has responded.
Signal: Domestic suppliers are defining the Chinese category while international brands hesitate, which usually settles a market permanently

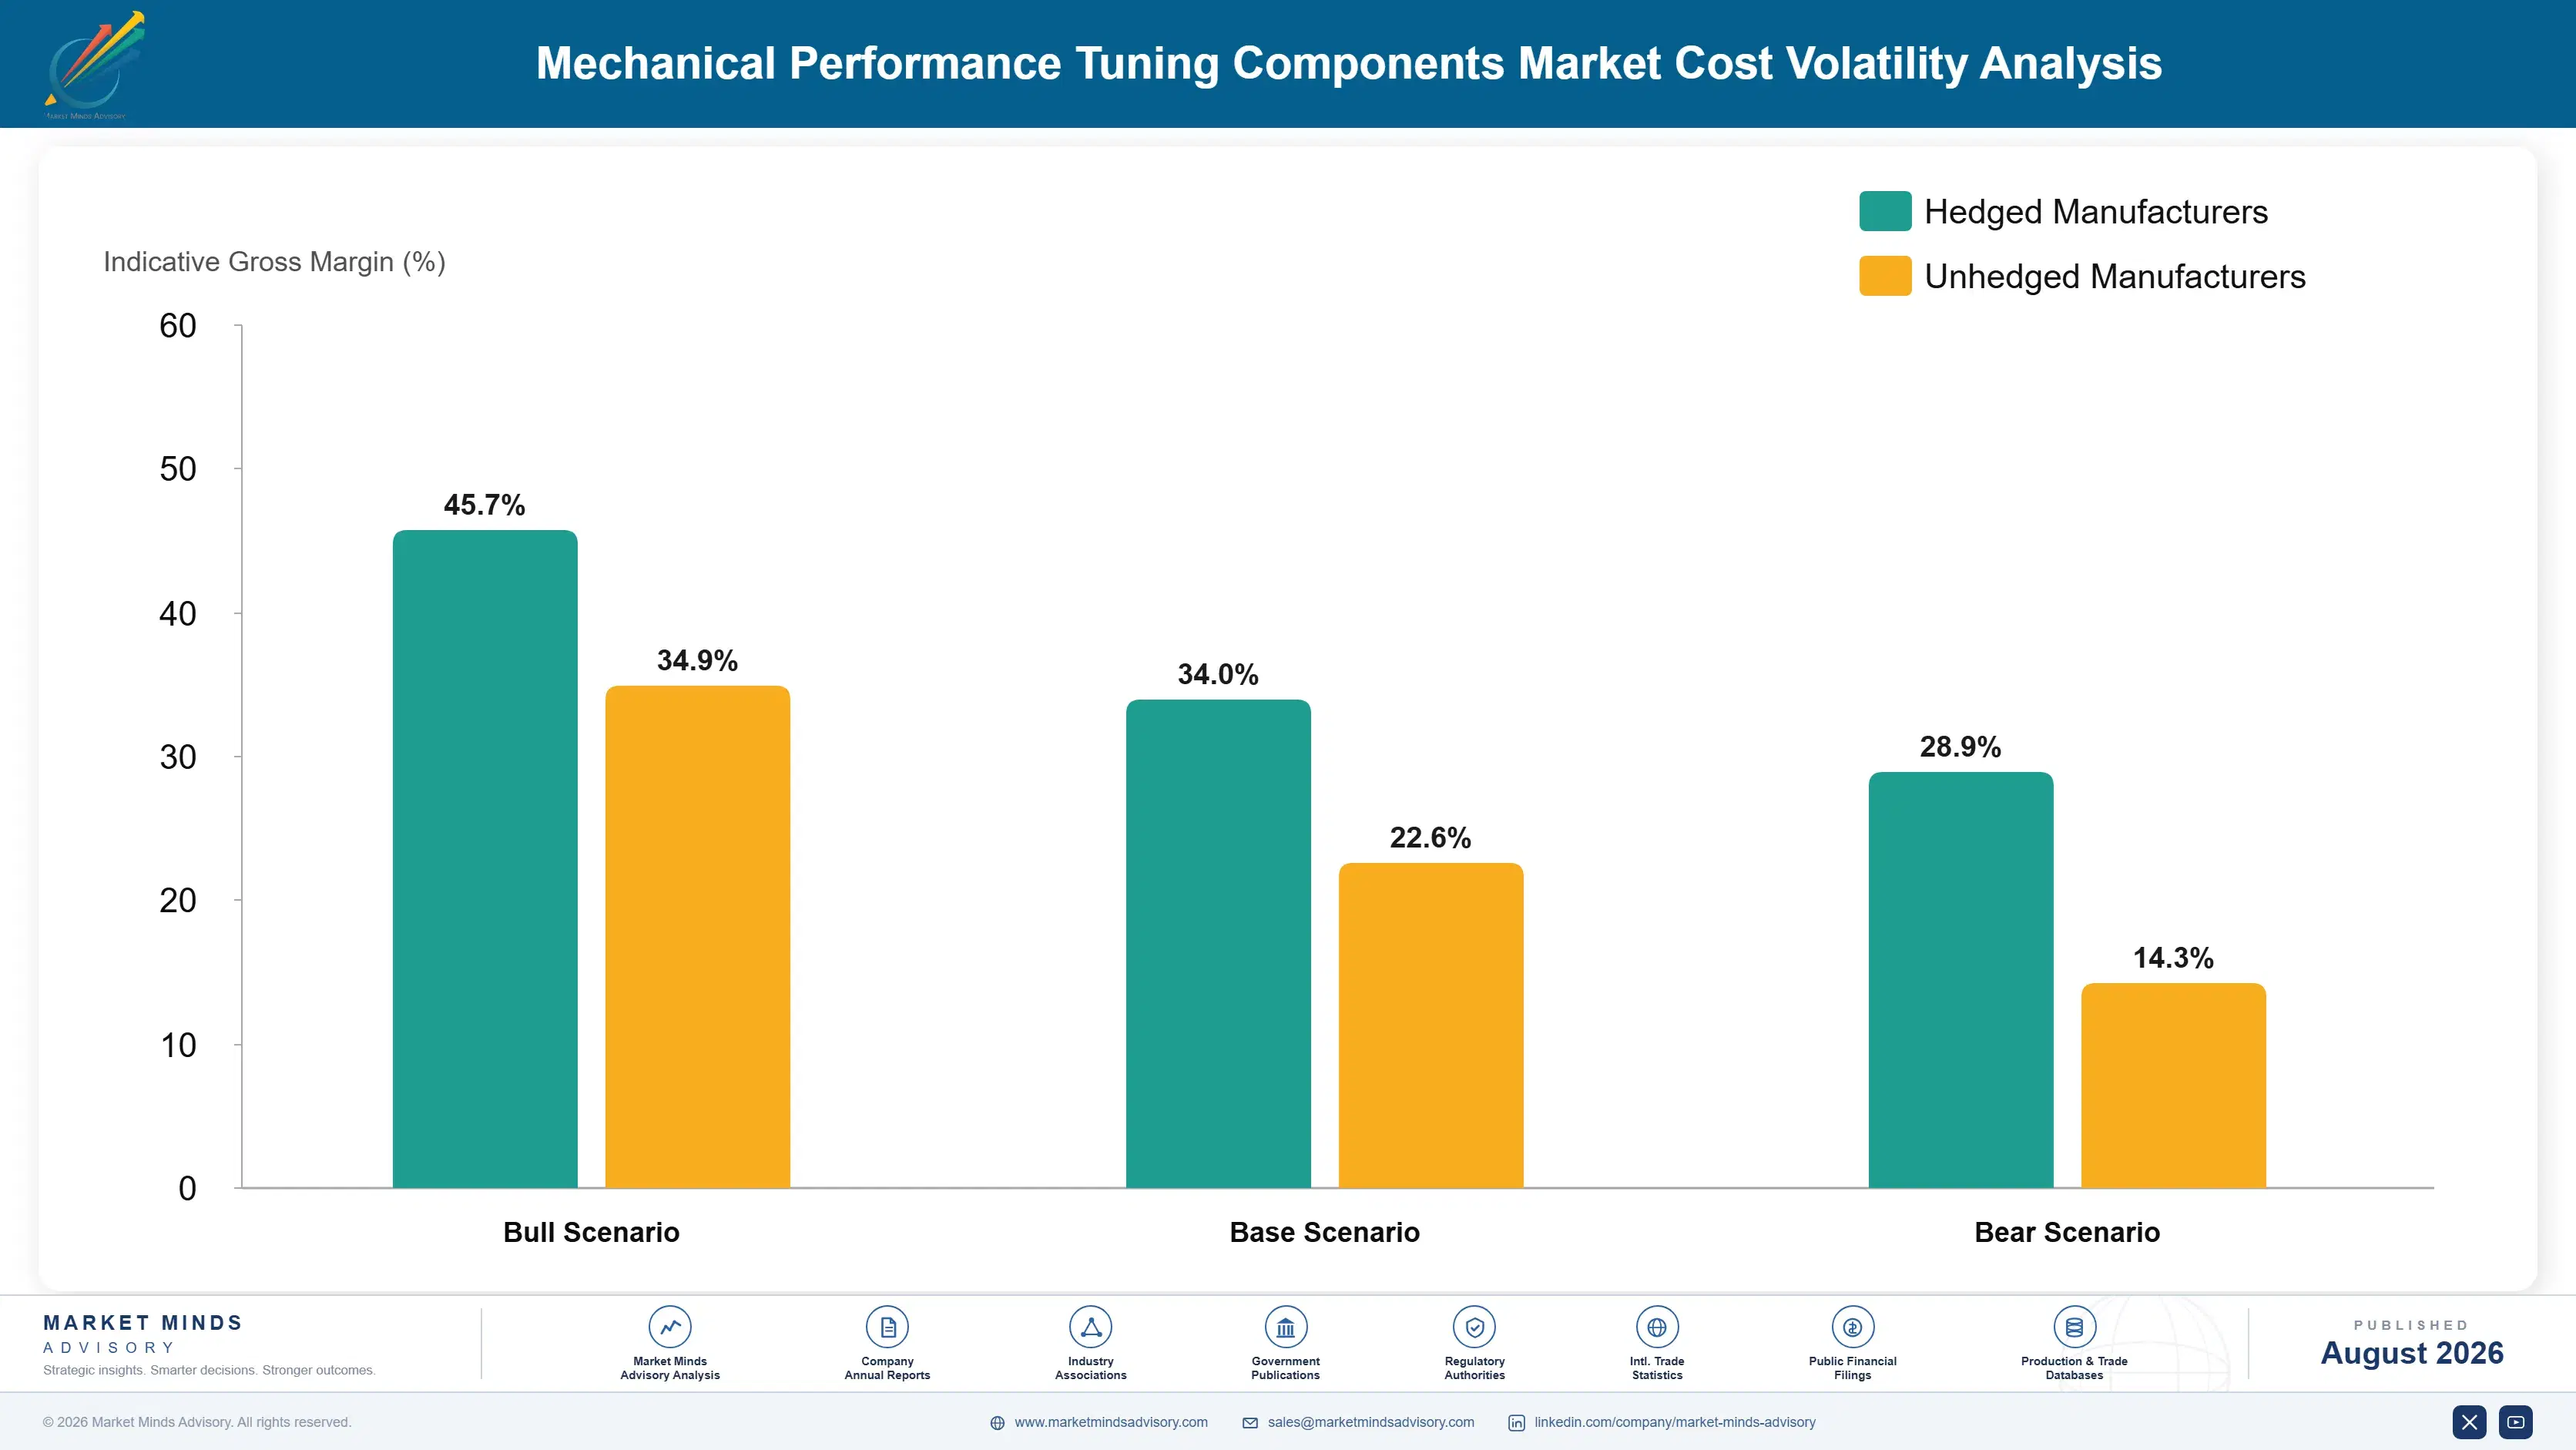
What Moves Manufacturer Cost

Materials account for around 39% of component cost, principally stainless steel, aluminium, forged alloys and electronic components depending on the product category. Machining, welding and finishing labour is substantial and largely resists automation at these volumes. Certification and testing sits outside cost of goods and consumes capital at roughly 42,000 dollars per approved component. Tooling amortisation across low volumes is unusually heavy.
Stainless steel and aluminium prices moved sharply through 2021 and 2022 alongside broader metals inflation, and IEA data show European industrial energy far above American levels across the period. Tenneco recorded raw material and freight cost pressure across its operations in its Annual Report 2022. Manufacturers on published catalogue pricing absorbed most of the movement, since a catalogue is printed for a season and reissuing it is impractical.

Certification rather than materials is what now separates viable suppliers from struggling ones. A component costing 42,000 dollars to approve needs volume that most niche performance parts never achieve, which means the cost is not really a cost at all but a decision about which products exist. Manufacturers treating it as an expense line miss that it functions as a portfolio filter.
mechanical-performance-tuning-components-market-cost-volatility-analysis-1787555480960

Concentrate certification spend on volume lines only

Approval at roughly 42,000 dollars per component recovers easily on parts selling thousands and never recovers on parts selling dozens. Suppliers spreading certification budget across catalogue breadth are funding lines that will not pay it back and starving lines that would. Choosing deliberately and discontinuing the remainder concentrates spend where it earns and creates a barrier competitors face identically.

Index catalogue pricing rather than publishing fixed prices

Materials at 39% of cost move on metals markets while performance catalogues are published for a season and cannot practically be reissued mid-year. That transfers commodity exposure to the manufacturer across months nobody forecasts accurately. Publishing indexed pricing or shorter catalogue periods removes it, and distributors accept the mechanism more readily than manufacturers expect them to.

Share tooling across vehicle applications where geometry permits

Low production volumes make tooling amortisation unusually heavy, and performance parts are frequently designed per vehicle application when the underlying geometry would permit sharing across several. Designing families rather than individual parts spreads that cost considerably without any manufacturing change at all. Suppliers treating each application as bespoke are paying repeatedly for tooling that modest design discipline would have reused.

Portfolio Architecture for Margin Defence

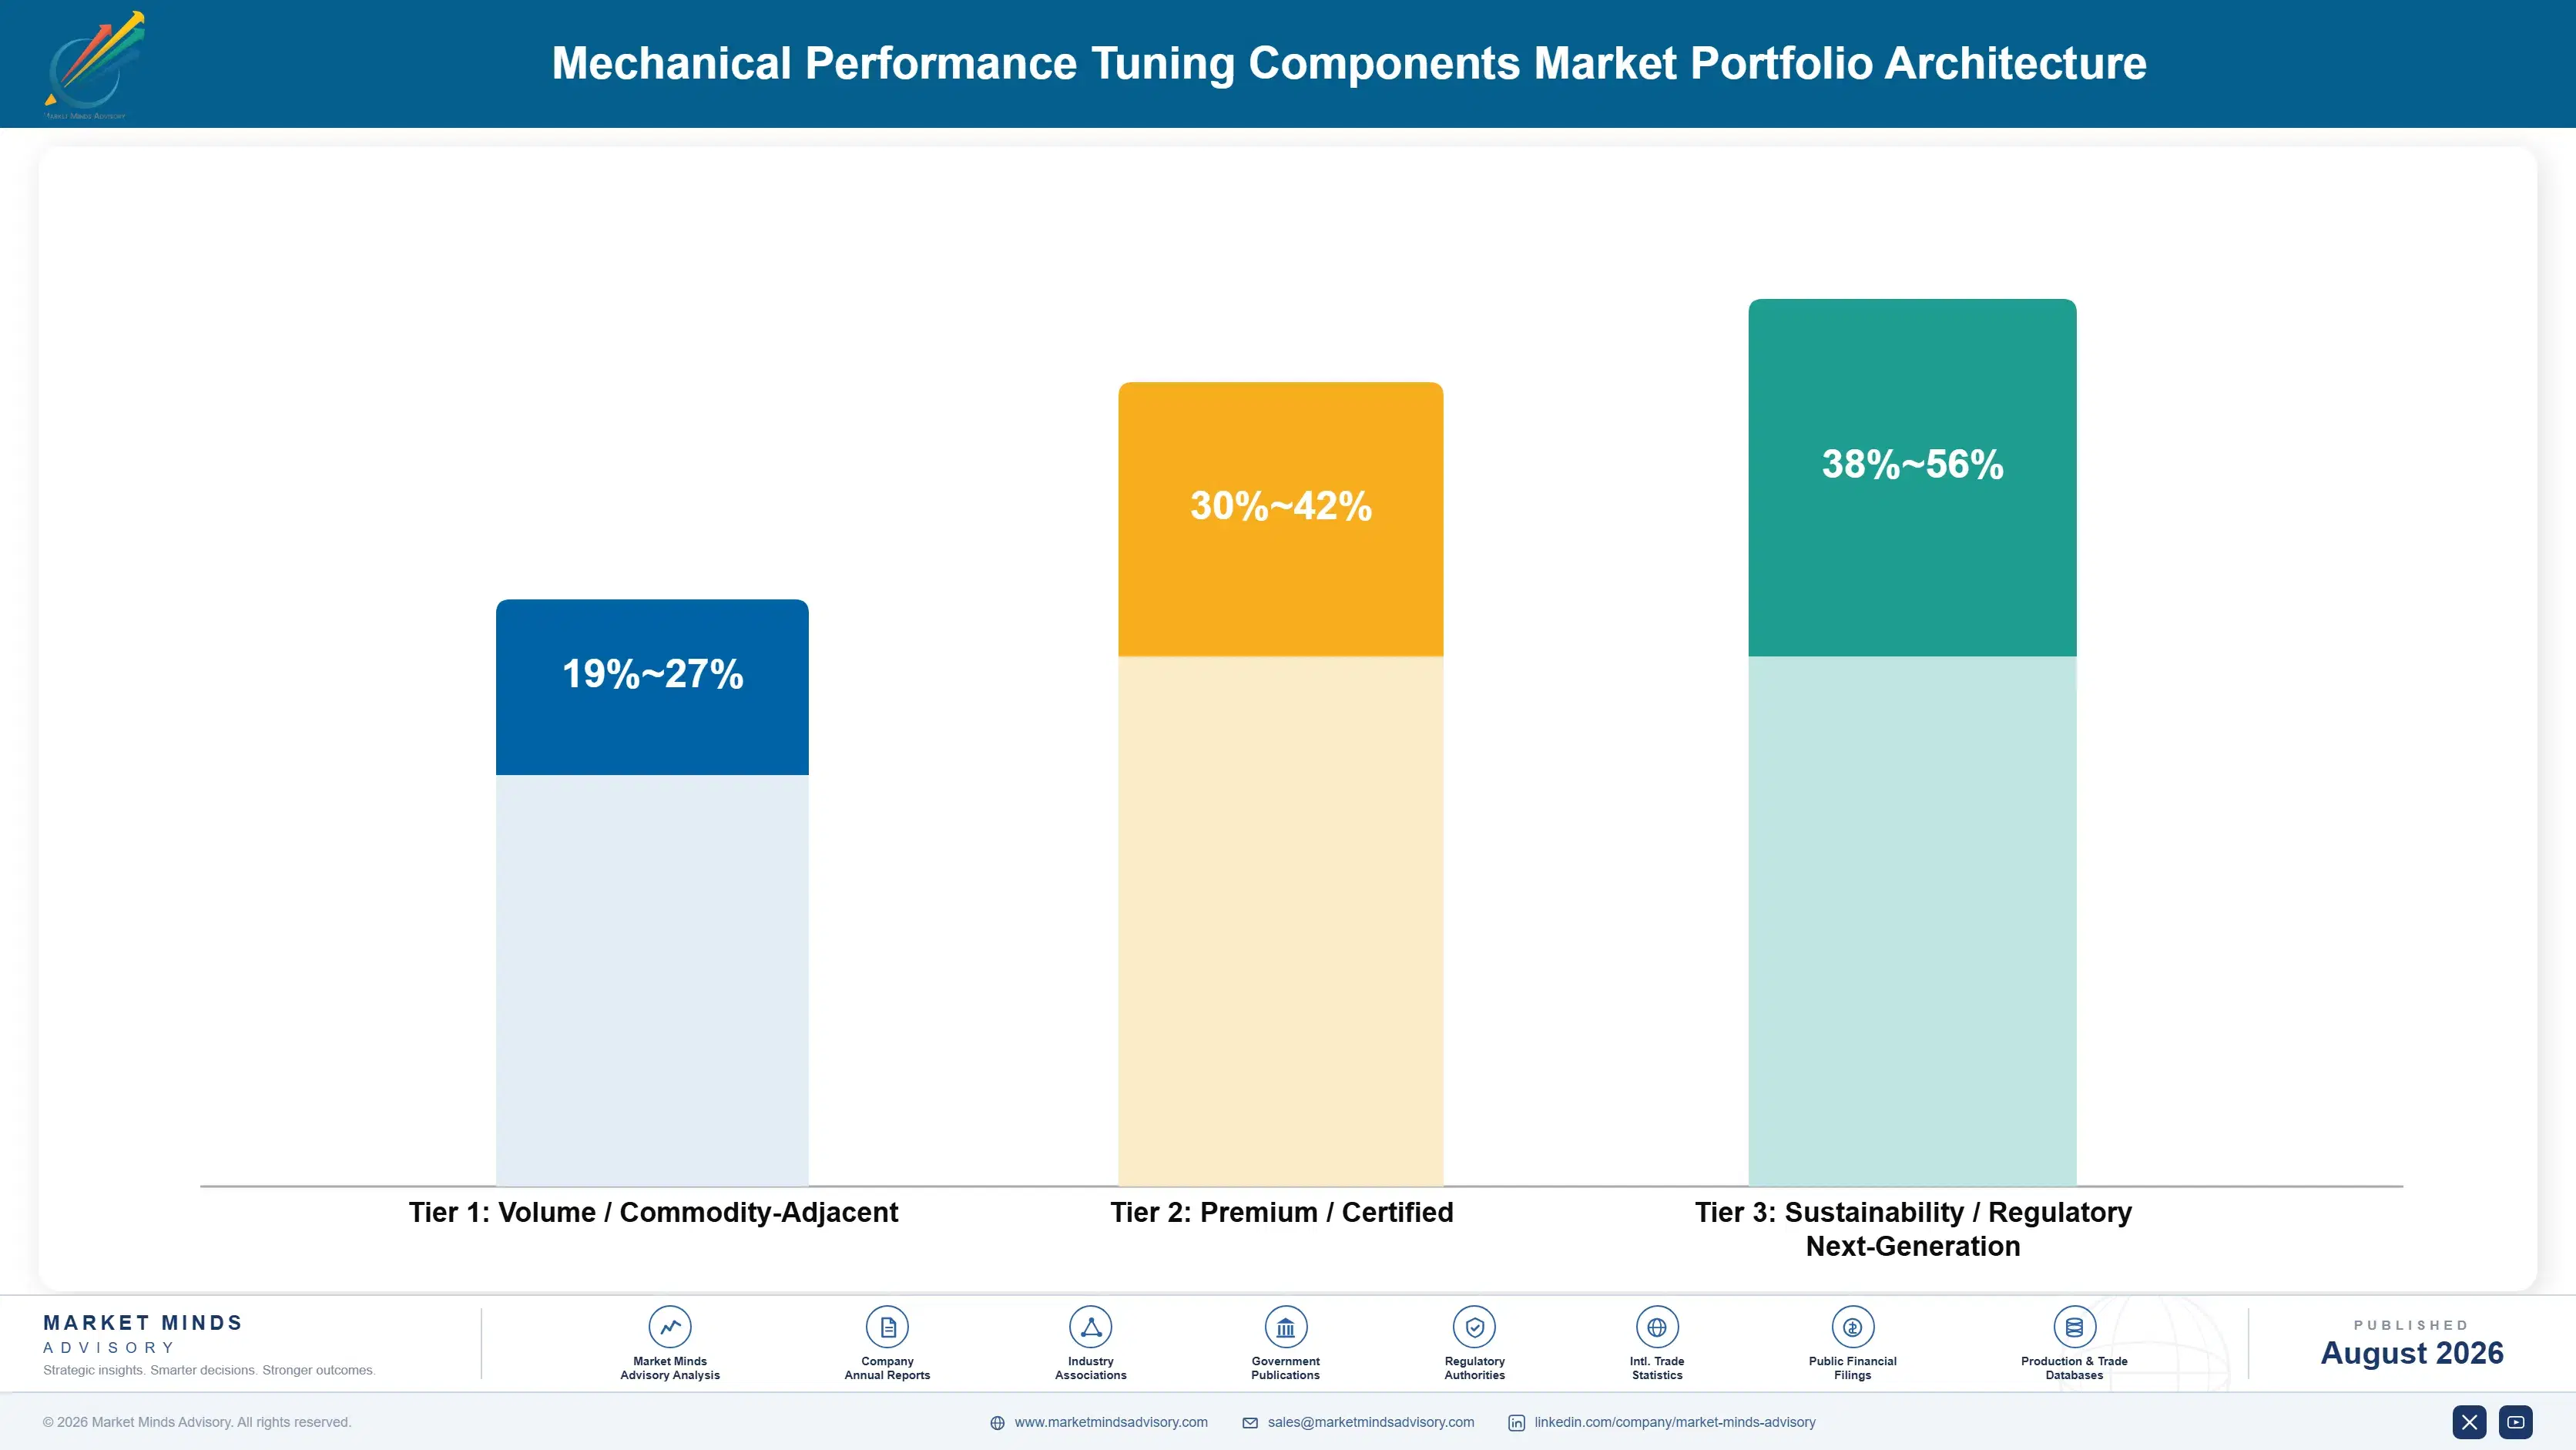
Margin here tracks certification status and category survival rather than engineering sophistication, which is not how this industry describes itself. Uncertified and commodity performance product runs at gross margins in the low twenties against distributors increasingly unwilling to stock it at all. Certified street product runs considerably better, since approval limits who can supply it legally. Track, motorsport and calibration products run higher again, because those buyers judge on capability rather than price and face no regulatory exposure.
The tension is that legacy combustion catalogue still generates the volume while surviving categories generate the future, and reallocating capital between them means writing off product lines that still sell today. Several suppliers have deferred that decision, funding certification on lines electrification will eliminate before the approval earns its cost back. That is a mistake with a visible timetable attached, which makes it unusually avoidable and unusually common.

High-value pools sit in calibration hardware, suspension and braking, and track-focused product. None of the three depends on the combustion engine at all. Catalogue breadth by itself defends nothing once every line carries a certification decision. Certification decisions govern everything now.

Volume / Commodity-Adjacent

Uncertified and commodity performance product sold through distributors increasingly reluctant to hold inventory carrying enforcement exposure. The eight-point range separates manufacturers with efficient tooling amortisation from those treating every vehicle application as a bespoke design.
Gross Margin: 19%-27%

Premium / Certified

Road use certified street product where approval at roughly 42,000 dollars per component limits which suppliers can legally compete. The twelve-point spread reflects unit volume, since certification cost per part sold varies enormously between high and low volume lines.
Gross Margin: 30%-42%

Sustainability / Regulatory / Next-Generation

Calibration hardware, track and motorsport product, and suspension and braking for electric vehicles. The eighteen-point range is wide because these buyers judge on measured capability rather than price and face no certification or electrification exposure at all.
Gross Margin: 38%-56%
mechanical-performance-tuning-components-market-portfolio-architecture-1787555481457

High-value Sub-segments and Strategic Watch-out

Calibration And Control Hardware

Compounding at 8.7% and the only category working on combustion, hybrid and electric vehicles alike, since all three are governed by software. Enforcement concentrates here too, which makes separating performance from emissions defeat the whole commercial question. That separation is the whole commercial question here.
Gross Margin: 40%-56%

Suspension And Braking Capability

Growing at 7.4% and immune to emissions certification, enforcement and electrification simultaneously, which almost nothing else in this market is. Engine-focused suppliers are acquiring it at valuations reflecting how obvious that has become. Nothing else in this market survives all three threats simultaneously and intact.
Gross Margin: 34%-48%

Legacy Combustion Catalogue

Still the volume and the category electrification eliminates entirely rather than reducing, on a timetable regulation already set. Certifying these lines at 42,000 dollars each rarely earns the cost back before the application disappears. Certifying them is usually money spent against a vanishing application. The timetable is public.
Gross Margin: 19%-27%

Track And Motorsport Demand

Participation rising around 11% annually and buying brakes, suspension, cooling and consumables that face no regulatory or electrification exposure whatever. An electric track car needs more of all of it, not less, which most suppliers have not registered. An electric track car needs more of all of it, not less.
Gross Margin: 36%-52%

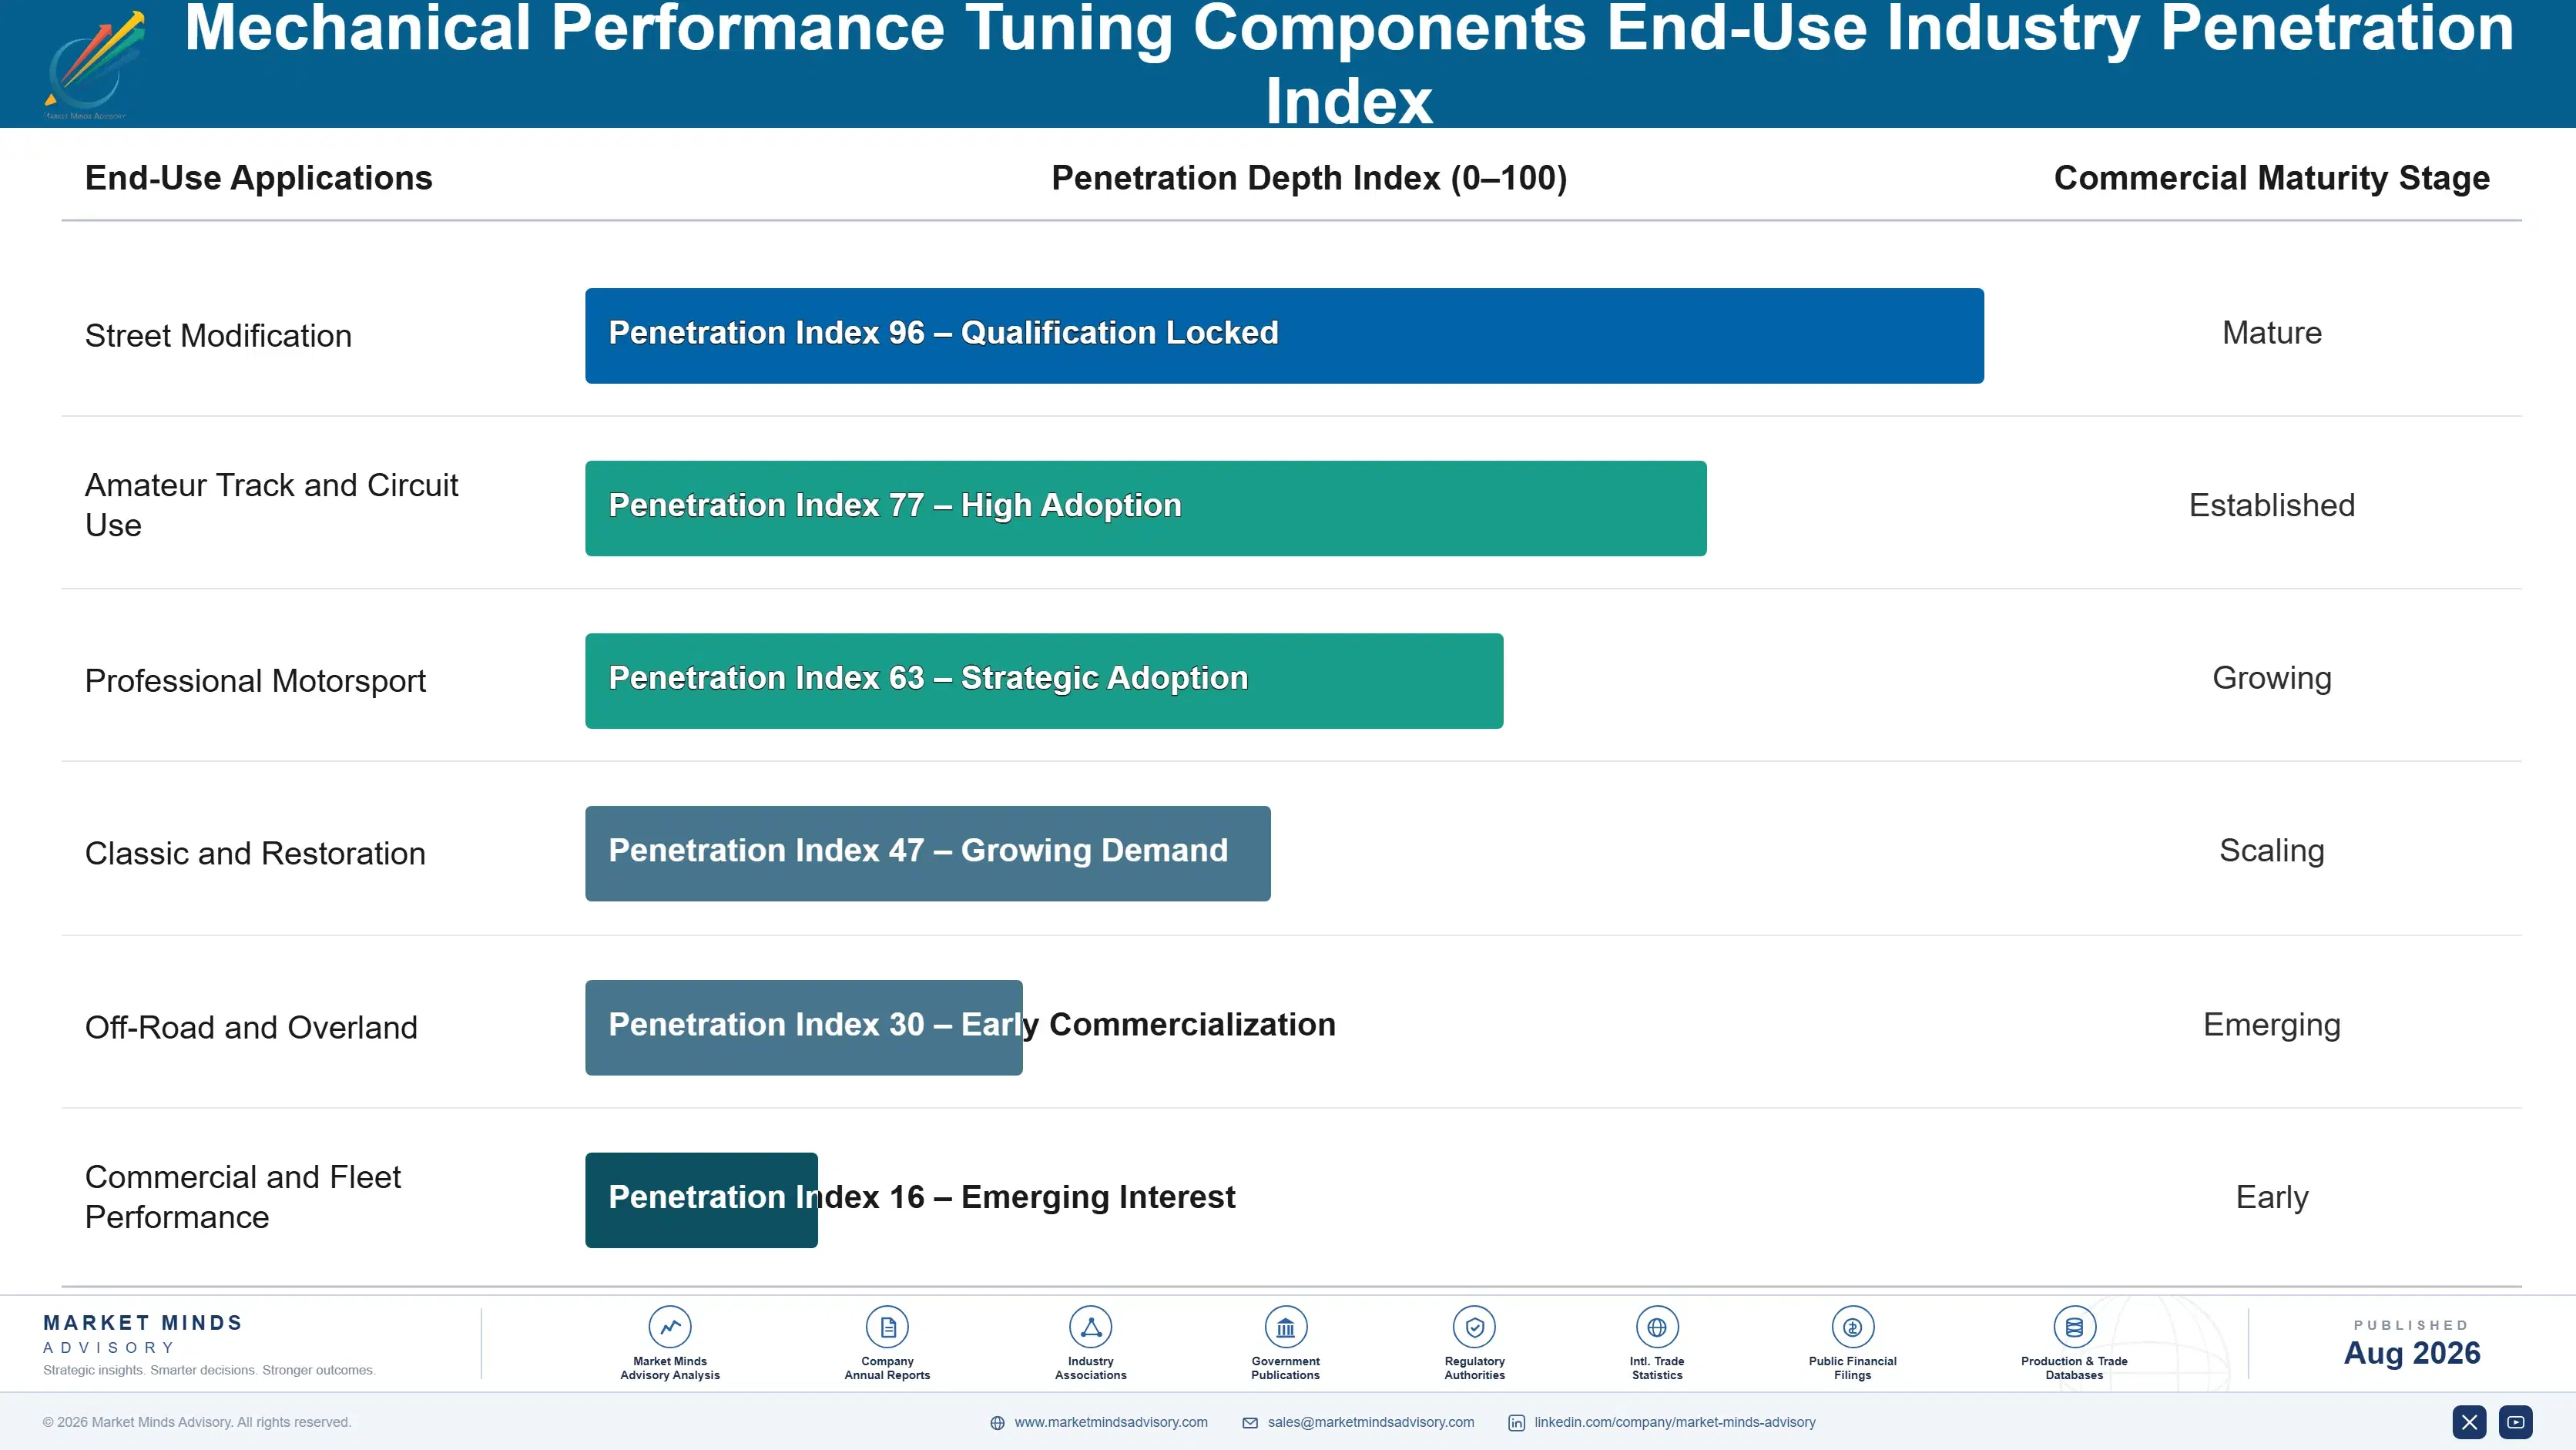
How Performance Demand Renews

Demand renews on the project rather than on any cycle, which makes this industry unusually dependent on discretionary enthusiasm. An owner modifies a vehicle over months or years in stages, buying components as budget and interest allow, then stops entirely when the project is finished or the car is sold. There is no replacement business except on consumables, and no contract of any kind. Every purchase is a fresh decision made for reasons that are partly emotional.
Stickiness runs through brand credibility rather than switching cost, because there is no switching cost at all. An enthusiast who fitted a component that performed as promised will buy that brand again and recommend it in forums that reach thousands, and a single product failure destroys both. Track and motorsport buyers are stickier still, judging on measured results. Commodity product changes brand on price with nothing surviving the transaction.

The buyer has changed less than the regulation has. Enthusiasts still buy on performance, appearance and sound in whatever combination suits them. What changed is that distributors now ask whether a part is certified before stocking it, which inserts a compliance gate between the manufacturer and a customer who never asked for one.
mechanical-performance-tuning-components-market-end-use-penetration-index-1787555481950

Where To Place The Bet

These are among the four positions where our research anticipates prominent divergence between winners and laggards over the coming forecast period. Each is grounded in the demand model, the regulatory perimeter, and the announced capacity pipeline.
01 / CERTIFICATION PORTFOLIO DISCIPLINE

Choose fifty parts and discontinue the rest

Road use approval costs around 42,000 dollars per component, which recovers trivially on a part selling thousands of units annually and never recovers at all on one selling forty. Suppliers attempting to preserve the catalogue breadth built across three decades are spreading certification budget across lines that cannot possibly repay it while starving the ones that would. Choosing deliberately concentrates spend where it earns, and certified product then sells legally in every geography rather than through a disclaimer nobody should have relied on.
02 / ELECTRIFICATION SURVIVAL REPOSITIONING

Buy chassis capability before it gets expensive

Roughly 40% of the traditional performance basket survives electrification by value, and it is suspension, brakes, wheels, aerodynamics and software rather than anything modifying an air and fuel process electric vehicles do not have. Suppliers concentrated in exhaust, intake, forced induction and engine internals are watching a category disappear on a timetable that regulators have already published for them. Acquiring chassis and braking capability is expensive now precisely because the conclusion is obvious, and it becomes more expensive every year anybody defers it.
03 / TRACK CUSTOMER DEVELOPMENT

Follow the buyer nothing in this market threatens

Amateur circuit participation grows around 11% annually and those buyers purchase brakes, suspension, cooling and consumables facing no emissions certification, no enforcement exposure and no electrification threat of any kind. An electric track car needs better brakes and better cooling than its combustion equivalent did, which makes the demand more durable rather than less. That customer also judges on lap times and consumable life rather than appearance, and suppliers organised entirely around street modification consistently fail to reach them at all.
04 / CHINESE MARKET ENTRY

Move before domestic suppliers define the category

Chinese modification rule relaxation opened the largest vehicle population in the world to an enthusiast culture that had already formed without any legal channel to buy through, and growth at 9.4% is the fastest of any country covered here. Domestic manufacturers responded within months and international suppliers have largely stayed away, which is remarkable given the population involved. The window to establish brand position before domestic alternatives define what the category means is a few years rather than a decade, and it closes quietly.

Engagement Snapshot From the Field

A live engagement with an industry participant carrying material or product regulatory and market exposure ahead of a defining policy shift, showing how our research translates into a defensible multi-year portfolio strategy.
MARKET MINDS ADVISORY · CLIENT ENGAGEMENT SUMMARY
Mechanical Performance Tuning Components Producer Strategic Portfolio Review and Transition Roadmap 2026·Investment Scenario on Mechanical Performance Tuning Components Exposure Evaluation 2025-26
CLIENT PROFILE
A North American performance component manufacturer with annual revenue around USD 130 million (client-reported, unverified by MMA), producing exhaust, intake and forced induction products across roughly 600 catalogue lines. Certification covered under a fifth of the range. The business held no suspension or braking capability and no calibration products. Distribution ran through specialist retailers. Track products were absent entirely.
STRATEGIC CHALLENGE
Two distributors had refused to stock uncertified lines (client-reported, unverified by MMA) and management proposed a broad certification programme covering most of the catalogue. Nobody had modelled how many of those lines would still have vehicle applications by the time approval completed, which made the proposal a large investment against a shrinking installed base.
MMA APPROACH
MMA modelled certification cost per line against projected unit volumes and against the electrification timetable for each vehicle application, rather than treating the catalogue as a single decision. Track and motorsport demand was sized separately through the expert interview programme. Suspension and braking acquisition valuations were benchmarked, and distributor stocking policy was assessed across the client's channel.
KEY FINDINGS
  1. Only about eighty catalogue lines carried enough projected volume to recover certification cost, against roughly six hundred the proposed programme would have covered at enormous expense.
  2. More than half the catalogue served vehicle applications that would be substantially out of production before certification completed, making approval worthless on those lines.
  3. The client had no products at all serving track buyers, whose participation was growing around 11% annually and whose purchases faced none of the regulatory exposure troubling the core business.
  4. Suspension and braking acquisition multiples had risen materially across two years as engine-focused competitors reached the same conclusion about which categories survive.
CLIENT PROFILE
A North American performance component manufacturer with annual revenue around USD 130 million (client-reported, unverified by MMA), producing exhaust, intake and forced induction products across roughly 600 catalogue lines. Certification covered under a fifth of the range. The business held no suspension or braking capability and no calibration products. Distribution ran through specialist retailers. Track products were absent entirely.
STRATEGIC CHALLENGE
Two distributors had refused to stock uncertified lines (client-reported, unverified by MMA) and management proposed a broad certification programme covering most of the catalogue. Nobody had modelled how many of those lines would still have vehicle applications by the time approval completed, which made the proposal a large investment against a shrinking installed base.
MMA APPROACH
MMA modelled certification cost per line against projected unit volumes and against the electrification timetable for each vehicle application, rather than treating the catalogue as a single decision. Track and motorsport demand was sized separately through the expert interview programme. Suspension and braking acquisition valuations were benchmarked, and distributor stocking policy was assessed across the client's channel.
KEY FINDINGS
  1. Only about eighty catalogue lines carried enough projected volume to recover certification cost, against roughly six hundred the proposed programme would have covered at enormous expense.
  2. More than half the catalogue served vehicle applications that would be substantially out of production before certification completed, making approval worthless on those lines.
  3. The client had no products at all serving track buyers, whose participation was growing around 11% annually and whose purchases faced none of the regulatory exposure troubling the core business.
  4. Suspension and braking acquisition multiples had risen materially across two years as engine-focused competitors reached the same conclusion about which categories survive.
RECOMMENDED STRATEGY
Phase 1: Phase one: certify only the eighty lines that recover the cost and discontinue the remainder rather than funding approval across the whole catalogue. Phase 2: Phase two: develop a track-focused product range in cooling and consumables, where the client's manufacturing already fits and regulation does not reach. Phase 3: Phase three: acquire suspension or braking capability immediately, accepting today's valuations rather than paying materially more in two years time.
OUTCOME
Certification proceeded on eighty-three lines and roughly four hundred were discontinued. A track cooling range launched during 2026. A suspension acquisition completed in early 2026, and the client reports gross margin improving despite the reduced catalogue (client-reported, unverified by MMA). Certification spend fell by two thirds.

Frequently Asked Questions

Foundational context covering the market sizes, CAGR, scope, country, region and competition that inform every finding below. This section is provided to cover basics and most often pre-purchase conversations, answered from the MMA Primary Research Dataset.

What is the current size of the Mechanical Performance Tuning Components Market?

The market was valued at USD 24.6 billion in 2025, rising to an estimated USD 26.03 billion in 2026. North America holds the largest regional share at 32% of value.

How large will the Mechanical Performance Tuning Components Market be by 2036?

MMA forecasts USD 45.74 billion by 2036 under the base case, an expansion multiple of 1.76 times the 2026 value. That represents USD 19.71 billion of incremental value.

What is the CAGR for the Mechanical Performance Tuning Components Market 2026 to 2036?

The base case runs at 5.8% compound annual growth between 2026 and 2036, with a bull case at 7.0% and a bear case at 4.6%. Historical growth from 2020 to 2025 was 4.8%.

Which segment is growing fastest?

Electronic control and calibration hardware leads at 8.7%, half again the market rate, because software works on combustion and electric vehicles alike. Suspension follows at 7.4%.

Who are the major companies in the Mechanical Performance Tuning Components Market?

Holley, Edelbrock, Tenneco, Brembo and KW Automotive hold just 19% of value between them. Certification portfolio and brand credibility rather than scale sustain those positions currently.

Which country is growing fastest?

China leads at 9.4%, after modification rule relaxation opened the largest vehicle population anywhere to an enthusiast culture that already existed. Domestic suppliers moved first.

Report Segmentation Architecture

The full report scope spans multiple orthogonal segmentation dimensions, with cross-tabulated demand data provided for each dimension pair. Coverage extends further to regional breakdowns, trend trajectories, and the competitive detail needed to support segment-level decision-making.

By Vehicle System

  • Intake and Exhaust Systems
  • Forced Induction Components
  • Suspension and Chassis Components
  • Braking System Upgrades
  • Engine Internal Components
  • Electronic Control and Calibration Hardware

By End-Use Industry

  • Street Modification
  • Amateur Track and Circuit Use
  • Professional Motorsport
  • Classic and Restoration
  • Off-Road and Overland
  • Commercial and Fleet Performance

By Distribution Channel

  • Specialist Performance Retail
  • Online Direct to Consumer
  • Installer and Workshop Supply
  • Motorsport Team Direct
  • International Distributor Network

By Region

  • North America
  • Western Europe
  • East Asia
  • South Asia and Pacific
  • Latin America
  • Middle East and Africa
  • Eastern Europe

Scope, Methodology, and Coverage

Every figure in this report is reproducible from documented input assumptions. The scope below maps the historical period, the forecast horizon, the segmentation dimensions, and the countries covered, alongside the underlying primary and qualitative methodology.
Historical Period
2020 to 2025
Forecast Period
2026 to 2036
Base Year
2025 (USD billions; MMA Primary Research Dataset, August 2026)
Market Definition
The market comprises aftermarket components sold to modify vehicle performance beyond original manufacturer specification across street, track, motorsport, restoration and off-road applications, covering intake and exhaust systems, forced induction components, suspension and chassis components, braking system upgrades, engine internal components, and electronic control and calibration hardware. Value is measured at manufacturer level across retail, online, installer and direct channels. Original equipment supply, routine replacement and service parts, cosmetic products without performance function, tyres, and complete vehicle conversions fall outside scope.
Quantitative Units
USD billions (current prices); million components supplied annually; USD per component by vehicle system
Segmentation Dimensions
By Vehicle System; By End-Use Industry; By Distribution Channel; By Region
Regions Covered
North America, Western Europe, East Asia, South Asia and Pacific, Latin America, Middle East and Africa, Eastern Europe
Countries Covered
United States, Canada, Mexico, Brazil, Argentina, Colombia, Germany, United Kingdom, France, Italy, Spain, Netherlands, Sweden, Poland, Czechia, Romania, Japan, South Korea, China, Taiwan, India, Thailand, Indonesia, Philippines, Australia, New Zealand, United Arab Emirates, Saudi Arabia, Qatar, South Africa
Key Companies Profiled
Holley Performance Brands, Edelbrock Group, Tenneco, Brembo, KW Automotive, Borla Performance, Magnaflow, K&N Engineering, aFe Power, Garrett Motion, BorgWarner, Bilstein, Ohlins Racing, Eibach, H&R Special Springs, HKS, Tomei Powered, Mishimoto, AEM Performance Electronics, Cosworth
Quantitative Methodology
Primary survey, n=3,800 respondents, Q4 2025, six countries; demand-side model with trade association cross-validation
Qualitative Methodology
47 expert interviews, Q4 2025; applied to validate demand model assumptions, identify emerging dynamics, and assess competitive positioning
Report Format
PDF and XLSX data workbook (Word format preview document)
Publisher
Market Minds Advisory
Report Code
MMA-2026-AUT-333
Published
August 2026
Contact
sales@marketmindsadvisory.com | www.marketmindsadvisory.com

Purchase the full Mechanical Performance Tuning Components Market Report (2026 to 2036).

The full report sizes the global performance tuning component market to 2036 across six vehicle systems and seven regions, measured on component revenue at manufacturer level. It treats certification cost as a consolidation mechanism rather than a compliance expense and models catalogue economics line by line. Competitive analysis covers 20 participants evaluated on component revenue, with moat and risk assessment for the two leaders. The portion of the traditional parts basket that survives electrification is quantified by category, since suppliers concentrated in the remainder face an existential timetable. Four quantified revenue levers close the analysis.
Six-system segment sizing with segment-level growth rates
Seven-region share and growth breakdown to 2036
Twenty-participant competitive map on one revenue basis
Certification economics modelled against catalogue line volumes
Electrification survival quantified by component category
Four quantified revenue levers with commercial impact ranges

Built For The People Who Decide

From boardroom strategy to bench-side execution, this report is read cover-to-cover by leaders shaping the next decade of their industry, turning demand scenarios, market dynamics and valuation benchmarks into decisions.
CXOs/ Presidents/ VPs/ Managers
M&A and Corporate Development
Strategy Teams and R&D Heads
Procurement and Product Directors
Regulatory and Compliance Leaders
Investor Relations and Equity Analysts