
Market Minds Advisory
Demand for Electrical Digital Twin in Japan

Demand for Electrical Digital Twin in Japan: A Split Grid, a Retiring Workforce and Asset Records Nobody Can Ingest

Around 38% of grid engineers retire within a decade, taking operating knowledge no document holds, and Japan runs two frequency systems that cannot balance each other freely across the country.

Lead Analyst

Published

September 2026

Make Smarter Decisions with Customized Research Insights

Request a free sample report and evaluate market opportunities, growth trends, and competitive dynamics relevant to your business needs.

2025 MARKET VALUE$3.6BMarket Size 2025
2036 FORECAST VALUE$17.1BBase Case , 2026 to 2036
CAGR 2026 TO 203615.2 %Bull 16.4% / Bear 14.0%
INCREMENTAL OPPORTUNITY$12.9BNet 10- year value creation
EXPANSION MULTIPLE4.12x2036 value over 2026 base
Strategic Levers
M&A Pipeline
Regional Outlook
Country Rankings
Competitive Intelligence
Segmental Deep-dive
Call-Us : 91 93563 13602

Executive Snapshot and Market Trajectory

The usual case for an electrical digital twin is efficiency. In Japan it is memory. Roughly 38% of grid engineers reach retirement within a decade and the operating knowledge they hold was never written down, which makes modelling a capture exercise rather than an optimisation one at all.
Distributed energy resource integration twins grow at 22.8%, half again the market rate of 15.2%, because connection studies taking about 9 months without modelling cannot keep pace with applications. Industrial plant electrical twins follow at 18.4%. East Asia takes 34% of value, with Japan the analytical centre of this report and a grid split across two frequency systems that cannot freely support each other. Japanese demand specifically grows at 14.8% across the period.
Concentration sits near 41% across the top five on measured software and delivery revenue. The uncomfortable number is 63%: that share of project effort goes into preparing asset records before any modelling starts, which vendors pricing on licence value consistently underestimate and consistently lose money on. Vendors quoting a software licence have priced for about a fifth of the work involved. Customers have stopped believing the quotes.
Market Definition
This market covers software and associated delivery services that build and maintain live computational models of electrical systems, spanning transmission and distribution network twins, substation and asset twins, distributed energy resource integration twins, industrial plant electrical system twins, generation plant electrical twins, and building and campus electrical twins. Revenue is measured as licence, subscription and attributable implementation value at supplier level, with Japan treated as the analytical centre within a global sizing frame. Physical sensing hardware, supervisory control systems, general enterprise asset management software, and mechanical or process simulation without electrical modelling are excluded.
Base Year Value
$3.6B in 2025 (MMA Primary Research Dataset, September 2026)
Forecast Period
2026 to 2036, eleven discrete annual values
CAGR
15.2% base case. Bull 16.4%. Bear 14.0%.
Fastest Growth Segment
Distributed Energy Resource Integration Twins: 22.8% CAGR
Fastest Growth Country
India: 18.6% CAGR
Fastest Growth Region
South Asia and Pacific: 17.4% CAGR
Largest Region
East Asia: 34% of 2025 global value
Market Leaders
Siemens, Hitachi Energy, Schneider Electric, GE Vernova and AspenTech lead on measured software and delivery revenue. Source: MMA Primary Research Dataset, July 2026.
Primary Survey
n=3,800 procurement and R&D decision-makers, Q4 2025, six countries
Methodology
Demand-side build-up, cross-validated against public data, 47 expert interviews

Demand for Electrical Digital Twin in Japan Market Forecast Scenarios

japan-electrical-digital-twin-market-size-forecast-scenario-1788427254774
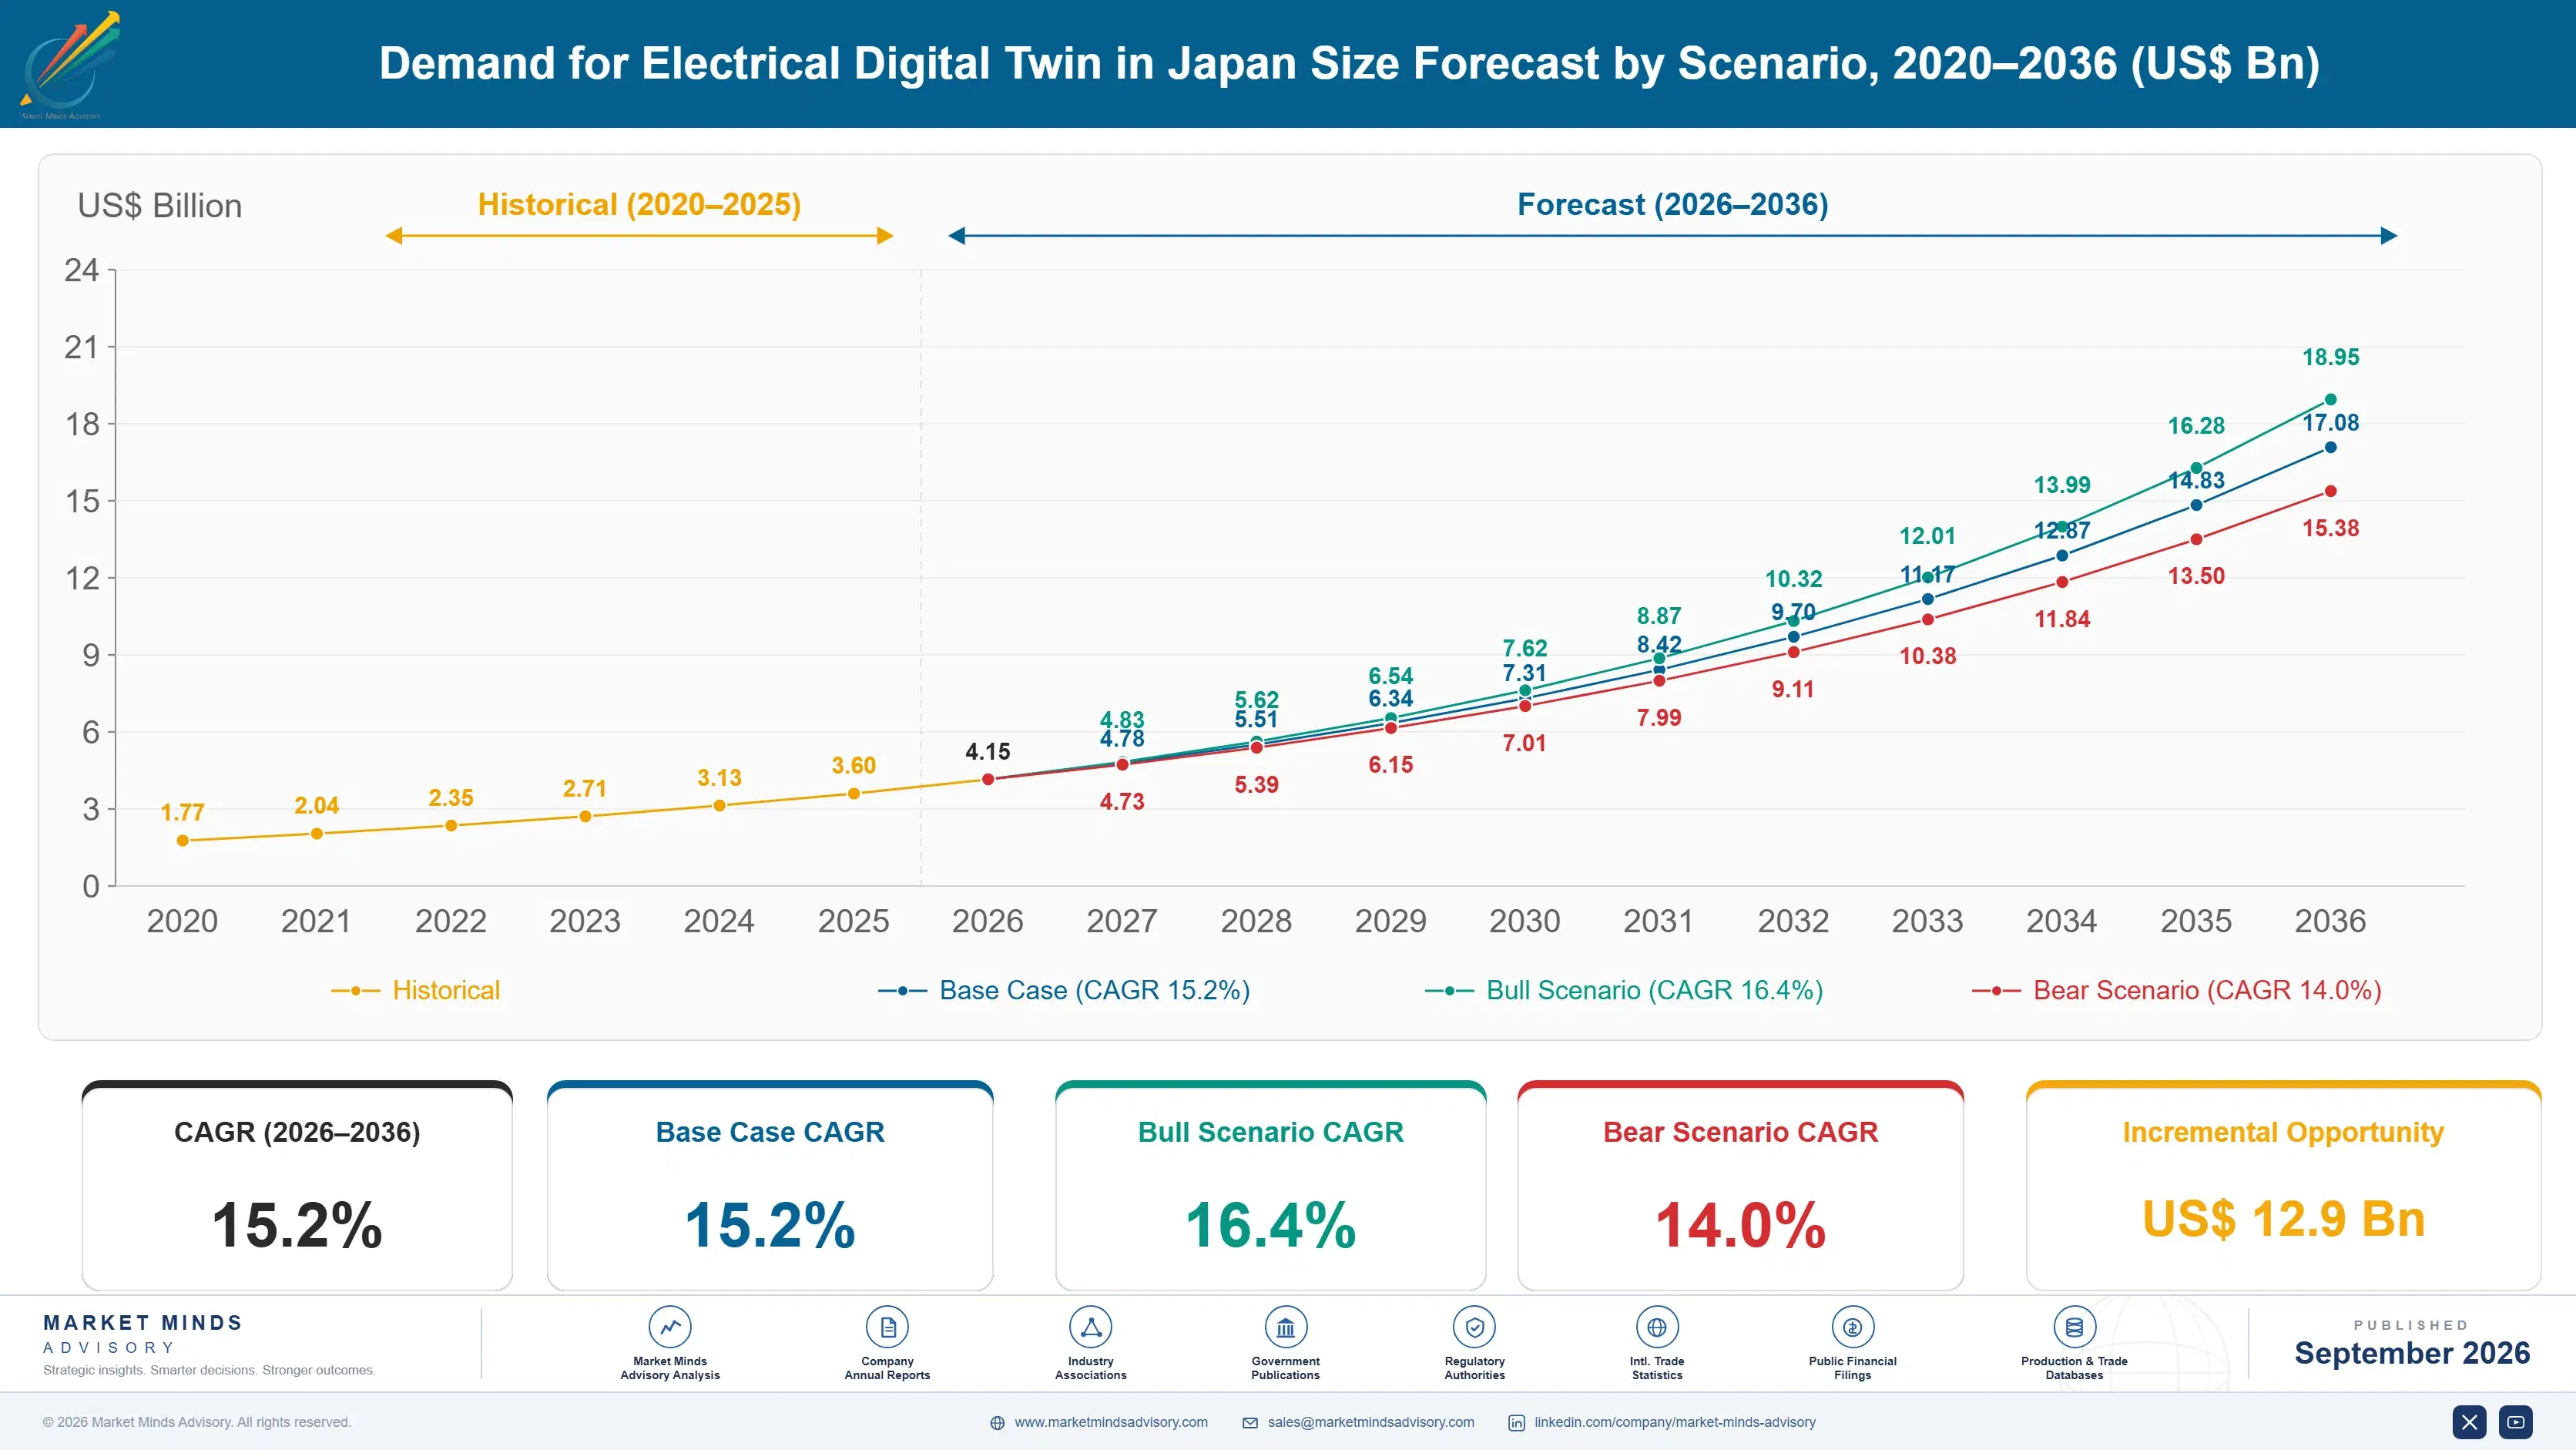
Growth ran at 13.8% from 2020 to 2025 and Japanese demand had a particular cause behind it. Generation and transmission separation completed in 2020 left entities that had operated a network jointly needing their own independent models of it, which produced a wave of modelling work that had nothing to do with technology adoption. Renewable connection applications then accelerated faster than manual study capacity could absorb them.
The base case at 15.2% rests on three mechanisms. Connection studies taking about 9 months by manual methods cannot process the volume of distributed generation applications arriving, and modelling is the only route to shortening them. Engineer retirement at roughly 38% within a decade forces knowledge capture on a timetable nobody chose. Third, Japan's two frequency systems and limited conversion capacity between them mean regional operators must model their networks with precision nationally balanced grids never required.
The bull case at 16.4% assumes model accuracy improves enough for operators to accept automated connection assessment rather than treating models as advisory. The bear case at 14.0% is that data preparation at around 63% of project effort keeps delivery uneconomic, which would confine adoption to the largest operators able to absorb that cost internally themselves.

Modelling What Nobody Wrote Down

Japan's grid carries a constraint no other developed market shares. Eastern and western Japan run at different frequencies with limited conversion capacity, so the country cannot balance nationally the way European systems do. Regional operators must therefore model their networks with precision a balanced grid never demands, since no neighbouring system can absorb an error. That is a modelling requirement rather than a preference.
TOP FIVE CONCENTRATION41%Moderately concentrated among electrical equipment and software vendors
DATA PREPARATION SHARE63%Project effort spent readying asset records before modelling begins
JAPANESE GRID FREQUENCY SPLIT2 systemsSeparate frequency areas that cannot balance each other freely
ENGINEER RETIREMENT WAVE38%Grid engineers reaching retirement age within a decade
MODEL ACCURACY ACHIEVED91%Agreement between modelled and measured actual network behaviour
INTERCONNECTION STUDY TIME9 monthsPeriod to complete a connection assessment without modelling
The second driver is demographic and rarely discussed as such. Around 38% of grid engineers reach retirement within a decade, and much of what they know exists nowhere except in their heads: which feeder behaves oddly in summer, which substation's records were never corrected. A digital twin is the only mechanism that captures that before it leaves. Utilities describe the projects as efficiency work and fund them as succession planning.
What goes wrong is data. About 63% of project effort goes into preparing asset records compiled over decades in inconsistent formats, and vendors pricing on licence value have quoted for a fifth of the work. Model accuracy reaches around 91% agreement with measured behaviour when the underlying records are good and considerably less when they are not. The software is rarely the difficult part here.
"Every proposal in this market is priced as a software sale and delivered as an archaeology project. The vendors making money have stopped pretending otherwise and charge for the record reconstruction separately, which customers accept once somebody explains why the first quote was wrong."
Director, Grid Systems and Energy Digitalisation Practice · MMA Energy Practice · September 2026

Market Trends

Retirement Is Forcing Knowledge Capture on a Deadline

Roughly 38% of grid engineers across developed markets reach retirement within a decade, and Japanese utilities face the sharpest version of this because their workforce is older than most and hiring replacements has proven difficult. Much of what those engineers know about their own networks was never documented anywhere, existing instead as operating judgement built over careers. A model is the only mechanism that captures it while they are still available to correct it. Utilities present these projects as efficiency and approve them as succession planning. Nobody chose the timing and nobody can defer it.
Market Impact: Splits the grid into 2 systems
Connection Study Backlogs Force Automated Assessment

Assessing a distributed generation connection by manual study takes about 9 months, and application volumes across every developed grid now exceed what manual capacity can process at any staffing level operators could realistically fund. Network models that run the assessment computationally are the only route to shortening it, which is why distributed energy resource integration twins grow at 22.8%. The obstacle is trust rather than capability: operators accept modelled results as advisory and remain reluctant to make connection decisions on them alone. Trust rather than mathematics is what actually limits the gain here.
Market Impact: Separated entities in 2020

Market Opportunities and Growth Drivers

Two Frequency Systems Remove the Usual Safety Margin

Eastern and western Japan operate at different frequencies with limited conversion capacity between them, so neither half can lean on the other the way interconnected European systems routinely do when a forecast proves wrong. Regional operators consequently need model precision that nationally balanced grids never demanded, because an error has nowhere to go. This is a permanent physical characteristic of the country's electricity system rather than a policy choice anybody could reverse. It makes Japanese modelling requirements genuinely different from comparable markets. No policy change can alter the physics of that arrangement at all.
Market Impact: Consumes 63% of project effort

Unbundling Created Entities Needing Separate Models

Generation and transmission separation completed in 2020 left organisations that had operated networks jointly for decades needing their own independent models of assets and behaviour they previously understood through shared institutional memory. That produced modelling demand with no technological cause at all, driven entirely by a change in who owns what. Similar unbundling elsewhere produced comparable effects at different times. The work is unglamorous, contractually obligatory and generates the steady baseline demand that funds more interesting modelling. Nobody enjoys this work and every affected organisation still has to complete all of it.
Market Impact: Achieves 91% model agreement

Market Restraints and Challenges

Asset Records Consume Most of Every Project

About 63% of project effort goes into preparing asset records compiled over decades in inconsistent formats, frequently with modifications never documented and equipment substitutions never recorded anywhere at all. The root cause is that nobody maintained records for a purpose that did not exist when they were created. Commercially this makes delivery expensive, unpredictable and the reason so many vendors lose money on projects they won on software price. Mitigation runs through separate record reconstruction pricing, which customers accept once the arithmetic is explained. Vendors keep discovering this during delivery rather than before it.
Market Impact: Loses 38% of engineers

Operators Will Not Decide on Modelled Results Alone

Model accuracy reaches around 91% agreement with measured network behaviour under good conditions, which is impressive technically and insufficient for an operator asked to approve a connection or a switching decision on it. The root cause is that the consequences of a wrong answer are severe and the accountability sits with a named engineer. Commercially this keeps models advisory and limits the efficiency gains that justified the investment. Suppliers mitigate through validation programmes and confidence reporting, which build trust slowly and cannot manufacture it. Accuracy improvement does not address what is really an accountability problem.
Market Impact: Shortens a 9 month study
3 additional market trends, 4 additional growth drivers, and 2 additional restraints and challenges are covered in the full report. Contact sales@marketmindsadvisory.com to access the complete intelligence.

Segment CAGR and Growth Architecture

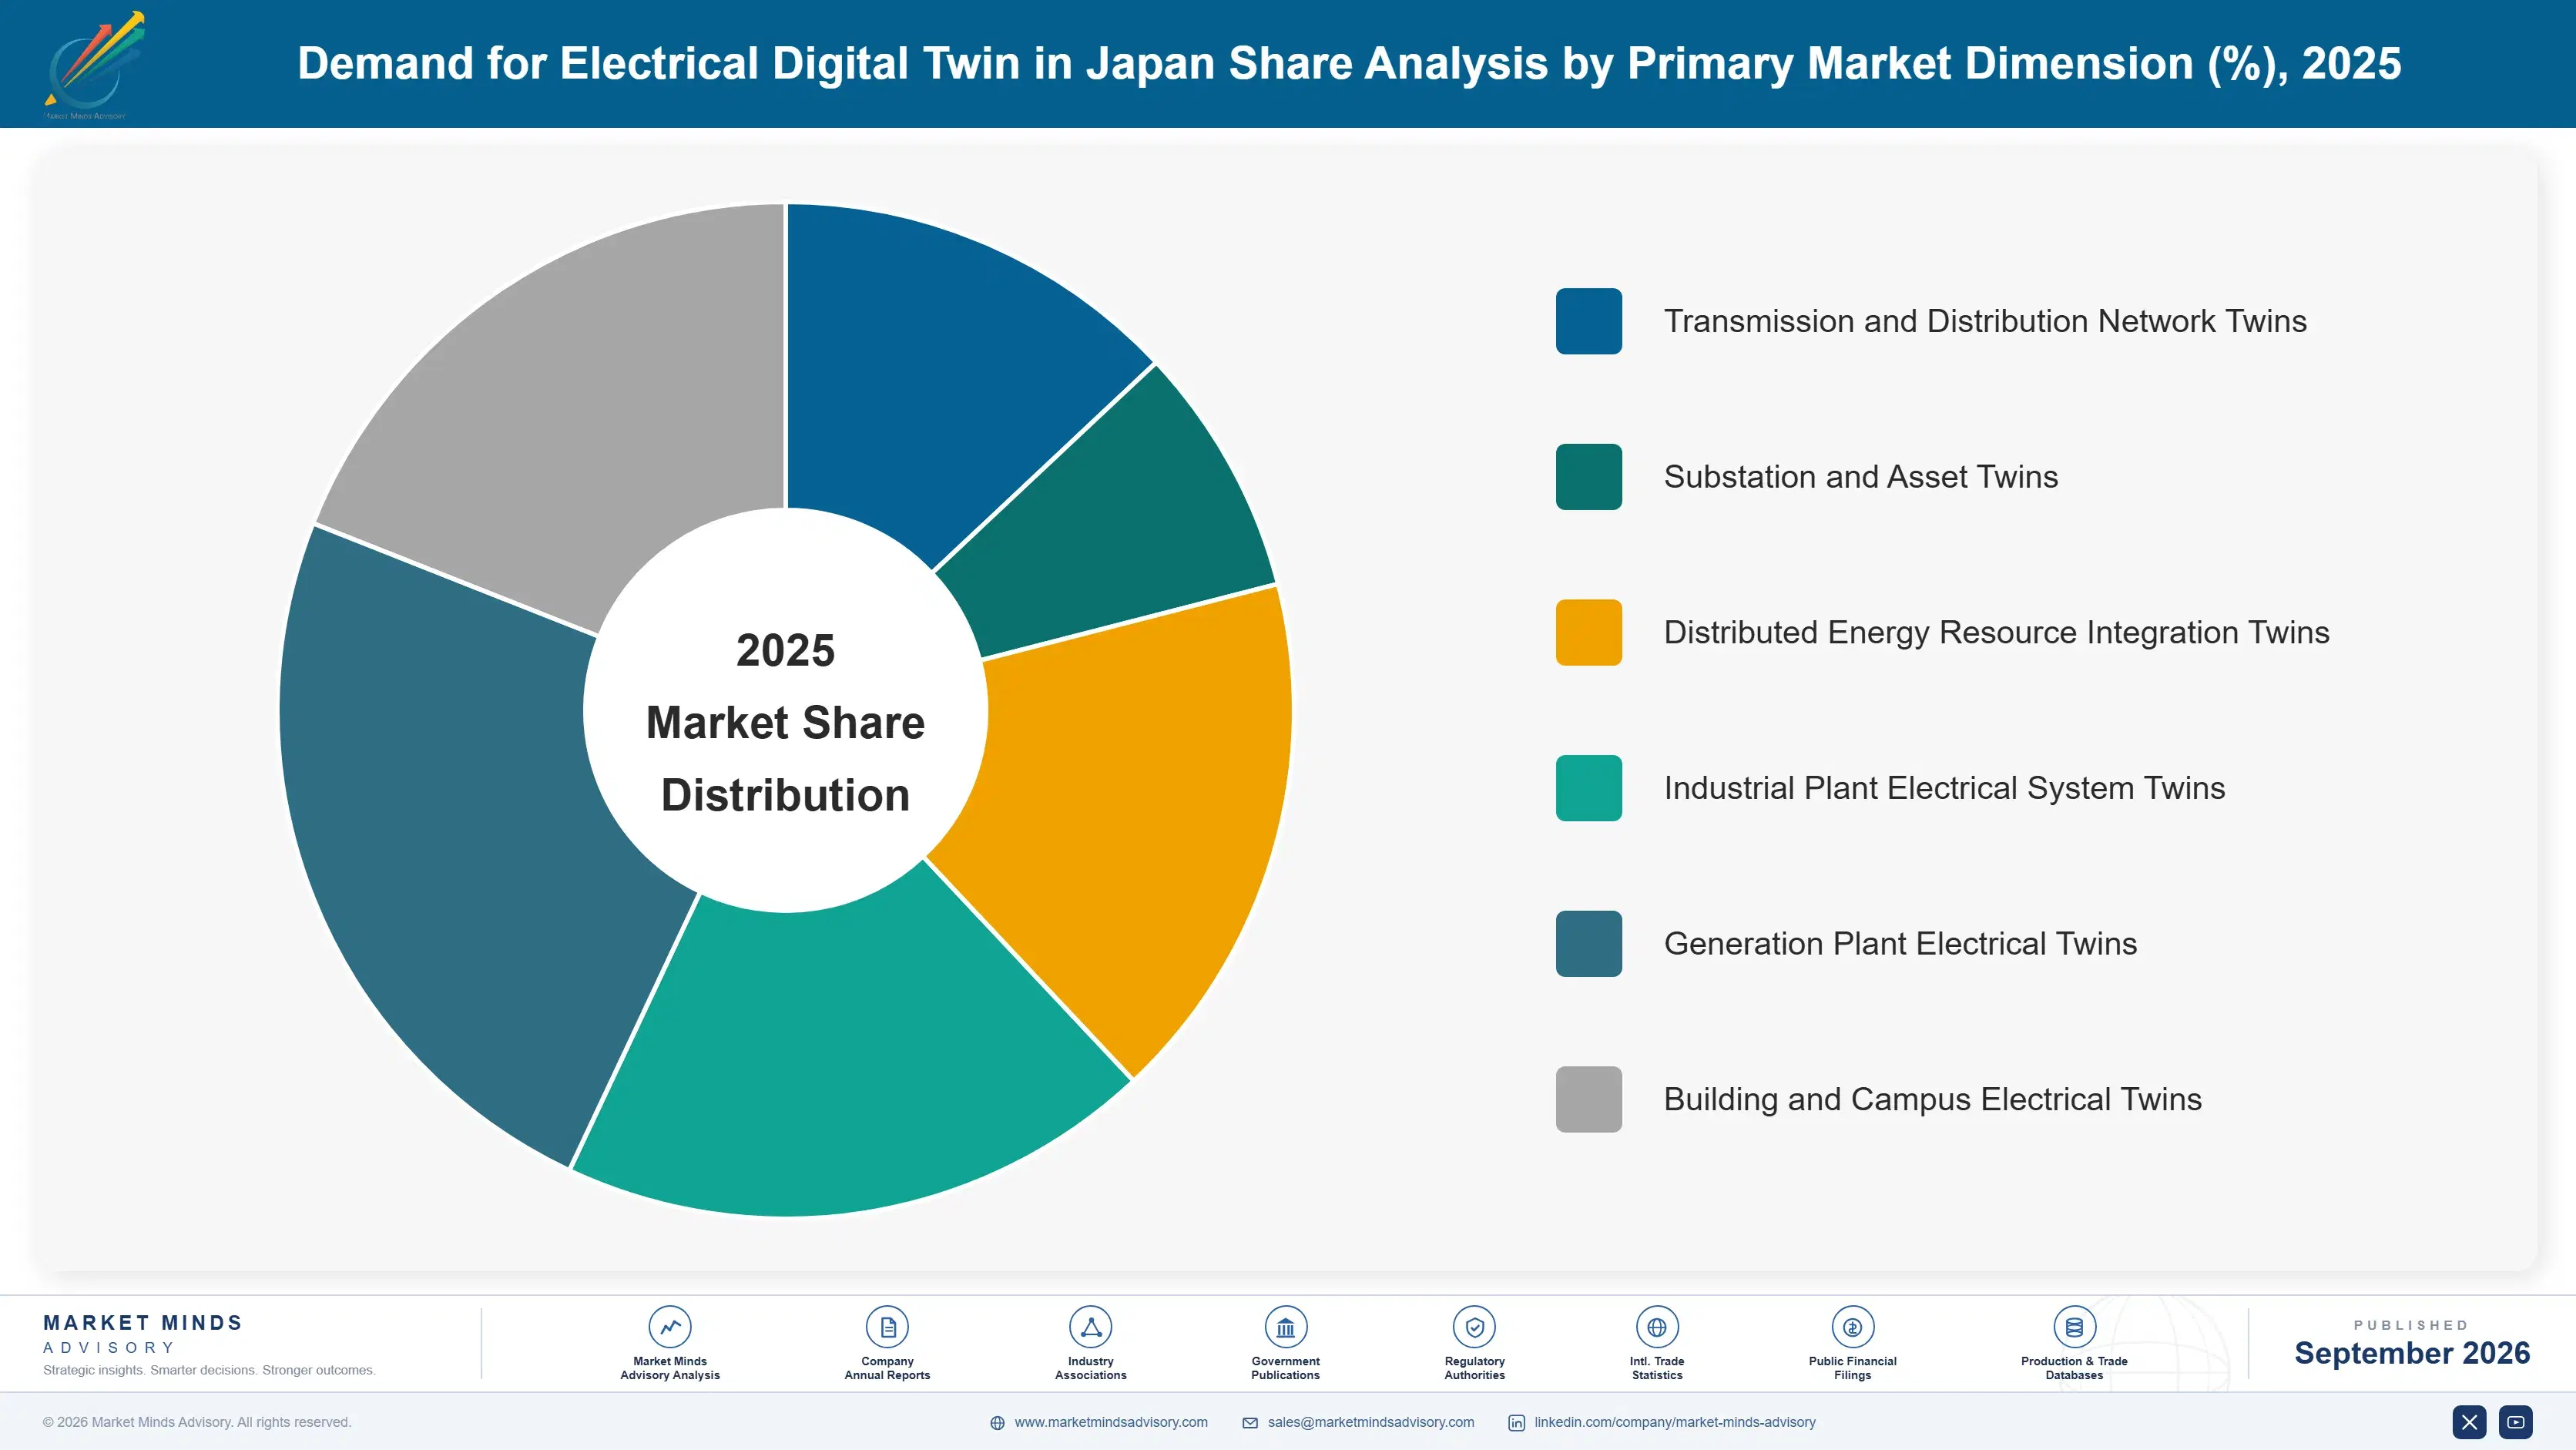
Segmentation follows the scope of the system being modelled, because scope determines who owns the asset data and how bad it is. A substation twin and a distribution network twin use similar mathematics and entirely different record quality, and record quality rather than modelling difficulty decides what a project costs to deliver and whether anybody earns anything.
japan-electrical-digital-twin-market-market-share-analysis-1788427255314

Distributed Energy Resource Integration Twins

Distributed resource integration grows at 22.8%, half again the market rate of 15.2%, because connection application volumes have overwhelmed manual assessment taking around 9 months per study and no operator can staff its way out of that backlog. Modelling is the only available route to shortening it. The constraint is institutional rather than technical: operators accept modelled assessments as advisory while remaining reluctant to approve connections on them alone, since accountability rests with a named engineer. Japanese operators face this with the added difficulty that their two frequency systems cannot absorb an assessment error for each other. Application volumes are rising faster than any operator can add assessment staff, whatever the budget allows.
CAGR 22.8%

Industrial Plant Electrical System Twins

Industrial plant twins grow at 18.4% because semiconductor, chemical and advanced manufacturing sites now carry electrical complexity that exceeds hand calculation for fault studies and expansion planning, and on-site generation and storage compound it further. The buyers are plant engineering functions rather than utility network teams, which means faster decisions, smaller budgets and considerably less tolerance for multi-year delivery. Record quality is generally better than utility records because plants are newer and modifications are documented for safety reasons. That single difference makes these projects meaningfully more profitable to deliver than network work. Decision cycles run in months rather than years, and the sales conversation happens with engineers who can approve spending themselves.
CAGR 18.4%
Full segment breakdown across 6 segments available in the complete report.

Regional Architecture and Country Demand Map

This report is Japan-centred within a global sizing frame, so regional shares describe where comparable modelling value is bought worldwide. Grid structure, unbundling timing and workforce demographics explain the pattern better than electricity demand does. Electricity consumption predicts almost nothing at all about where this software actually sells.

East Asia

East Asia holds 34%, above the regional band, because Japan is the analytical subject of this report and its modelling requirements are genuinely more demanding than comparable markets. Two frequency systems with limited conversion capacity mean regional operators cannot rely on a neighbouring system to absorb a forecast error, so precision matters in a way it does not elsewhere. Japanese demand grows at 14.8%, and workforce retirement is more acute here than in any other developed grid. Korean and Chinese demand follows large-scale renewable connection and industrial plant modelling on entirely different drivers. Record quality across older Japanese distribution assets is poor enough that data preparation regularly exceeds the 63% typical elsewhere, which several international vendors discovered expensively.
Share: 34% | CAGR: 16.2% (2026 to 2036)

North America

American demand is driven by interconnection queue backlogs that have become politically visible, with connection studies taking many months and application volumes that manual assessment cannot process at any realistic staffing level. Utility unbundling happened decades ago, so the model separation work Japan is completing now was done here long since. Workforce retirement is severe and receives less attention than the queue problem does. Growth at 16.0% runs ahead of the market on connection assessment and on industrial plant modelling across data centre and manufacturing construction. Record quality varies enormously between operators, and vendors quoting fixed prices without assessing it first took losses that shaped how the market now contracts. Succession framing arrived later here than in Japan.
Share: 26% | CAGR: 16.0% (2026 to 2036)
Regional intelligence for 5 additional markets available in the complete report: Western Europe, South Asia and Pacific, Latin America, Middle East and Africa, Eastern Europe. Contact sales@marketmindsadvisory.com.
japan-electrical-digital-twin-market-country-cagr-analysis-1788427255836

Pricing the Archaeology Honestly Instead

Every vendor in this market quotes a software price and delivers a record reconstruction project, then discovers that 63% of the effort was never in the proposal. The levers that work all start from that fact, and the ones that ignore it produce the same unprofitable delivery over and over again. Nothing else changes that.

Price Record Reconstruction as Separate Scope

About 63% of project effort goes into preparing asset records nobody maintained for this purpose, and vendors quoting a software licence with implementation attached have priced for a fifth of the actual work. Separating record reconstruction into its own priced scope, assessed before commitment, moves projects from loss-making to roughly 22% gross margin. Customers accept it once somebody explains why the first quote was wrong. Vendors continuing to absorb it are subsidising their customers' record keeping over decades. The assessment itself costs very little and changes the entire commercial shape of a project.
Market Impact: Moves projects toward roughly 22% gross margin overall

Sell Knowledge Capture, Not Operational Efficiency

Roughly 38% of grid engineers retire within a decade and the operating knowledge they hold was never documented, which makes a model a succession instrument rather than an efficiency tool. Proposals framed around capturing that knowledge before it leaves reach executives who control succession budgets, which are considerably larger and less contested than operational technology budgets. Approval rates on succession framing run around 2 times those on efficiency framing. The efficiency case is true and it reaches the wrong committee. Operational technology budgets were never remotely large enough for this work anyway.
Market Impact: Approves at around 2 times the usual rate

Target Industrial Plants Where Records Exist

Plant electrical records are generally better than utility records because facilities are newer and modifications are documented for safety compliance, which cuts data preparation well below the 63% that network projects carry. Industrial plant twins grow at 18.4% with faster decisions and smaller budgets, and gross margins run around 19 percentage points above network work once delivery cost is properly allocated. The buyers are plant engineers rather than utility committees. Vendors organised for utility selling reach them badly or not at all. The segment is larger than utility-focused vendors consistently estimate it to be.
Market Impact: Holds roughly 19 points more gross margin overall

Build Validation Evidence Before Selling Automation

Operators accept modelled results as advisory and will not approve connections or switching on them alone, because accuracy near 91% is impressive technically and insufficient when accountability rests with a named engineer. Vendors accumulating validated comparison against measured behaviour across many sites build the confidence record that eventually permits automated assessment. That evidence takes years to assemble and cannot be purchased. Suppliers selling automation before it exists damage the trust the whole segment depends upon. Operators talk to each other about which vendors overpromised, which makes the reputational cost of doing so unusually durable.
Market Impact: Validates models against roughly 91% measured network accuracy

Who Controls the Margin Pool

Concentration sits near 41% across the top five on measured software and delivery revenue, and the participants divide into two groups that compete awkwardly. Electrical equipment manufacturers bring asset knowledge, utility relationships and field engineering. Software vendors bring modelling depth and platform capability. Neither group naturally holds the record reconstruction capability that consumes most of a project, and both keep discovering that during delivery.
Competition runs on three dimensions. Delivery capability for data preparation is first and least discussed, since it determines whether a project earns anything. Second is validation evidence, because operators buy on demonstrated agreement with measured behaviour rather than on modelling sophistication. Third is asset domain knowledge, which equipment manufacturers hold naturally and software vendors must acquire through partnership or hiring.

Two pressures will move positions. Industrial plant modelling is growing faster than network work and rewards vendors who can sell to plant engineers rather than to utility committees, which is a different organisation entirely. Meanwhile Japanese equipment manufacturers hold domestic utility relationships and asset knowledge that international vendors cannot replicate, in a market where the frequency split makes local network understanding genuinely valuable.
japan-electrical-digital-twin-market-company-positioning-matrix-1788427256366

Competitive Moat and Risk Dimensions

HITACHI ENERGY

Moat: Asset knowledge and domestic position

Hitachi Energy combines grid equipment manufacturing with modelling capability, which means it understands the assets being modelled rather than treating them as data records to be ingested. Its Japanese heritage and utility relationships carry particular weight in a market where the frequency split makes local network understanding commercially valuable. Field engineering capability supports the record reconstruction that dominates project effort.
HITACHI ENERGY

Risk: Industrial plant channel reach

Industrial plant twins grow at 18.4% and sell to plant engineering functions through channels a utility-focused organisation reaches poorly, with faster decisions and smaller budgets than network work involves. Software vendors with process industry relationships are better positioned there. Equipment manufacturing origins also make platform-level software competition awkward against vendors building nothing but software.
SIEMENS

Moat: Modelling platform breadth

Siemens carries electrical modelling within a wider industrial software platform, which lets a customer connect electrical behaviour to process, mechanical and asset management models already in place. That integration matters most in industrial plants, where the fastest growth sits. Long relationships across both utility and industrial buyers reach the two groups this market divides into.
SIEMENS

Risk: Data preparation delivery cost

Record reconstruction consumes around 63% of project effort and is delivered largely through partners, which leaves quality and cost outside direct control on the part of the work that determines profitability. Utility asset records in older networks are far worse than industrial ones. Vendors pricing on platform value continue to underestimate this, and the losses appear during delivery.

Players Tracked

Prominent Players

Siemens
Hitachi Energy
Schneider Electric
GE Vernova
AspenTech

Other Key Players

ABB
Toshiba Energy Systems
Mitsubishi Electric
Fuji Electric
Meidensha
NTT Data
Hitachi
Bentley Systems
AVEVA
Dassault Systemes
Ansys
Manitoba Hydro International
DIgSILENT
Neplan
Emerson

Recent Developments

MARCH 2025

Utilities separate record reconstruction from modelling in procurement

Network operators began tendering asset record preparation as distinct scope from model construction, after several projects overran when data quality proved worse than either party had assumed at proposal. Vendors welcomed the change, having absorbed the cost previously. Neither party had assessed record quality before pricing the work.
Signal: Separating record work from modelling makes both parties confront the cost before commitment rather than afterwards.
JULY 2025

Japanese operators cite workforce succession in modelling business cases

Utility business cases increasingly named engineer retirement and knowledge capture as the primary justification for network modelling investment, rather than the operational efficiency arguments that had previously dominated. Approval came from executive rather than operational technology budgets. Operational technology budgets had never been large enough for the work.
Signal: Succession framing reaches the executive budgets that operational efficiency arguments have never been able to access.
NOVEMBER 2025

Connection assessment remains advisory despite improving model agreement

Operators continued requiring engineer review of modelled connection assessments even where agreement with measured behaviour exceeded ninety per cent, citing accountability rather than accuracy concerns. Study times shortened without the automation vendors had projected in their proposals. Vendors had projected full automation in their original proposals.
Signal: Accountability rather than accuracy is what keeps these models advisory, and no accuracy improvement addresses it.

What Delivery Actually Costs

Cost structure bears almost no relation to how these projects are priced. Data preparation, record reconstruction and validation together consume roughly 63% of delivery effort, while software development and platform engineering behave like ordinary subscription costs spread across a customer base. Field survey to establish what equipment is actually installed forms a further block appearing in no software business case.
Specialist delivery labour has been the sharpest pressure. People who understand both electrical network engineering and data reconstruction are scarce, and demand for them rose through 2024 and 2025 as adoption widened beyond early utility buyers. Hitachi and Siemens both referenced project delivery and personnel cost conditions in recent annual reporting. Vendors absorbed most of it, since delivery pricing is compared during selection and cannot be revised once committed.

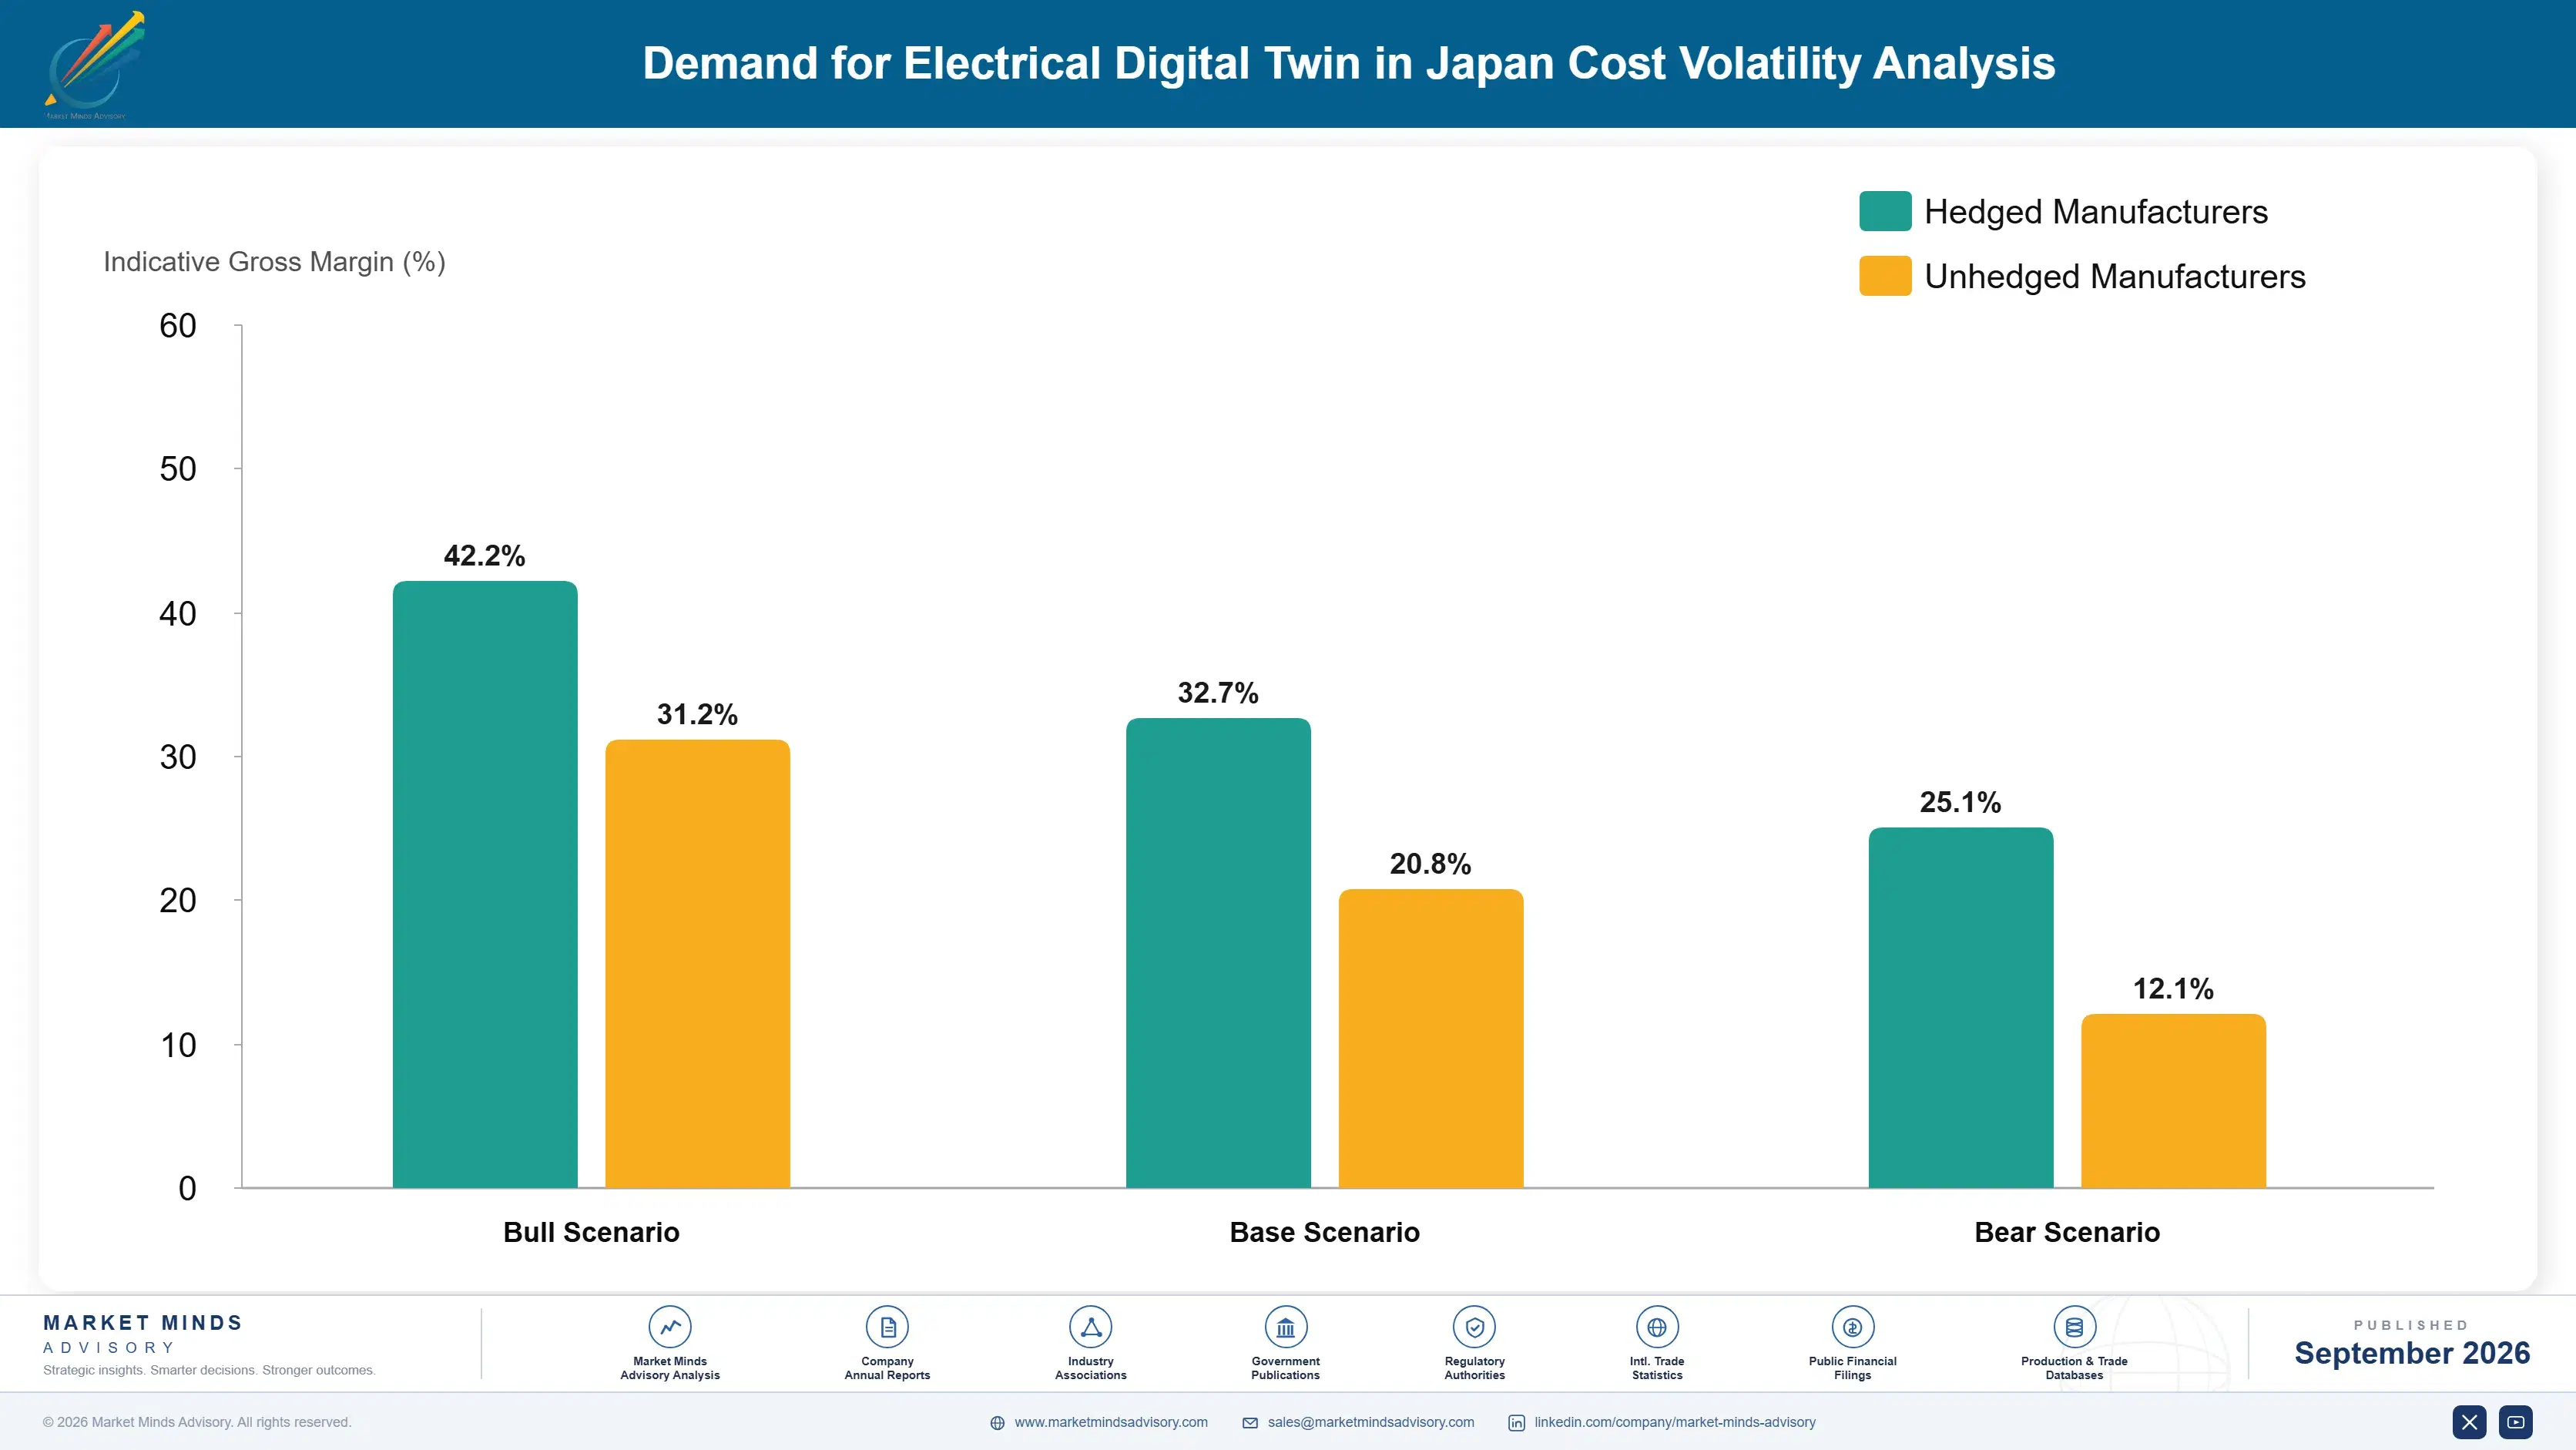
Exposure varies by delivery model rather than by scale. Vendors delivering directly carry full labour cost and control outcome quality. Those working through partners transfer cost and accept variable results that surface as overruns later. Vendors selling into industrial plants carry considerably less data preparation, since plant records are better maintained for safety compliance, which is why the same software earns very different margins depending on who bought it.
japan-electrical-digital-twin-market-cost-volatility-analysis-1788427256562

Assess record quality before quoting anything

Data preparation consumes around 63% of delivery effort and its extent cannot be estimated from a conversation, since utilities routinely believe their records are better than they are. A short paid assessment establishes actual scope and converts a fixed price gamble into a priced engagement. Customers resist paying for an assessment until somebody explains what the alternative quote must assume.

Build reusable record reconstruction tooling

Every project reconstructs asset records from the same handful of legacy formats, drawings and spreadsheet conventions, and most vendors approach each as bespoke consulting from the beginning. Tooling that parses common formats and flags inconsistencies cuts preparation effort by roughly 35%. The engineering investment is modest against the labour it removes, and it compounds with every project afterwards.

Weight industrial plant work in the delivery mix

Plant electrical records are maintained for safety compliance and are consequently far better than utility records, which cuts data preparation well below network projects and improves delivery margin. Building plant engineering sales capability alongside utility selling changes the mix, not the product. Vendors organised around utility procurement reach these buyers badly and conclude the segment is smaller than it is.

Portfolio Architecture for Margin Defence

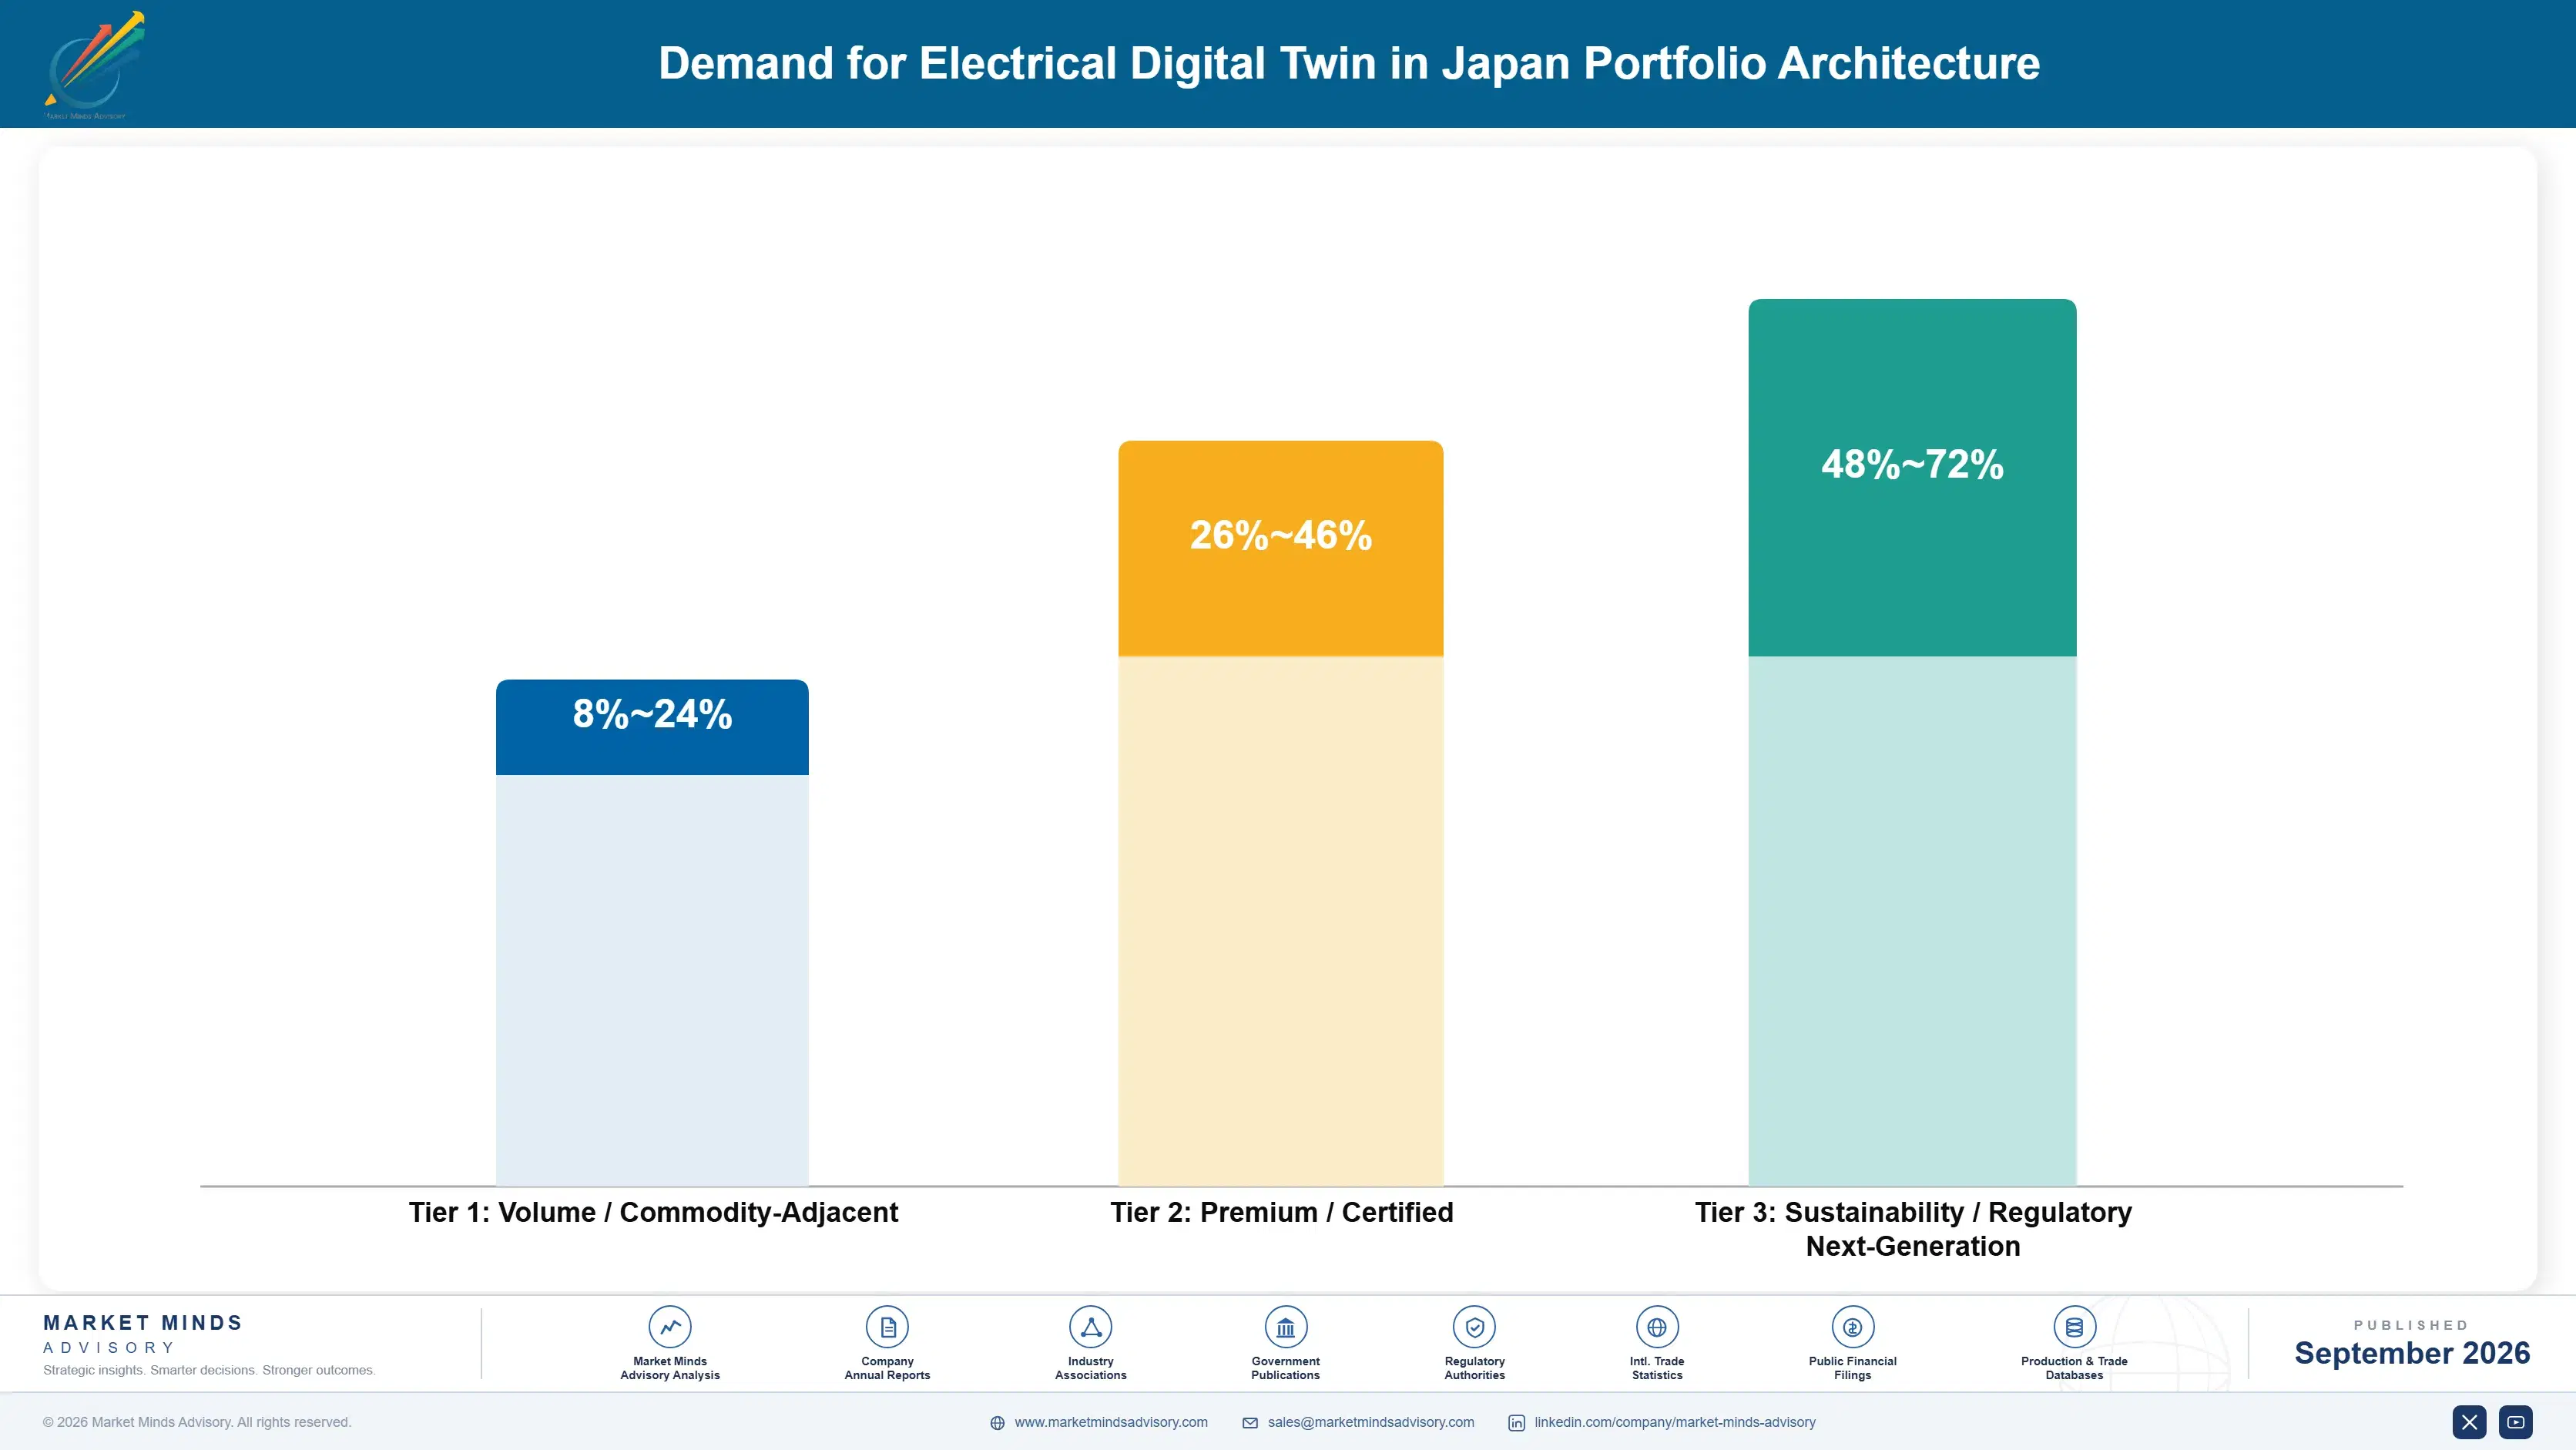
Margin architecture separates on record quality rather than on modelling scope. Network projects for older utilities carry data preparation at around 63% of effort and earn accordingly, which is to say frequently very little. Industrial plant projects carry better records and earn considerably more on identical software. New network construction, where records are current, is the most profitable delivery available and nobody plans a business around it.
The tension runs between software economics and delivery reality. Subscription revenue scales cleanly and looks like software, while the delivery required to make it useful scales with headcount and record quality nobody controls. Vendors pricing as software companies and delivering as consultancies produce the losses that characterise this market. Those pricing delivery separately look more expensive at proposal and are the only ones consistently earning anything on the work.

High-value revenue concentrates in industrial plant modelling and in recurring model maintenance. Maintenance recurs because a network changes continuously and a model that is not updated becomes actively misleading within a year or two. That recurrence is defended by the data preparation nobody wants to repeat, which makes displacing an incumbent genuinely expensive for a customer.

Volume / Commodity-Adjacent

Network modelling projects for older utilities where data preparation consumes most of the delivery effort. The range separates vendors with reconstruction tooling from those working bespoke. Fixed price commitments here are where most losses in this market originate.
Gross Margin: 8-24%

Premium / Certified

Industrial plant and new network construction modelling where asset records are maintained and current. Margin depends on record quality more than on any commercial term negotiated. The same software earns entirely different returns depending on the buyer.
Gross Margin: 26-46%

Sustainability / Regulatory / Next-Generation

Recurring model maintenance, validation services and distributed resource assessment subscriptions. The widest range in the portfolio, reflecting update frequency and how much reconstruction tooling a vendor has built. Highest margin and the hardest position to displace.
Gross Margin: 48-72%
japan-electrical-digital-twin-market-portfolio-architecture-1788427257068

High-value Sub-segments and Strategic Watch-out

Recurring Model Maintenance

High value with steady growth, recurring because a network changes continuously and an unmaintained model becomes actively misleading within a year or two. The range reflects update frequency and tooling maturity. It is defended by data preparation no customer wants to repeat with a new vendor.
Gross Margin: 50-72%

Industrial Plant Modelling

High value with strong growth at 18.4%, carrying far better asset records because plants document modifications for safety compliance. The range reflects site complexity and on-site generation content. Vendors organised for utility procurement reach these buyers badly and misjudge the segment's size consistently. Records are the difference.
Gross Margin: 30-48%

Utility Network Modelling

The volume core, where data preparation at around 63% of effort determines whether anything is earned at all. The range separates vendors with reconstruction tooling from those quoting bespoke consulting. It builds the reference base that everything else in the portfolio is sold against later.
Gross Margin: 7-23%

Fixed Price Legacy Network Projects

The strategic watch-out, where a vendor commits to a price before establishing record quality that utilities routinely overestimate about their own systems. Most losses in this market originate here. Several vendors have taken them repeatedly without ever changing how they quote the next one at all.
Gross Margin: 0-9%

Why Models Need Feeding

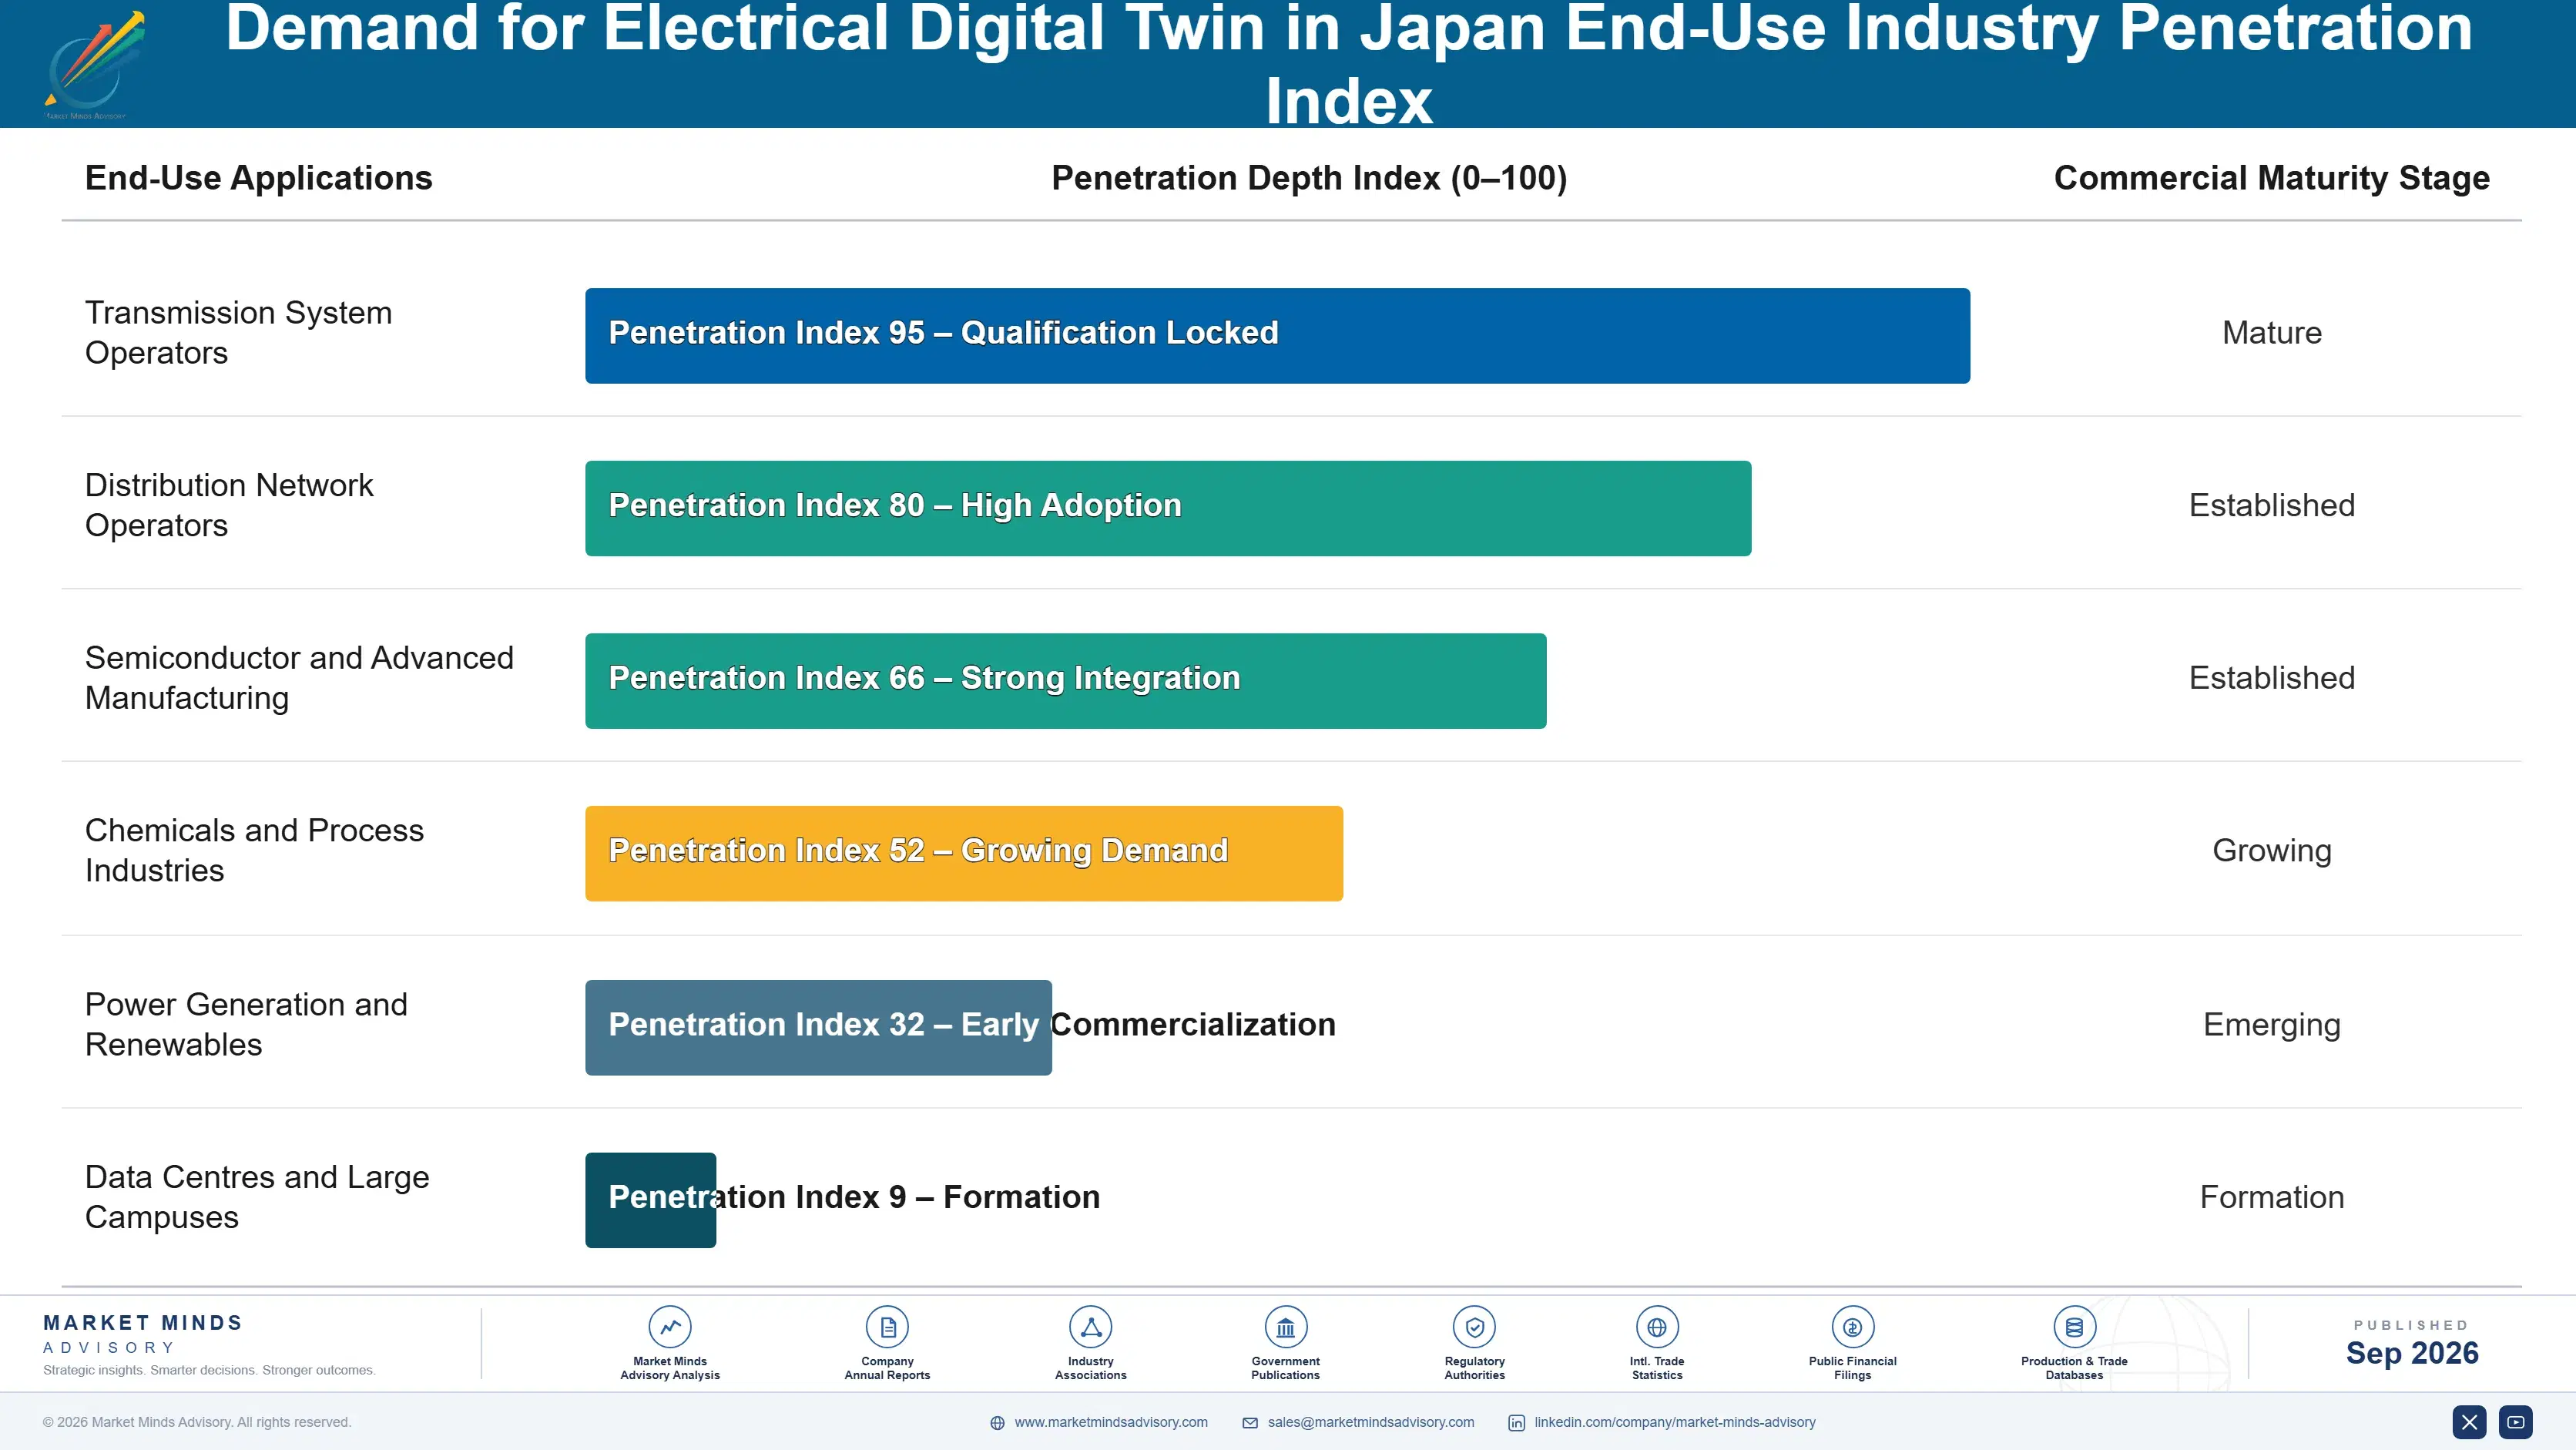
Recurrence comes from divergence rather than from renewal. A network changes continuously through connections, modifications and replacements, and a model that is not maintained stops matching reality within a year or two and becomes actively misleading rather than merely dated. That forces maintenance revenue whether or not anybody budgeted for it. Initial construction is a project; keeping the model true is a subscription nobody can cancel.
Adoption depth varies with how far the model has been embedded into operating process. A model consulted occasionally for planning studies can be abandoned quietly. A model feeding connection assessment, outage planning and asset replacement decisions becomes the record of the network, and reverting means going back to institutional memory that is retiring. Japanese operators sit toward the deeper end, since succession pressure pushed them to embed rather than merely to install.

The buyer has moved upward inside utilities. Network modelling was historically bought by planning departments from operational technology budgets, competing against equipment and control systems. Succession framing moved it toward executive sponsorship, where the argument is about institutional knowledge rather than about study efficiency. Vendors still presenting efficiency cases to planning engineers address people who want the system and cannot fund it.
japan-electrical-digital-twin-market-end-use-penetration-index-1788427257559

What Makes Delivery Pay

These are among the four positions where our research anticipates prominent divergence between winners and laggards over the coming forecast period. Each is grounded in the demand model, the regulatory perimeter, and the announced capacity pipeline.
01 / RECORD SCOPE SEPARATION

Price the archaeology separately or keep losing money

Roughly 63% of project effort goes into preparing asset records that nobody ever maintained for this purpose, so a vendor quoting a software licence with implementation attached has priced for about a fifth of the actual work involved in delivery. Separating record reconstruction into its own priced scope, assessed before commitment, moves projects from loss-making toward roughly 22% gross margin instead. Customers accept the change once somebody takes the trouble to explain why the original quote was wrong in the first place.
02 / SUCCESSION CASE FRAMING

Sell knowledge capture, not study efficiency

Around 38% of grid engineers retire within a decade and the operating knowledge they carry was never documented anywhere at all, which makes a network model a succession instrument rather than an efficiency tool. Proposals framed that way reach executives controlling succession budgets, which are larger and considerably less contested than operational technology budgets, and approval rates run around 2 times those achieved on efficiency framing. The efficiency case is entirely true and it reaches the wrong committee every single time.
03 / PLANT MIX WEIGHTING

Chase industrial sites where the records exist

Plant electrical records are maintained for safety compliance and are consequently far better than most utility records, cutting data preparation well below the 63% that network projects carry and lifting gross margin by around 19 percentage points on identical software licences. Industrial plant twins grow at 18.4% with faster decisions and smaller budgets attached to them throughout. The buyers are plant engineers rather than utility committees, and vendors organised for utility procurement reach them badly or not at all in practice.
04 / VALIDATION EVIDENCE BUILDING

Earn automation trust before selling it

Operators accept modelled results as advisory and refuse to approve connections on them alone, because accuracy near 91% agreement is technically impressive and insufficient when accountability rests with a named individual engineer signing it off. Vendors accumulating validated comparison against measured network behaviour across many different sites build the confidence record that eventually permits automated assessment, and that evidence takes years to assemble properly. Suppliers selling automation before the evidence exists damage trust the entire segment depends upon for years.

Engagement Snapshot From the Field

A live engagement with an industry participant carrying material or product regulatory and market exposure ahead of a defining policy shift, showing how our research translates into a defensible multi-year portfolio strategy.
MARKET MINDS ADVISORY · CLIENT ENGAGEMENT SUMMARY
Demand for Electrical Digital Twin in Japan Producer Strategic Portfolio Review and Transition Roadmap 2026·Investment Scenario on Demand for Electrical Digital Twin in Japan Exposure Evaluation 2025-26
CLIENT PROFILE
A regional electricity network operator serving approximately 2.1 million connections with roughly 14,000 kilometres of distribution network (client-reported, unverified by MMA). Two previous network modelling projects had overrun substantially, and a third vendor had recently quoted approximately USD 19 million for a programme the operator no longer trusted anybody to estimate honestly. Confidence was gone.
STRATEGIC CHALLENGE
Distributed generation connection applications had tripled in three years and manual assessment was taking around nine months per study, creating a backlog the operator could not staff its way out of. Both previous modelling projects had failed on asset data quality rather than on software. Nobody had established how bad the records actually were.
MMA APPROACH
MMA assessed asset record quality directly before evaluating any vendor proposal, sampling records across four substations and two hundred kilometres of feeder against physical inspection. We interviewed 21 planning, operations and records staff, reviewed both failed project histories, and separated data reconstruction scope from modelling scope in the resulting specification.
KEY FINDINGS
  1. Physical inspection found roughly 31% of sampled asset records inconsistent with installed equipment, mostly from modifications that were never recorded anywhere at the time.
  2. Both previous projects had been quoted as software implementations with no record reconstruction scope priced into either of them at any point at all.
  3. Two planning engineers holding most of the network's undocumented operating knowledge were within four years of retirement, and neither had documented any of it.
  4. Connection assessment could be shortened substantially without automation, since much of the nine months was waiting for records rather than performing analysis.
CLIENT PROFILE
A regional electricity network operator serving approximately 2.1 million connections with roughly 14,000 kilometres of distribution network (client-reported, unverified by MMA). Two previous network modelling projects had overrun substantially, and a third vendor had recently quoted approximately USD 19 million for a programme the operator no longer trusted anybody to estimate honestly. Confidence was gone.
STRATEGIC CHALLENGE
Distributed generation connection applications had tripled in three years and manual assessment was taking around nine months per study, creating a backlog the operator could not staff its way out of. Both previous modelling projects had failed on asset data quality rather than on software. Nobody had established how bad the records actually were.
MMA APPROACH
MMA assessed asset record quality directly before evaluating any vendor proposal, sampling records across four substations and two hundred kilometres of feeder against physical inspection. We interviewed 21 planning, operations and records staff, reviewed both failed project histories, and separated data reconstruction scope from modelling scope in the resulting specification.
KEY FINDINGS
  1. Physical inspection found roughly 31% of sampled asset records inconsistent with installed equipment, mostly from modifications that were never recorded anywhere at the time.
  2. Both previous projects had been quoted as software implementations with no record reconstruction scope priced into either of them at any point at all.
  3. Two planning engineers holding most of the network's undocumented operating knowledge were within four years of retirement, and neither had documented any of it.
  4. Connection assessment could be shortened substantially without automation, since much of the nine months was waiting for records rather than performing analysis.
RECOMMENDED STRATEGY
Phase 1: Commission record reconstruction as a separately priced programme before any modelling contract, since both previous failures originated there rather than in software. Phase 2: Capture the two retiring engineers' network knowledge through structured review of the reconstructed records while they remain available to correct what the records get wrong. Phase 3: Retender modelling scope only after record quality is established, since no vendor can price the work honestly without knowing it.
OUTCOME
Record reconstruction cost roughly USD 6 million and the subsequent modelling contract came in near USD 8 million against the USD 19 million originally quoted (client-reported, unverified by MMA). Connection assessment time fell to about four months on records alone, before any model was operating, and both engineers completed knowledge capture before retiring.

Frequently Asked Questions

Foundational context covering the market sizes, CAGR, scope, country, region and competition that inform every finding below. This section is provided to cover basics and most often pre-purchase conversations, answered from the MMA Primary Research Dataset.

What is the current size of the Demand for Electrical Digital Twin in Japan?

The market was worth USD 3.6 billion in 2025 and reaches USD 4.15 billion in 2026 on a global sizing frame. Japan is the analytical centre of this report.

How large will the Demand for Electrical Digital Twin in Japan be by 2036?

MMA forecasts USD 17.08 billion by 2036, an expansion of 4.12 times over the forecast period. That represents USD 12.93 billion of incremental annual revenue against 2026.

What is the CAGR for the Demand for Electrical Digital Twin in Japan 2026 to 2036?

The base case is 15.2% compound annual growth, with a bull case at 16.4% and a bear case at 14.0%. Japanese demand specifically grows at 14.8% across the period.

Which segment is growing fastest?

Distributed energy resource integration twins grow at 22.8%, half again the market rate of 15.2%. Connection studies taking about nine months cannot process the application volumes arriving.

Who are the major companies in the Demand for Electrical Digital Twin in Japan?

Siemens, Hitachi Energy, Schneider Electric, GE Vernova and AspenTech lead on measured software and delivery revenue. Together they hold roughly 41%, split between equipment manufacturers and software vendors.

Which country is growing fastest?

India grows fastest at 18.6%, on grid expansion, renewable connection and industrial construction proceeding together, though poor asset records make delivery there considerably more expensive.

Report Segmentation Architecture

The full report scope spans multiple orthogonal segmentation dimensions, with cross-tabulated demand data provided for each dimension pair. Coverage extends further to regional breakdowns, trend trajectories, and the competitive detail needed to support segment-level decision-making.

By Primary Market Dimension

  • Transmission and Distribution Network Twins
  • Substation and Asset Twins
  • Distributed Energy Resource Integration Twins
  • Industrial Plant Electrical System Twins
  • Generation Plant Electrical Twins
  • Building and Campus Electrical Twins

By End-Use Industry

  • Transmission System Operators
  • Distribution Network Operators
  • Semiconductor and Advanced Manufacturing
  • Chemicals and Process Industries
  • Power Generation and Renewables
  • Data Centres and Large Campuses

By Commercial Dimension

  • Utility Programme Contracts
  • Industrial Plant Direct Purchase
  • Record Reconstruction Engagements
  • Recurring Model Maintenance Subscriptions
  • Systems Integrator Delivery
  • Equipment Manufacturer Bundled Supply

By Region

  • East Asia
  • North America
  • Western Europe
  • South Asia and Pacific
  • Latin America
  • Middle East and Africa
  • Eastern Europe

Scope, Methodology, and Coverage

Every figure in this report is reproducible from documented input assumptions. The scope below maps the historical period, the forecast horizon, the segmentation dimensions, and the countries covered, alongside the underlying primary and qualitative methodology.
Historical Period
2020 to 2025
Forecast Period
2026 to 2036
Base Year
2025 (USD billions; MMA Primary Research Dataset, September 2026)
Market Definition
This market covers software and associated delivery services that construct and maintain live computational models of electrical systems, spanning transmission and distribution network twins, substation and asset twins, distributed energy resource integration twins, industrial plant electrical system twins, generation plant electrical twins, and building and campus electrical twins. Revenue is measured as licence, subscription and attributable implementation, record reconstruction and maintenance value at supplier level, with Japan treated as the analytical centre within a global sizing frame required by the seven-region reporting structure. Physical sensing and metering hardware, supervisory control and data acquisition systems, general enterprise asset management software, market trading platforms, and mechanical or process simulation without electrical modelling are excluded from scope.
Quantitative Units
USD billions, licence, subscription and attributable delivery revenue at supplier level
Segmentation Dimensions
Modelled system scope, end-use industry, commercial model, region
Regions Covered
East Asia, North America, Western Europe, South Asia and Pacific, Latin America, Middle East and Africa, Eastern Europe
Countries Covered
Japan, South Korea, China, Taiwan, Singapore, India, Australia, Vietnam, Thailand, United States, Canada, Mexico, Brazil, Chile, Colombia, Germany, United Kingdom, France, Netherlands, Denmark, Sweden, Norway, Spain, Italy, Poland, Romania, Czechia, United Arab Emirates, Saudi Arabia, Egypt, South Africa
Key Companies Profiled
Siemens, Hitachi Energy, Schneider Electric, GE Vernova, AspenTech, ABB, Toshiba Energy Systems, Mitsubishi Electric, Fuji Electric, Meidensha, NTT Data, Hitachi, Bentley Systems, AVEVA, Dassault Systemes, Ansys, Manitoba Hydro International, DIgSILENT, Neplan, Emerson
Quantitative Methodology
Primary survey, n=3,800 respondents, Q4 2025, six countries; demand-side model with trade association cross-validation
Qualitative Methodology
47 expert interviews, Q4 2025; applied to validate demand model assumptions, identify emerging dynamics, and assess competitive positioning
Report Format
PDF and XLSX data workbook (Word format preview document)
Publisher
Market Minds Advisory
Report Code
MMA-2026-ENE-621
Published
September 2026
Contact
sales@marketmindsadvisory.com | www.marketmindsadvisory.com

Purchase the full Demand for Electrical Digital Twin in Japan Report (2026 to 2036).

The full MMA report treats electrical modelling as a record reconstruction business that sells itself as software, and explains why Japanese demand rests on a split grid and a retiring workforce rather than on efficiency. It sizes the market to 2036 across six modelling scopes, seven regions and 31 countries, with segment growth rates and regional demand mechanisms set out throughout. Competitive analysis covers 20 suppliers assessed on measured software and delivery revenue, with moat and risk assessment for the two leaders. The report quantifies delivery cost structure, record quality economics and margin architecture across three portfolio tiers. It closes with four verdicts and an anonymised network operator engagement.
Six modelling scopes sized through 2036
Seven regions with demand mechanism analysis
Twenty suppliers on consistent revenue basis
Data preparation and study time benchmarks
Margin architecture across three portfolio tiers
Anonymised network operator modelling programme engagement

Built For The People Who Decide

From boardroom strategy to bench-side execution, this report is read cover-to-cover by leaders shaping the next decade of their industry, turning demand scenarios, market dynamics and valuation benchmarks into decisions.
CXOs/ Presidents/ VPs/ Managers
M&A and Corporate Development
Strategy Teams and R&D Heads
Procurement and Product Directors
Regulatory and Compliance Leaders
Investor Relations and Equity Analysts