
Market Minds Advisory
Hematology Diagnostics Market

Hematology Diagnostics Market: The Lab Analyzer Became A Managed Service

A commercial reading of blood cell analysis instruments and reagents, where labs increasingly buy analyzer access bundled with consumables rather than owning equipment outright, and flow cytometry demand from oncology diagnostics is reshaping the category.

Lead Analyst

Alice Ballenger

Published

September 2026

Make Smarter Decisions with Customized Research Insights

Request a free sample report and evaluate market opportunities, growth trends, and competitive dynamics relevant to your business needs.

2025 MARKET VALUE$6.8BMarket Size 2025
2036 FORECAST VALUE$13.5BBase Case , 2026 to 2036
CAGR 2026 TO 20366.4 %Bull 7.6% / Bear 5.1%
INCREMENTAL OPPORTUNITY$6.2BNet 10- year value creation
EXPANSION MULTIPLE1.86x2036 value over 2026 base
Strategic Levers
M&A Pipeline
Regional Outlook
Country Rankings
Competitive Intelligence
Segmental Deep-dive
Call-Us : 91 93563 13602

Executive Snapshot and Market Trajectory

Labs stopped buying hematology analyzers as capital equipment and started renting throughput instead. A reagent rental agreement that bundles the instrument for free against a per-test consumable commitment now wins more tenders than a straight equipment purchase, and that shift has quietly rewritten how the whole category prices itself.
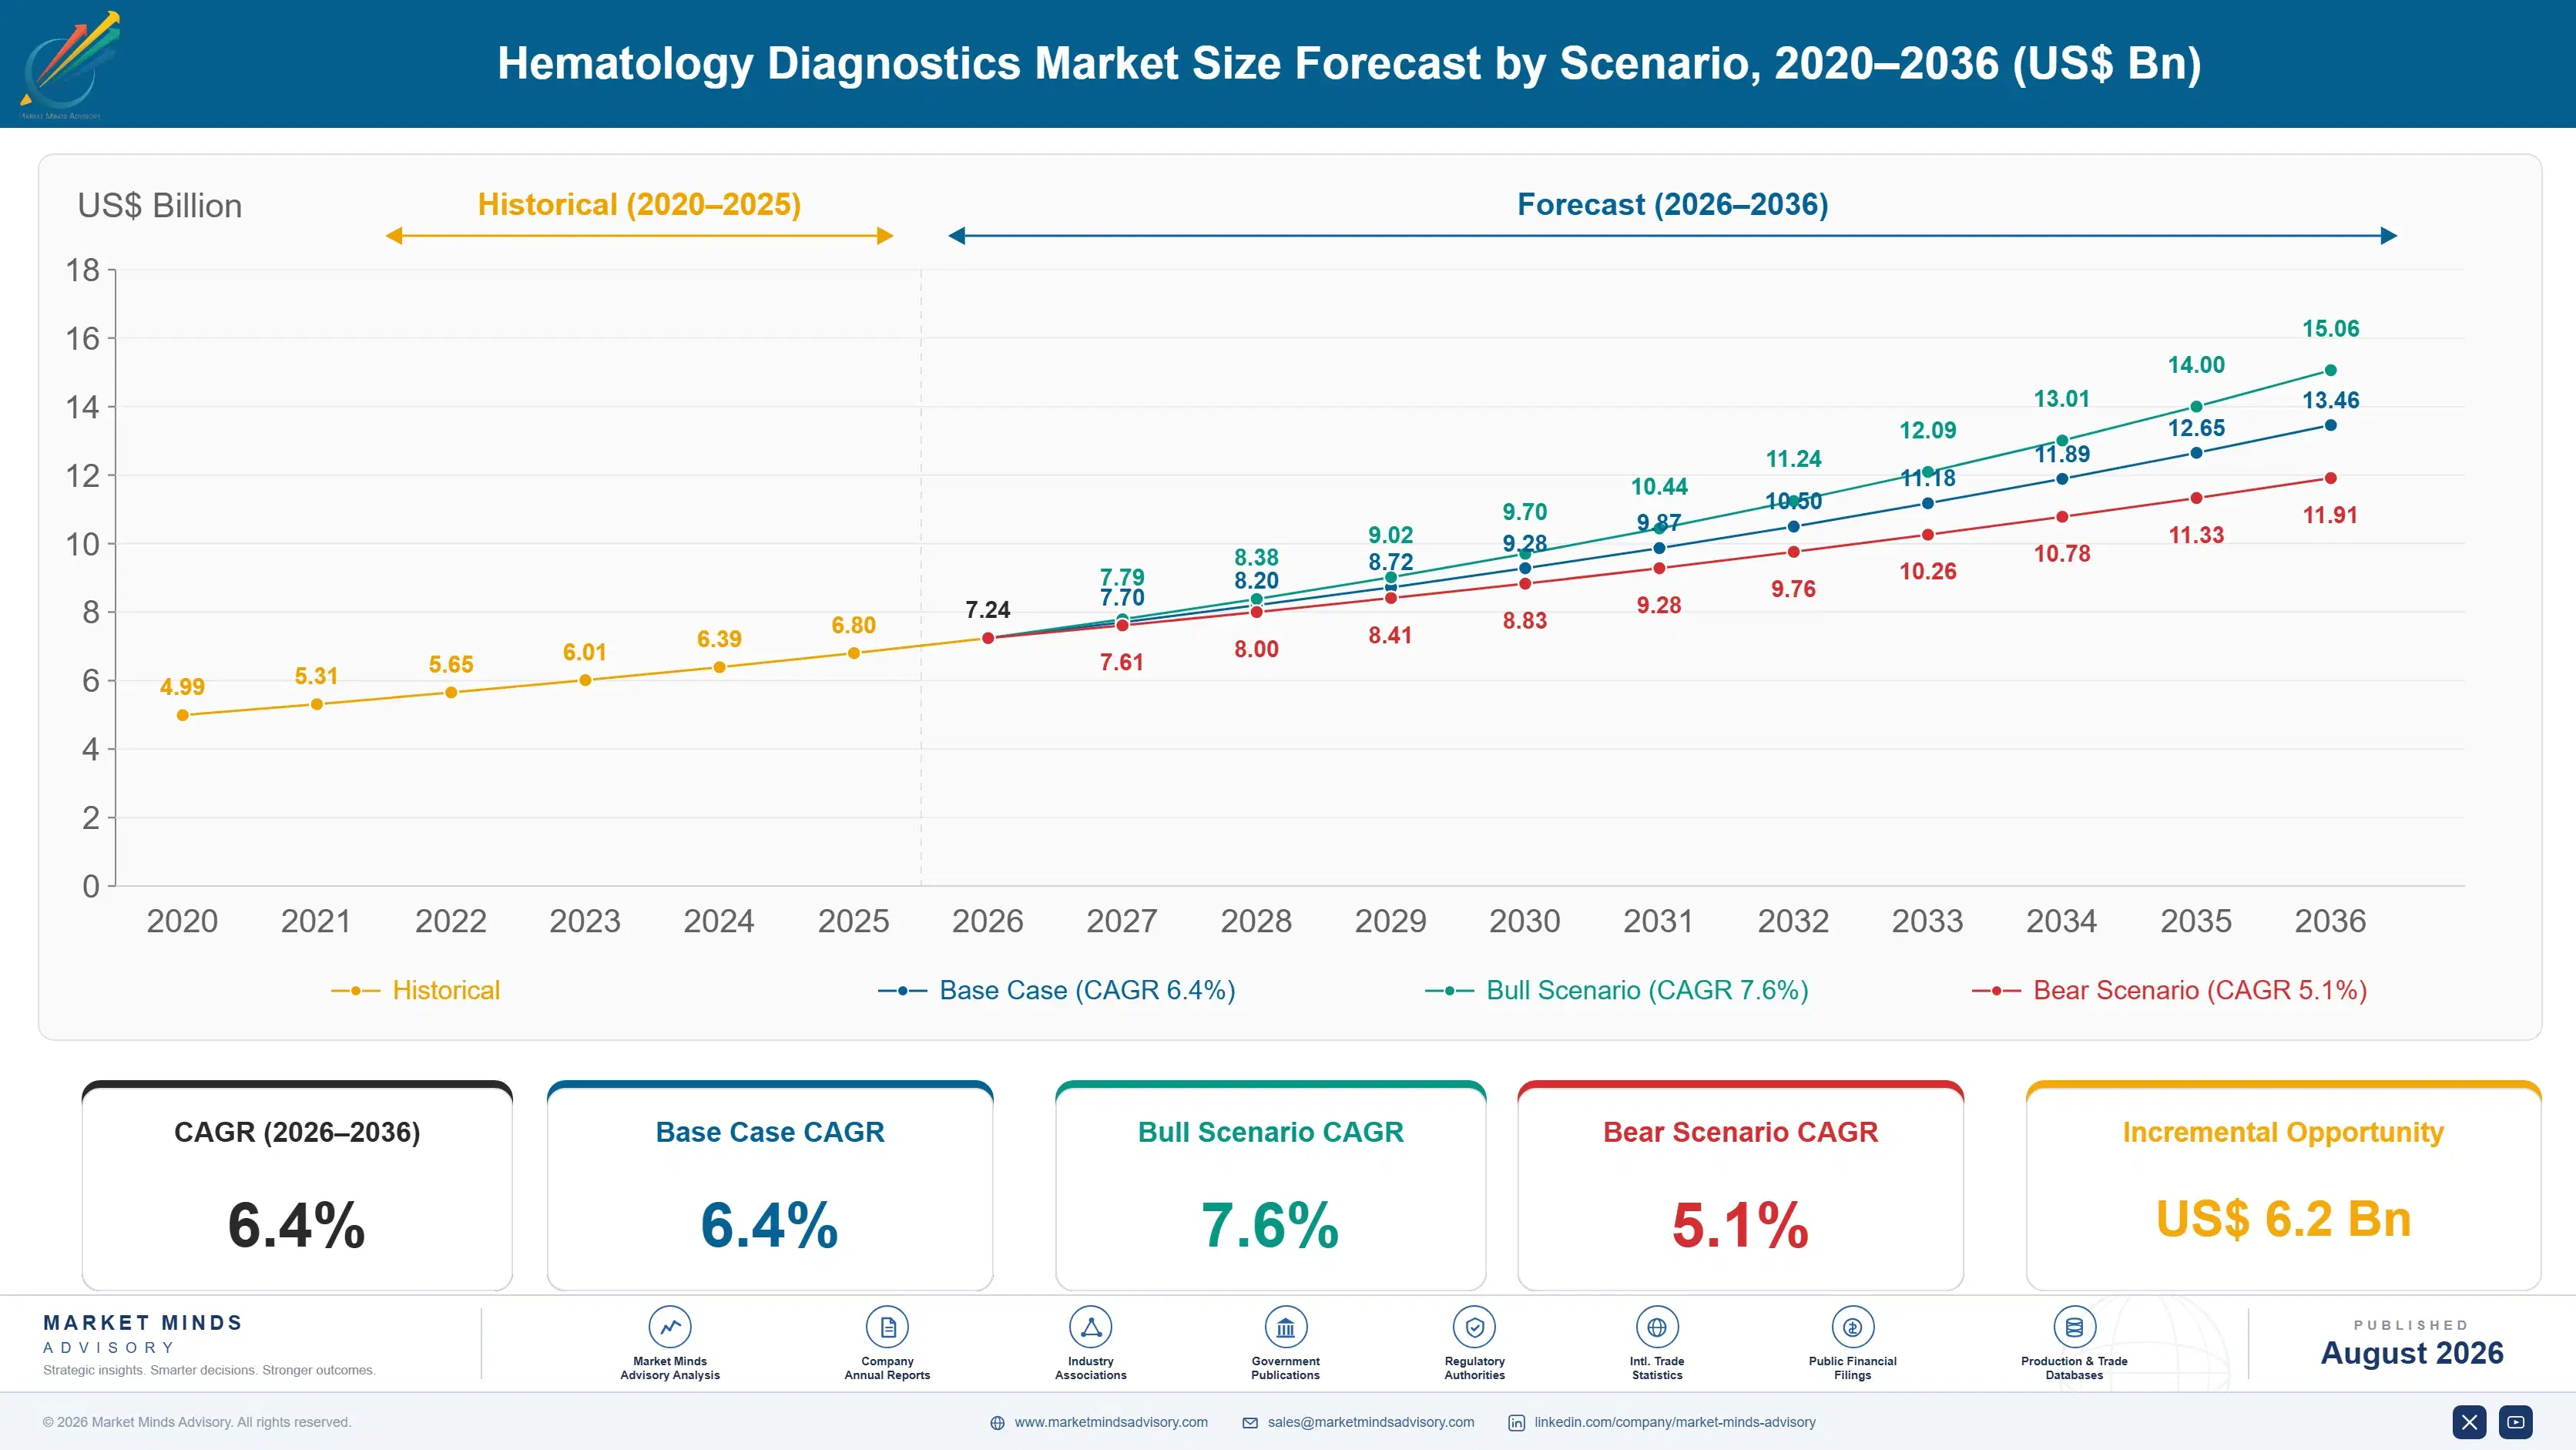
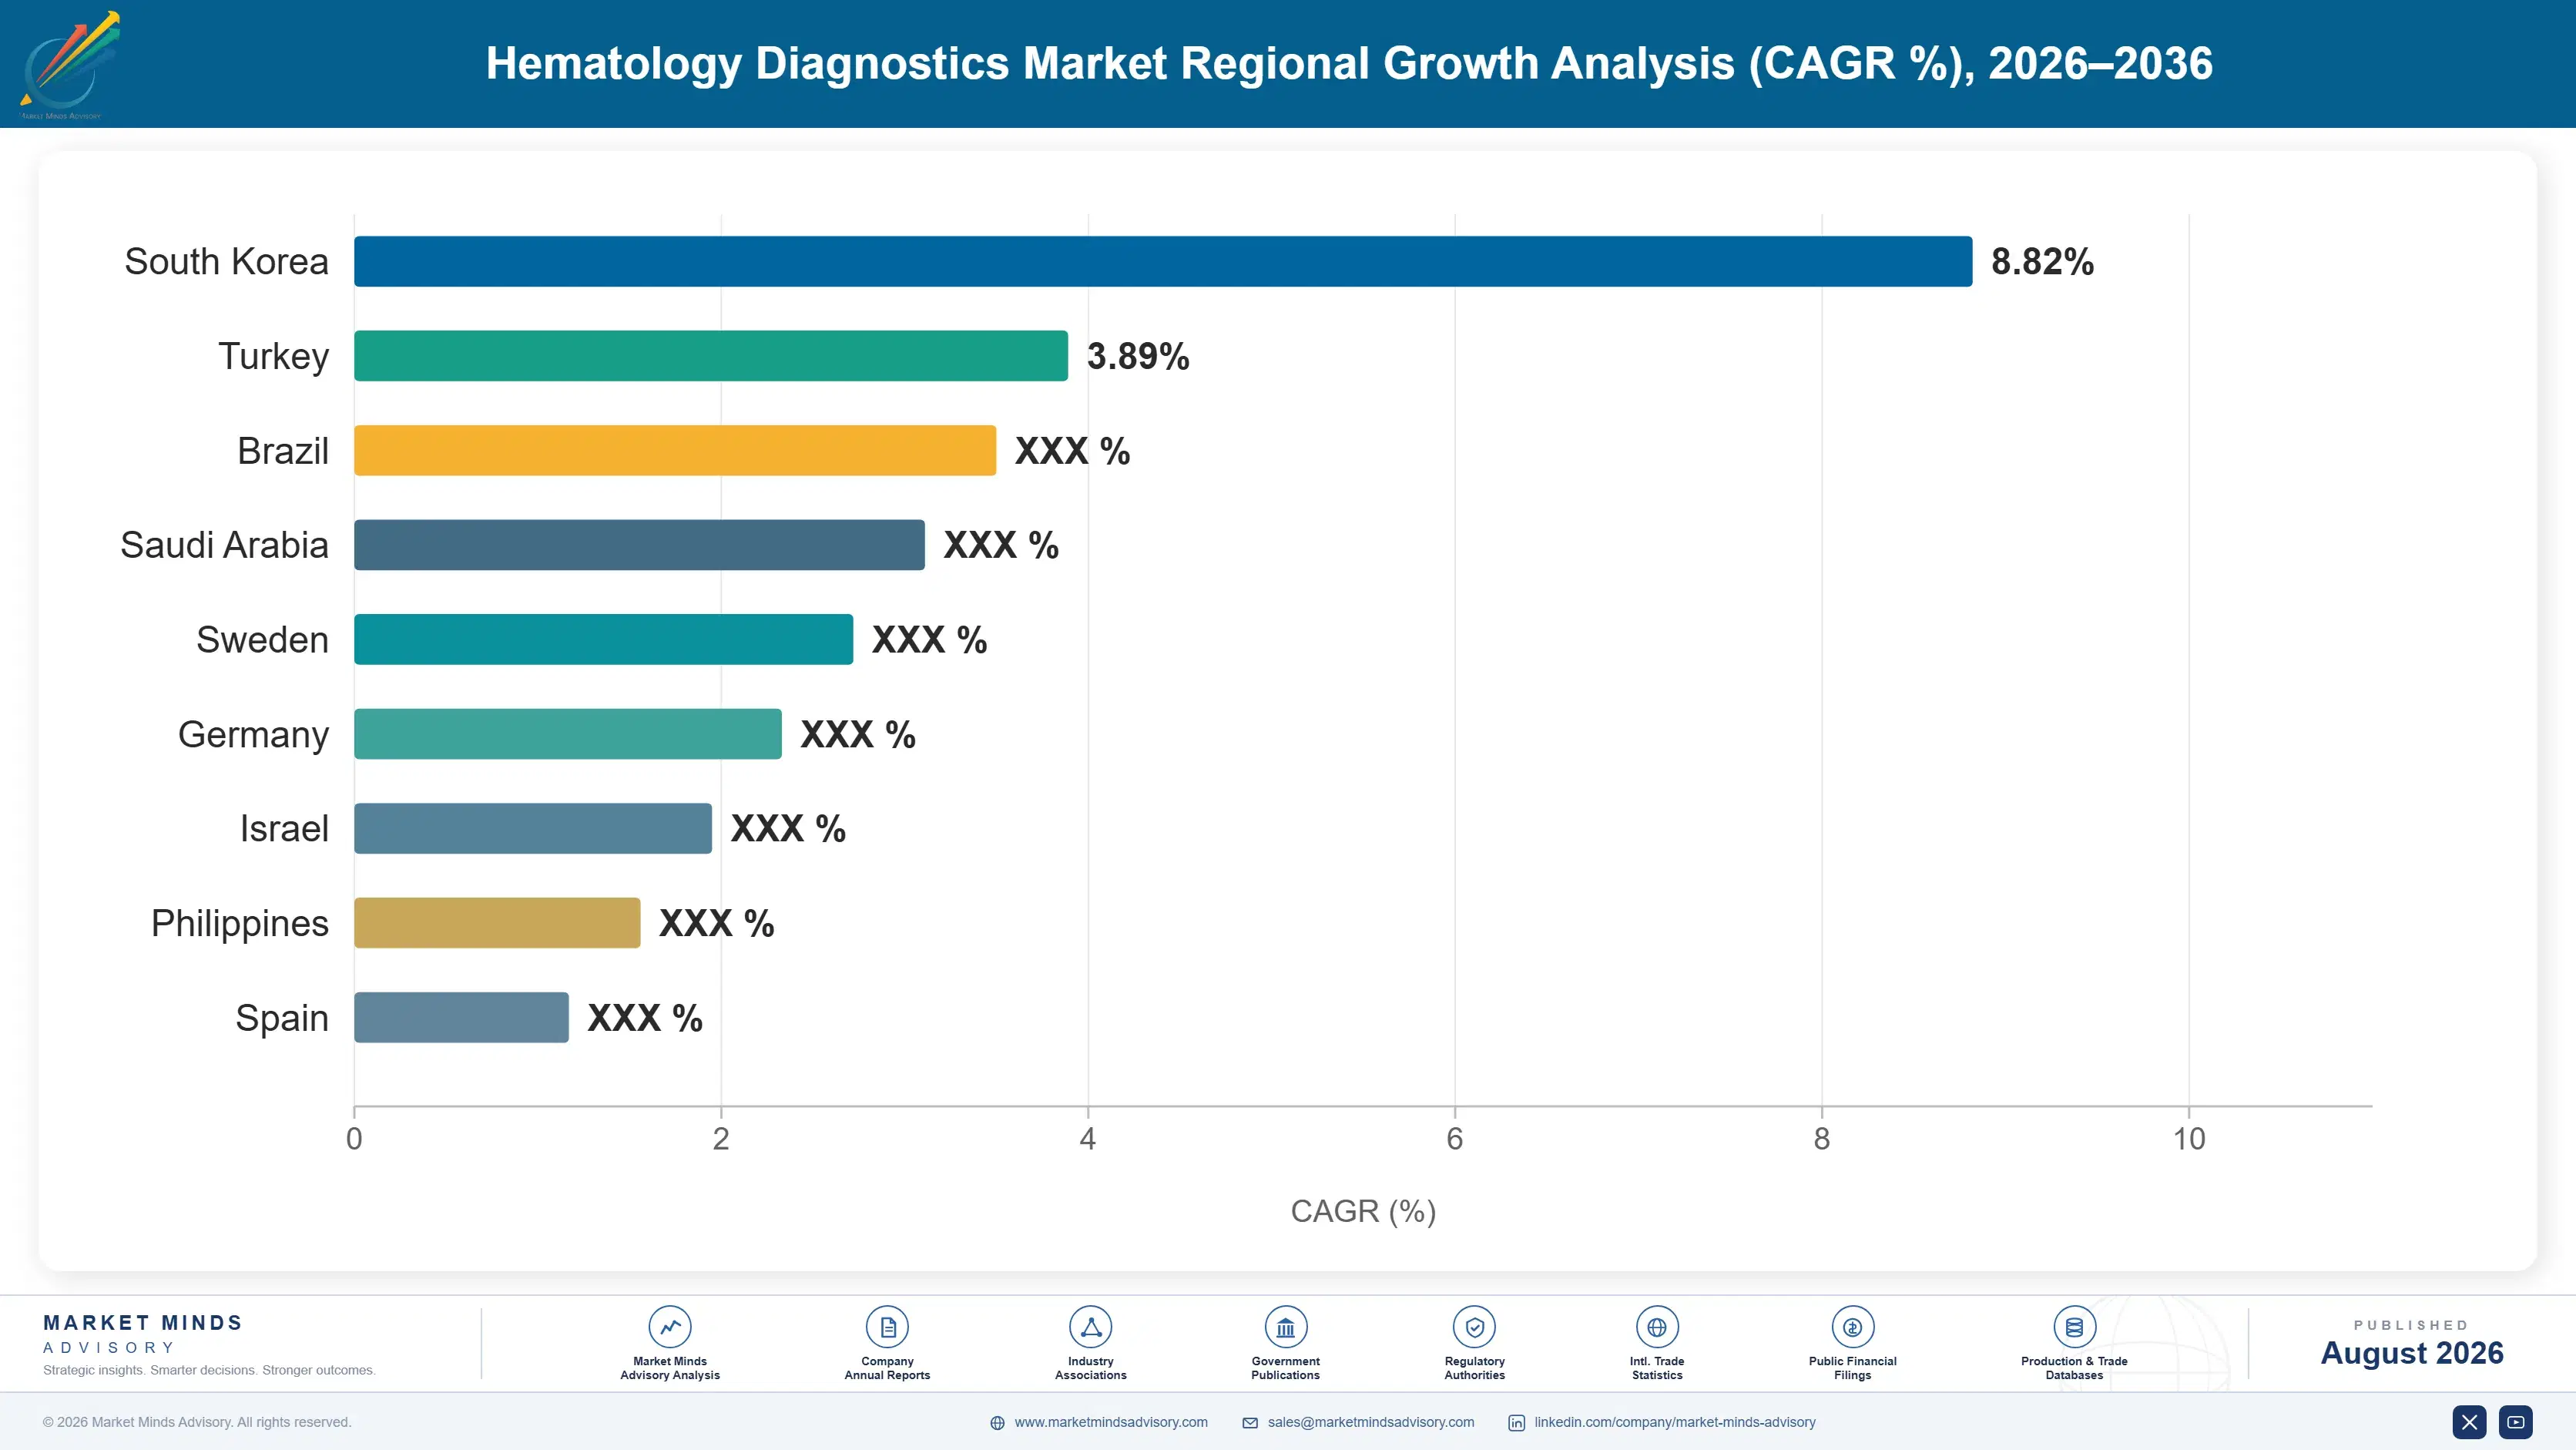
The market stands at USD 6.8 billion in 2025 and reaches USD 13.46 billion by 2036 at a 6.4% CAGR. Flow cytometry systems grow fastest at 8.9%, about 1.39 times the overall rate, as expanding oncology and immunology diagnostic protocols pull cytometry deeper into routine hematology workflows across most markets today. India posts the quickest national growth at 8.6% as laboratory infrastructure expansion brings automated testing to facilities that previously ran manual differential counts.
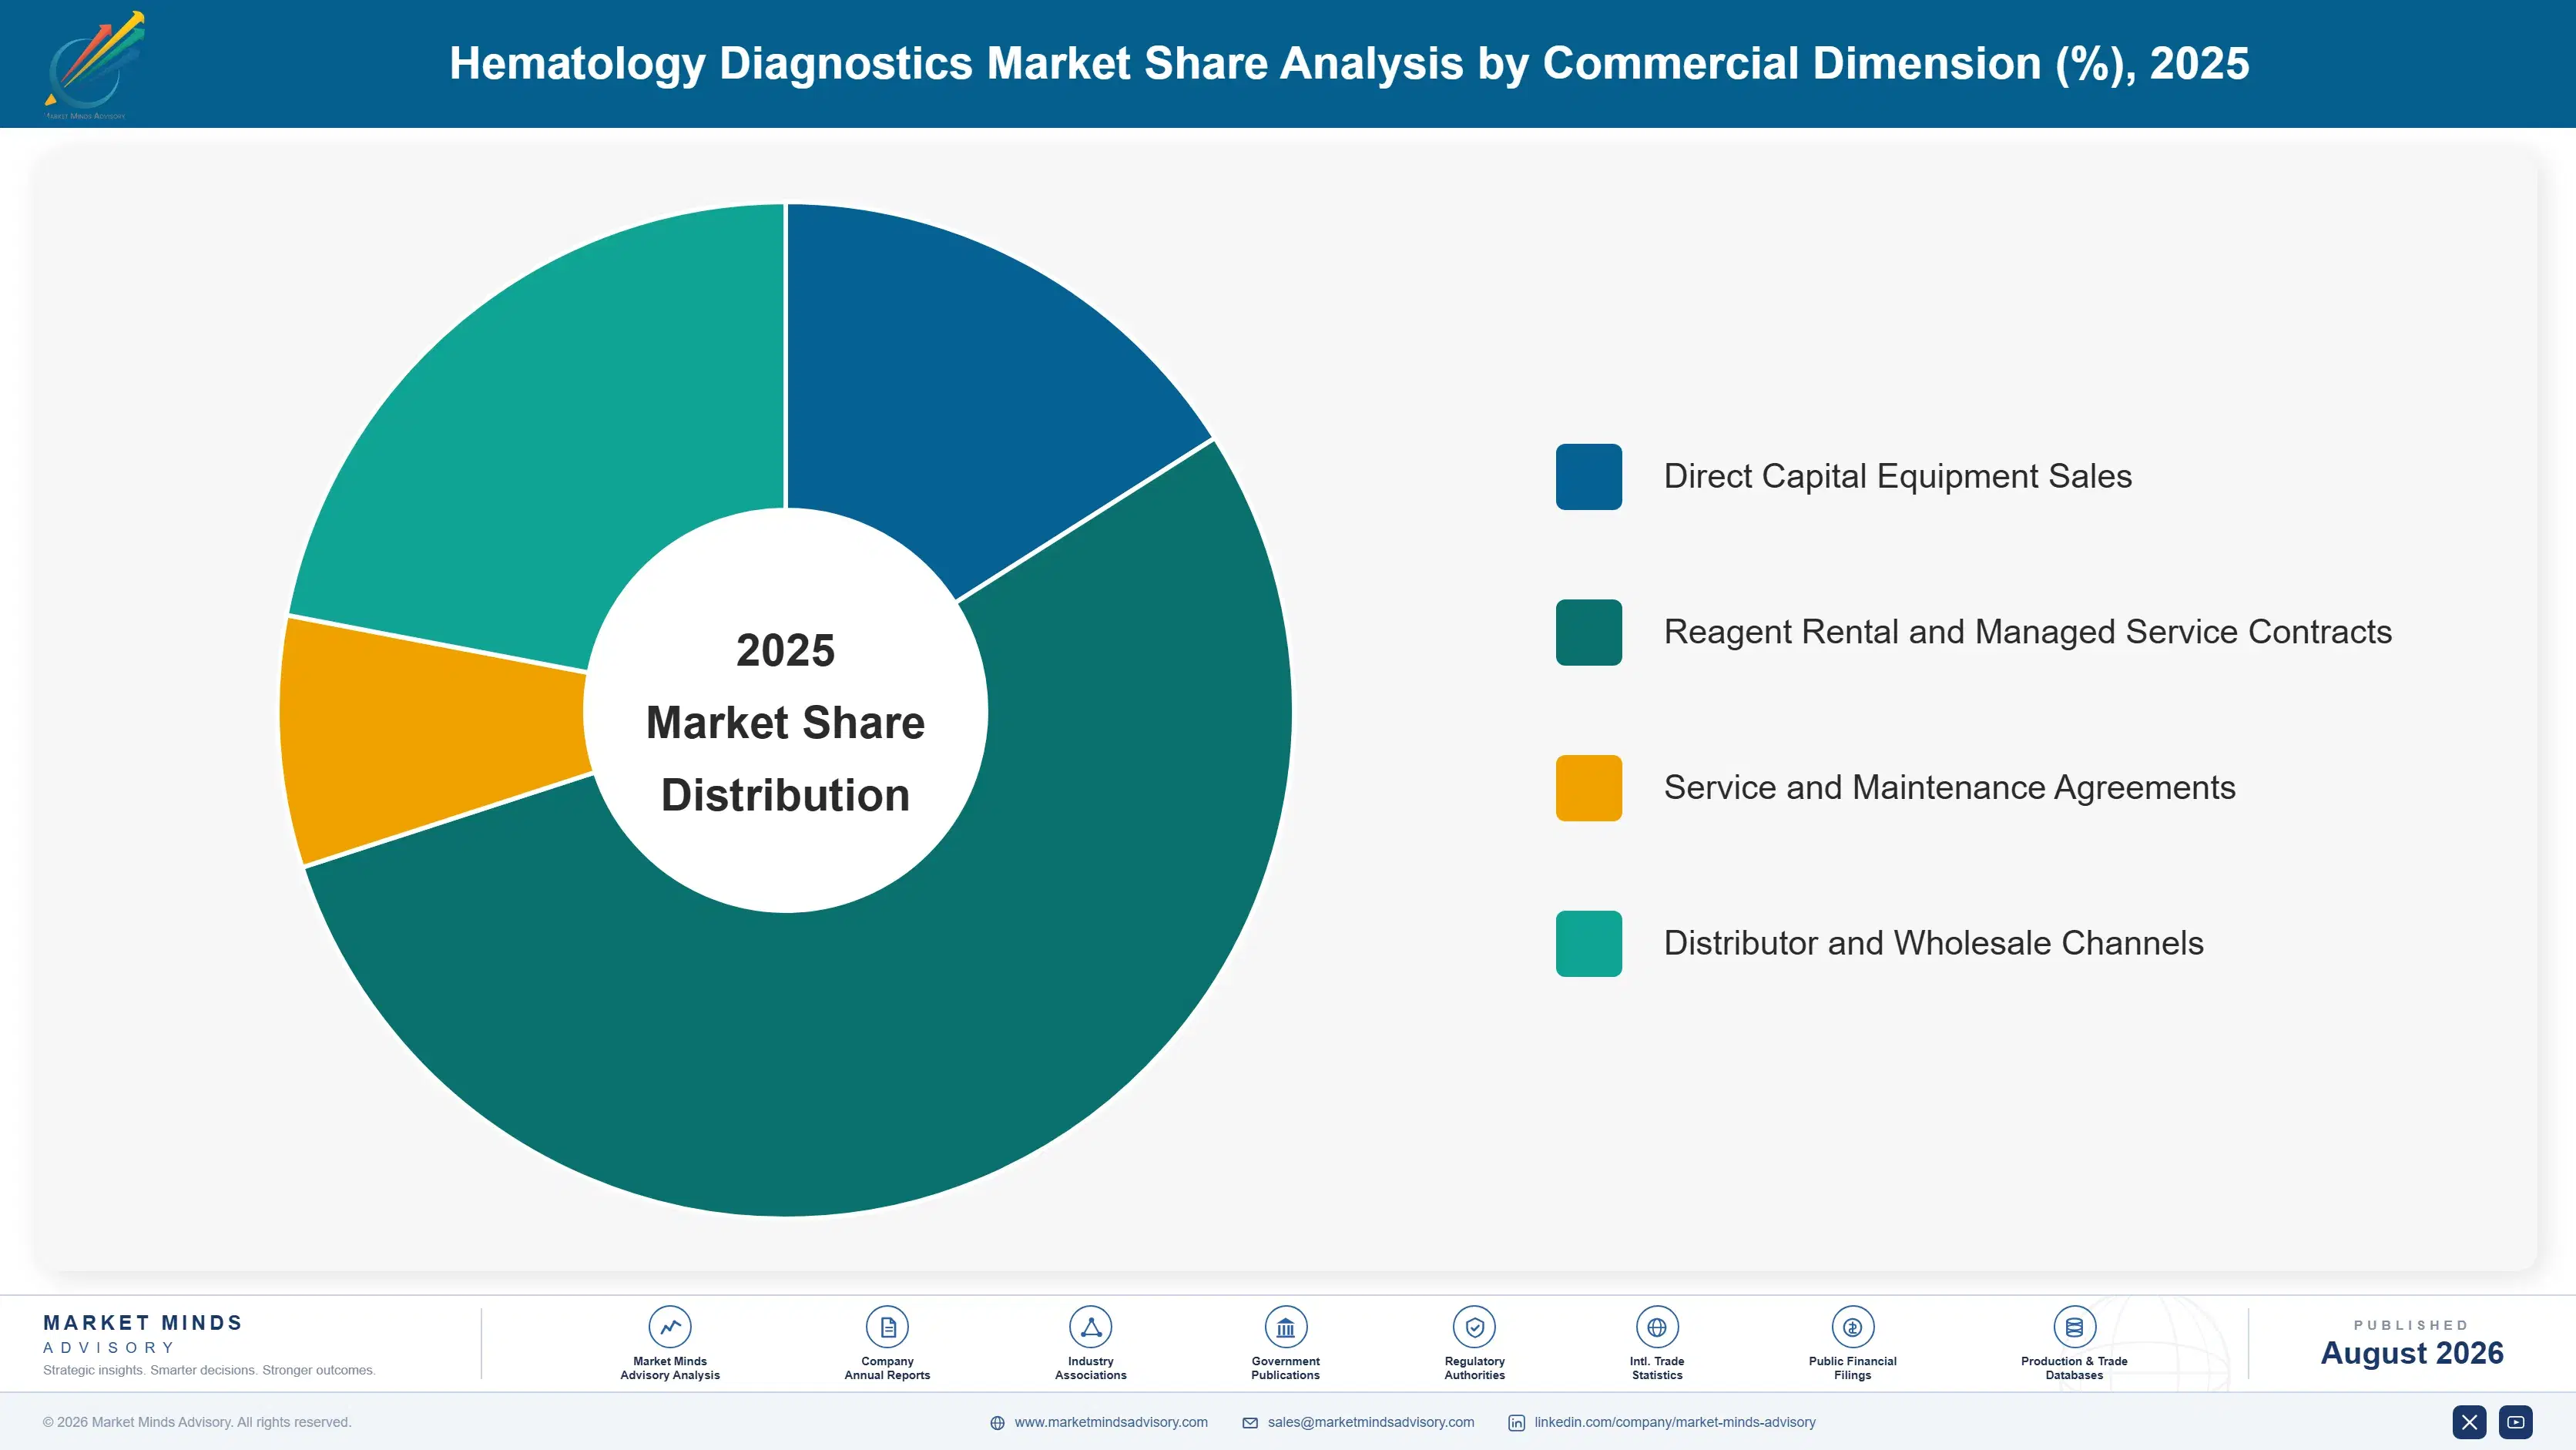
Concentration is high at 58% for the top five, reflecting an industry with genuine barriers to entry given regulatory clearance cost and the closed reagent platforms instrument makers deliberately build. Two forces are reshaping the category now. Reagent rental and managed service contracts are replacing straight capital equipment sales as the dominant commercial model, and point-of-care testing is pulling volume away from centralised laboratory analyzers in select clinical settings.
Market Definition
The hematology diagnostics market covers instruments, reagents, and consumables used to analyse blood cell counts, morphology, and related parameters, including automated hematology analyzers, flow cytometry systems, coagulation analyzers, and point-of-care hematology testing. Molecular diagnostics, blood bank and transfusion screening equipment, and general clinical chemistry analyzers are excluded.
Base Year Value
$6.8B in 2025 (MMA Primary Research Dataset, August 2026)
Forecast Period
2026 to 2036, eleven discrete annual values
CAGR
6.4% base case. Bull 7.6%. Bear 5.1%.
Fastest Growth Segment
Flow Cytometry Systems: 8.9% CAGR
Fastest Growth Country
India: 8.6% CAGR
Fastest Growth Region
South Asia and Pacific: 8.3% CAGR
Largest Region
North America: 29% of 2025 global value
Market Leaders
Sysmex Corporation, Beckman Coulter, Abbott Laboratories, Siemens Healthineers, Roche Diagnostics. Source: MMA Analysis based on company disclosures.
Primary Survey
n=3,800 procurement and R&D decision-makers, Q4 2025, six countries
Methodology
Demand-side build-up, cross-validated against public data, 47 expert interviews

Hematology Diagnostics Market Forecast Scenarios

hematology-diagnostics-market-size-forecast-scenario-1787332705042
Growth from 2020 to 2025 compounded near 5.5%, held back early by pandemic-era laboratory staffing shortages that delayed instrument installation and validation projects across hospital and reference laboratory networks worldwide, then recovered steadily as deferred capital budgets released and testing volume normalised across most major healthcare systems entering the second half of the five-year period, closing out near the current run rate.
Three mechanisms carry the base case to 6.4%. First, reagent rental adoption, as labs increasingly prefer bundled instrument and consumable contracts over upfront capital purchase. Second, flow cytometry expansion, as oncology and immunology diagnostic protocols pull cytometry deeper into routine workflows beyond specialist reference laboratories. Third, emerging market laboratory infrastructure investment, particularly across India and Southeast Asia, which brings automated testing to facilities that previously relied entirely on slower manual counting methods.
The bull case at 7.6% assumes reagent rental adoption accelerates further and emerging market laboratory investment outpaces current projections meaningfully across the forecast period ahead. The bear case at 5.1% assumes hospital capital budgets tighten under margin pressure and point-of-care testing erodes centralised laboratory analyzer volume faster than currently modelled across most developed healthcare markets globally, squeezing replacement cycle timing meaningfully.

Why The Reagent Contract Now Decides The Instrument Sale

Three forces set demand. Reagent rental adoption provides the commercial base, as roughly 46% of installed analyzers now run under bundled contracts that convert equipment sales into recurring per-test revenue streams across the installed base. Flow cytometry expansion provides a second, faster-growing layer, as oncology diagnostic protocols pull cytometry into routine hospital laboratory workflows. And emerging market laboratory investment adds a third, steadily expanding volume base entirely o
MARKET CONCENTRATIONCR5: 58%Highly concentrated among global in vitro diagnostics manufacturers
AVERAGE SELLING PRICEUSD 8,000 to 350,000 per systemInstrument cost spread across point-of-care to reference laboratory platforms
TOP PRODUCING COUNTRY SHAREJapan: about 21%Share of global hematology analyzer manufacturing output produced domestically
REAGENT RENTAL PENETRATIONAbout 46%Share of installed analyzers running under bundled reagent contracts today
REAGENT AND CONSUMABLE COSTAbout 28% of COGSPortion of production cost from reagent chemistry and disposable components
ANALYZER REPLACEMENT CYCLE7 to 10 yearsTypical operating life before a laboratory replaces its hematology analyzer
The commercial character is set by reagent chemistry more than by instrument hardware sophistication. Reagent and consumable costs account for roughly 28% of cost of goods sold, and that share is exactly why manufacturers build closed reagent platforms around their instrument platforms, since a locked-in reagent relationship generates recurring revenue an instrument sale alone never delivers to shareholders.
The next decade turns on two things. Whether reagent rental penetration keeps expanding across price-sensitive emerging markets, since that expansion converts capital-constrained labs into genuine buyers who could not otherwise afford modern instrumentation upfront at all. And whether point-of-care hematology testing keeps eroding centralised laboratory volume in decentralised clinical settings, since that erosion would reshape where analyzer revenue actually concentrates going forward across the industry.
"Every hematology analyzer used to be a five-year capital decision a lab director defended once and forgot about. Now it's a recurring reagent contract renewed every year, and the instrument itself is practically the loss leader that wins the consumable relationship."
Director, In Vitro Diagnostics and Laboratory Systems Practice · MMA Medical Dev

Market Trends

Reagent Rental Contracts Are Replacing Straight Equipment Sales

Roughly 46% of installed hematology analyzers now run under reagent rental or managed service contracts that bundle the instrument against a committed consumable purchase volume, converting what was once a single capital transaction into a recurring multi-year revenue relationship. Sysmex and Beckman Coulter have both restructured commercial teams specifically around reagent rental proposals through 2024 and 2025, since this model wins competitive tenders that a straight equipment quote increasingly loses. Manufacturers without a comparable rental offering are losing tender competitions to rivals who can defer the capital outlay entirely. This shift changes what a winning proposal looks like industry-wide today.
Market Impact: Rental penetration already reaches
Flow Cytometry Is Moving From Reference Labs Into Routine Care

Expanding oncology and immunology diagnostic protocols increasingly specify flow cytometry testing for conditions that previously relied on simpler differential counts, pulling cytometry instrumentation out of specialist reference laboratories and into routine hospital laboratory workflows at meaningfully larger scale. Beckman Coulter and Becton Dickinson have both expanded compact cytometry platforms specifically designed for hospital laboratories rather than only large reference centres. That shift is broadening the addressable customer base considerably beyond the specialist labs that historically defined cytometry demand. Instrument compactness and ease of use are becoming genuine competitive differentiators in this expanding buyer segment.
Market Impact: Cytometry demand grows at 8.9% year

Market Opportunities and Growth Drivers

Reagent Rental Converts Capital-Constrained Labs Into Buyers

Laboratories in price-sensitive markets that could not previously justify a large upfront instrument purchase increasingly gain access to modern hematology analyzers through reagent rental agreements that eliminate the capital barrier entirely in exchange for a committed consumable purchase volume over a multi-year term. That structure converts an entire population of previously unreachable laboratory customers into genuine buyers manufacturers could not serve profitably under a traditional capital sale model. Mindray has built significant emerging market share specifically around aggressive reagent rental terms tailored to smaller regional laboratories operating on tight annual budgets.
Market Impact: Margin recognition can defer 3+ yea

Oncology Diagnostic Protocols Are Expanding Cytometry Demand

Cancer diagnosis and monitoring protocols increasingly require flow cytometry testing for conditions where simpler blood count methods cannot provide sufficient diagnostic detail, and that protocol expansion is pulling cytometry instrumentation into hospital laboratories that previously referred such testing out to specialist reference centres entirely and at real added cost. Rising global cancer incidence combined with expanding treatment monitoring protocols both reinforce this demand over the coming decade without any sign of slowing meaningfully. Beckman Coulter and Becton Dickinson have both cited oncology-driven cytometry demand explicitly in recent investor commentary and product roadmaps published publicly.
Market Impact: Point-of-care testing grows at 7.8%

Market Restraints and Challenges

Reagent Rental Models Compress Manufacturer Margin Timing

Bundling the instrument at low or no upfront cost against a multi-year consumable commitment defers margin recognition considerably compared with a traditional capital sale, and that timing shift is the root cause of cash flow pressure manufacturers increasingly manage as rental penetration keeps expanding across their installed base. Commercially this favours larger, better-capitalised manufacturers who can absorb deferred margin recognition over smaller competitors with tighter balance sheet constraints. Manufacturers respond with minimum consumable commitment clauses and contract length extensions that protect long-run economics against early contract termination risk specifically across their installed base.
Market Impact: Rental now covers 46% of analyzers

Point-Of-Care Testing Erodes Centralised Laboratory Volume

Point-of-care hematology testing increasingly handles simple blood count needs at the bedside or in decentralised clinics, and that convenience advantage is the root cause of volume erosion centralised laboratory analyzers experience in exactly the settings where point-of-care testing has gained genuine clinical acceptance among physicians and nursing staff alike. Commercially this concentrates centralised laboratory growth into more complex testing that point-of-care platforms cannot yet replicate reliably. Manufacturers respond by building point-of-care platforms themselves rather than ceding that decentralised volume entirely to specialist point-of-care competitors already active in the space and gaining share steadily.
Market Impact: Flow cytometry grows at 8.9% indust
3 additional market trends, 4 additional growth drivers, and 2 additional restraints and challenges are covered in the full report. Contact sales@marketmindsadvisory.com to access the complete intelligence.

Segment CAGR and Growth Architecture

Segmentation follows instrument technology, a single engineering logic describing how the platform analyses blood cells rather than which laboratory setting deploys it. Each technology carries its own reagent chemistry, throughput profile, and regulatory pathway, so commercial position tracks the underlying analytical method rather than the end customer type served across every channel and region.
hematology-diagnostics-market-market-share-analysis-1787332705588

Flow Cytometry Systems

Flow cytometry systems grow fastest at 8.9%, about 1.39 times the overall 6.4% rate, covering instruments that analyse individual cell characteristics using laser-based detection for oncology, immunology, and specialised hematology diagnostic applications expanding across hospital laboratories. This segment benefits directly from expanding cancer diagnosis and treatment monitoring protocols that increasingly specify cytometry testing beyond what reference laboratories alone can supply at national scale. Beckman Coulter and Becton Dickinson both compete strongly here alongside specialist cytometry manufacturers serving research and clinical markets simultaneously. Compact, hospital-friendly platform development is broadening the addressable buyer base considerably beyond the large reference centres that historically defined cytometry demand and purchasing patterns across most developed and emerging markets.
CAGR 8.9%

Automated Hematology Analyzers

Automated hematology analyzers grow at 5.6%, the largest segment by installed base though no longer the fastest, covering complete blood count and differential testing instruments deployed across hospital, reference, and physician office laboratories worldwide at every scale. Growth has moderated as the segment matures and reagent rental competition compresses instrument pricing toward commodity levels in exactly the mid-tier hospital segment where competition runs deepest. Sysmex and Abbott both maintain strong positions here across hospital and reference laboratory customer bases globally. This segment remains the volume foundation underneath the category even as growth and margin both concentrate increasingly in flow cytometry and specialised testing formats elsewhere in the broader portfolio across most manufacturer product lines.
CAGR 5.6%
Full segment breakdown across 5 segments available in the complete report.

Regional Architecture and Country Demand Map

Laboratory infrastructure density and reimbursement structure together set this distribution more than raw population size does across most markets globally. North America and East Asia lead on different logics, one on reimbursement depth, the other on manufacturing scale, while share elsewhere tracks laboratory modernisation pace.

North America

Reimbursement depth and laboratory automation maturity anchor North America's 29% share, as American hospital and reference laboratories maintain some of the most extensively automated testing infrastructure globally, supporting premium instrument and reagent rental adoption alike. Beckman Coulter and Abbott both maintain extensive domestic manufacturing and service capacity serving this demand directly across every laboratory tier. Canadian laboratory networks follow a similar trajectory on a smaller scale, concentrated in provincial reference laboratory systems specifically. Flow cytometry adoption runs ahead of most global peers given oncology diagnostic protocol maturity domestically. Growth of 6.2% tracks reagent rental expansion and cytometry adoption together across the country and its many laboratory networks nationwide, both public and private.
Share: 29% | CAGR: 6.2% (2026 to 2036)

Western Europe

Centralised healthcare procurement shapes demand across Western Europe's 22% share more than competitive vendor selection does, with National Health Service and German statutory insurer tender processes favouring reagent rental structures that shift cost from capital to operating budgets directly. German and French laboratories maintain deep automation infrastructure reflecting decades of centralised laboratory consolidation across the region. British NHS trusts have consolidated laboratory services considerably, concentrating instrument purchasing decisions among fewer, larger regional laboratory networks than before across most member states and their regional trusts. Growth of 4.9%, the slowest of the seven, reflects a mature market where most major laboratory consolidation and automation investment already occurred over the past decade.
Share: 22% | CAGR: 4.9% (2026 to 2036)
Regional intelligence for 5 additional markets available in the complete report: East Asia, South Asia and Pacific, Latin America, Middle East and Africa, Eastern Europe. Contact sales@marketmindsadvisory.com.
hematology-diagnostics-market-country-cagr-analysis-1787332706098

Where Hematology Diagnostics Makers Actually Build Margin

Competing on instrument price alone means competing against every manufacturer willing to bundle a free analyzer against a reagent commitment and a long-term consumable contract. The four moves below shift revenue toward positions a cheaper competitor cannot easily match: reagent chemistry lock-in, flow cytometry breadth, service contract depth, and emerging market rental terms built for capital-constrained laboratories.

Build Closed Reagent Chemistry Around Instrument Platforms

Reagent and consumable costs account for roughly 28% of cost of goods sold, and manufacturers who design instruments requiring proprietary reagent chemistry capture that recurring revenue rather than ceding it to third-party reagent suppliers competing purely on price against the original equipment manufacturer directly. Sysmex and Beckman Coulter have both structured recent platform development explicitly around proprietary chemistry that competitors cannot easily replicate or substitute at comparable cost or performance. That lock-in also protects long-run pricing power considerably better than an open-reagent instrument architecture ever could achieve across a comparable installed base.
Market Impact: Reagents make up 28% of total produ

Expand Flow Cytometry Into Hospital Laboratory Settings

Expanding oncology and immunology diagnostic protocols, growing at 8.9% annually, are pulling flow cytometry demand out of specialist reference laboratories and into routine hospital laboratory workflows, and manufacturers building compact, hospital-friendly cytometry platforms ahead of this shift capture share before competitors can retool their product lines for the new buyer segment. Beckman Coulter and Becton Dickinson have both expanded compact cytometry platforms specifically designed for hospital laboratories rather than only large reference centres nationwide. Growing this addressable buyer base is becoming as commercially important as defending existing reference laboratory accounts against determined competitors.
Market Impact: Cytometry demand keeps growing at 8

Build Reagent Rental Terms For Capital-Constrained Labs

Laboratories in price-sensitive emerging markets increasingly gain access to modern instrumentation through reagent rental agreements that eliminate the capital barrier entirely, and manufacturers offering aggressive rental terms tailored to smaller regional laboratories capture volume that a traditional capital sale model could never reach profitably at comparable scale. Rental placements already cover 46% of new analyzer installations across South Asia, and Mindray has built significant emerging market share around this approach across that region and Latin America, without sacrificing margin. That structure converts an entire population of previously unreachable customers into genuine, recurring revenue relationships worth cultivating.
Market Impact: Rental placements now cover 46% of

Deepen Service Contracts To Protect Renewal Relationships

Hematology analyzers require regular calibration and maintenance across their 7 to 10 year operating life, and manufacturers who maintain the original service relationship into ongoing maintenance capture recurring revenue considerably more predictable than one-time instrument sales alone ever provide across a comparable period of ownership. That relationship also generates renewal intelligence about a laboratory's future equipment plans before competitors even learn a tender is coming their way. Building this service depth should rank above chasing every available new instrument placement opportunity that arises, since roughly 70% of replacement decisions still favor the incumbent service provider.
Market Impact: Analyzers need service across 7 to

Who Controls the Margin Pool

Concentration is high: the top five hold roughly 58% of revenue, reflecting genuine barriers to entry given regulatory clearance cost and the closed reagent platforms instrument makers build deliberately around their chemistry. The gap between leaders and challengers is reagent chemistry depth and service relationship breadth rather than raw manufacturing scale alone, since even large manufacturers compete regionally in service delivery. All participants here are assessed on one basis, annual ma
Competition runs along three lines. First, reagent chemistry lock-in, since manufacturers capturing recurring consumable revenue build considerably more durable customer relationships than instrument-only competitors. Second, flow cytometry breadth, as expanding oncology protocols reward manufacturers with genuine hospital-ready cytometry platforms. Third, reagent rental terms, particularly for manufacturers serving price-sensitive emerging market laboratories directly.

Pressure is building from two directions. Chinese manufacturers including Mindray are expanding capacity rapidly to serve both domestic demand and export markets that established Western manufacturers serve less competitively on price. Meanwhile point-of-care specialists are eroding centralised laboratory volume in decentralised clinical settings, forcing established manufacturers to build comparable point-of-care platforms themselves. Rankings should favour manufacturers combining reagent lock-in depth with genuine cytometry breadth.
hematology-diagnostics-market-company-positioning-matrix-1787332706619

Competitive Moat and Risk Dimensions

SYSMEX CORPORATION

Moat: Reagent chemistry and service depth

Sysmex holds deep proprietary reagent chemistry expertise that competitors struggle to replicate, giving its hematology platforms a durable consumable revenue advantage across its global installed base. Its extensive service and support network across major markets provides reliability reputation new entrants must build from nothing. Deep relationships with hospital and reference laboratories worldwide shorten sales cycles considerably compared with smaller competitors.
SYSMEX CORPORATION

Risk: Concentration in mature core segment

Sysmex's revenue remains heavily concentrated in traditional hematology analyzers, a segment growing more slowly than flow cytometry and specialised testing formats elsewhere in the category. Chinese manufacturers including Mindray undercut on price in price-sensitive emerging markets where reagent chemistry differentiation matters less to budget-constrained buyers. Diversification into faster-growing adjacent segments remains an ongoing strategic priority not yet fully realised.
BECKMAN COULTER

Moat: Cytometry and hospital platform breadth

Beckman Coulter holds strong flow cytometry capability spanning both reference laboratory and newer hospital-friendly compact platforms, capturing demand across the full range of buyer sophistication in this expanding segment. Its Danaher ownership provides capital access and operational discipline smaller independent competitors cannot match easily. Established relationships across oncology and immunology diagnostic customers provide cross-selling opportunities competitors lack.
BECKMAN COULTER

Risk: Portfolio breadth dilutes focus

Beckman Coulter's breadth across multiple diagnostic categories within Danaher's broader portfolio means hematology-specific investment competes internally against other business priorities for capital allocation. Sysmex's deeper reagent chemistry specialisation in core hematology analyzers pressures Beckman Coulter in that specific segment directly. Integration complexity across its diagnostics portfolio occasionally slows product development speed.

Players Tracked

Prominent Players

Sysmex Corporation
Beckman Coulter
Abbott Laboratories
Siemens Healthineers
Roche Diagnostics

Other Key Players

Mindray Medical
Horiba Medical
Nihon Kohden
bioMerieux
Werfen
Diatron
Boule Diagnostics
EKF Diagnostics
Erba Mannheim
Radiometer
CellaVision
Quotient Suisse
PZ Cormay
Diagon Diagnostics
HemoCue

Recent Developments

APRIL 2025

Sysmex expands reagent manufacturing capacity across two facilities

Sysmex announced reagent manufacturing capacity expansion across two facilities to meet growing global demand for its proprietary hematology chemistry, particularly across expanding emerging market rental contracts and networks. This was an organic capacity expansion rather than an acquisition, extending capability piloted at a single site previously.
Signal: Reagent capacity investment ahead of confi
SEPTEMBER 2024

Beckman Coulter launches compact flow cytometry platform for hospitals

Beckman Coulter launched a compact flow cytometry platform specifically designed for hospital laboratory settings rather than large reference centres, targeting expanding oncology diagnostic demand across multiple hospital networks. This was a product launch rather than an acquisition, extending its cytometry reach into a broader hospital laboratory customer base directly.
Signal: Cytometry manufacturers are increasingly b
JANUARY 2025

Mindray signs reagent rental agreement with regional hospital network

Mindray signed a multi-year reagent rental agreement with a regional hospital network covering instrument placement and consumable supply across multiple facilities simultaneously under one contract. This was a confirmed supply agreement rather than an acquisition, extending its rental-based commercial model into a new regional market directly.
Signal: Reagent rental agreements are increasingly

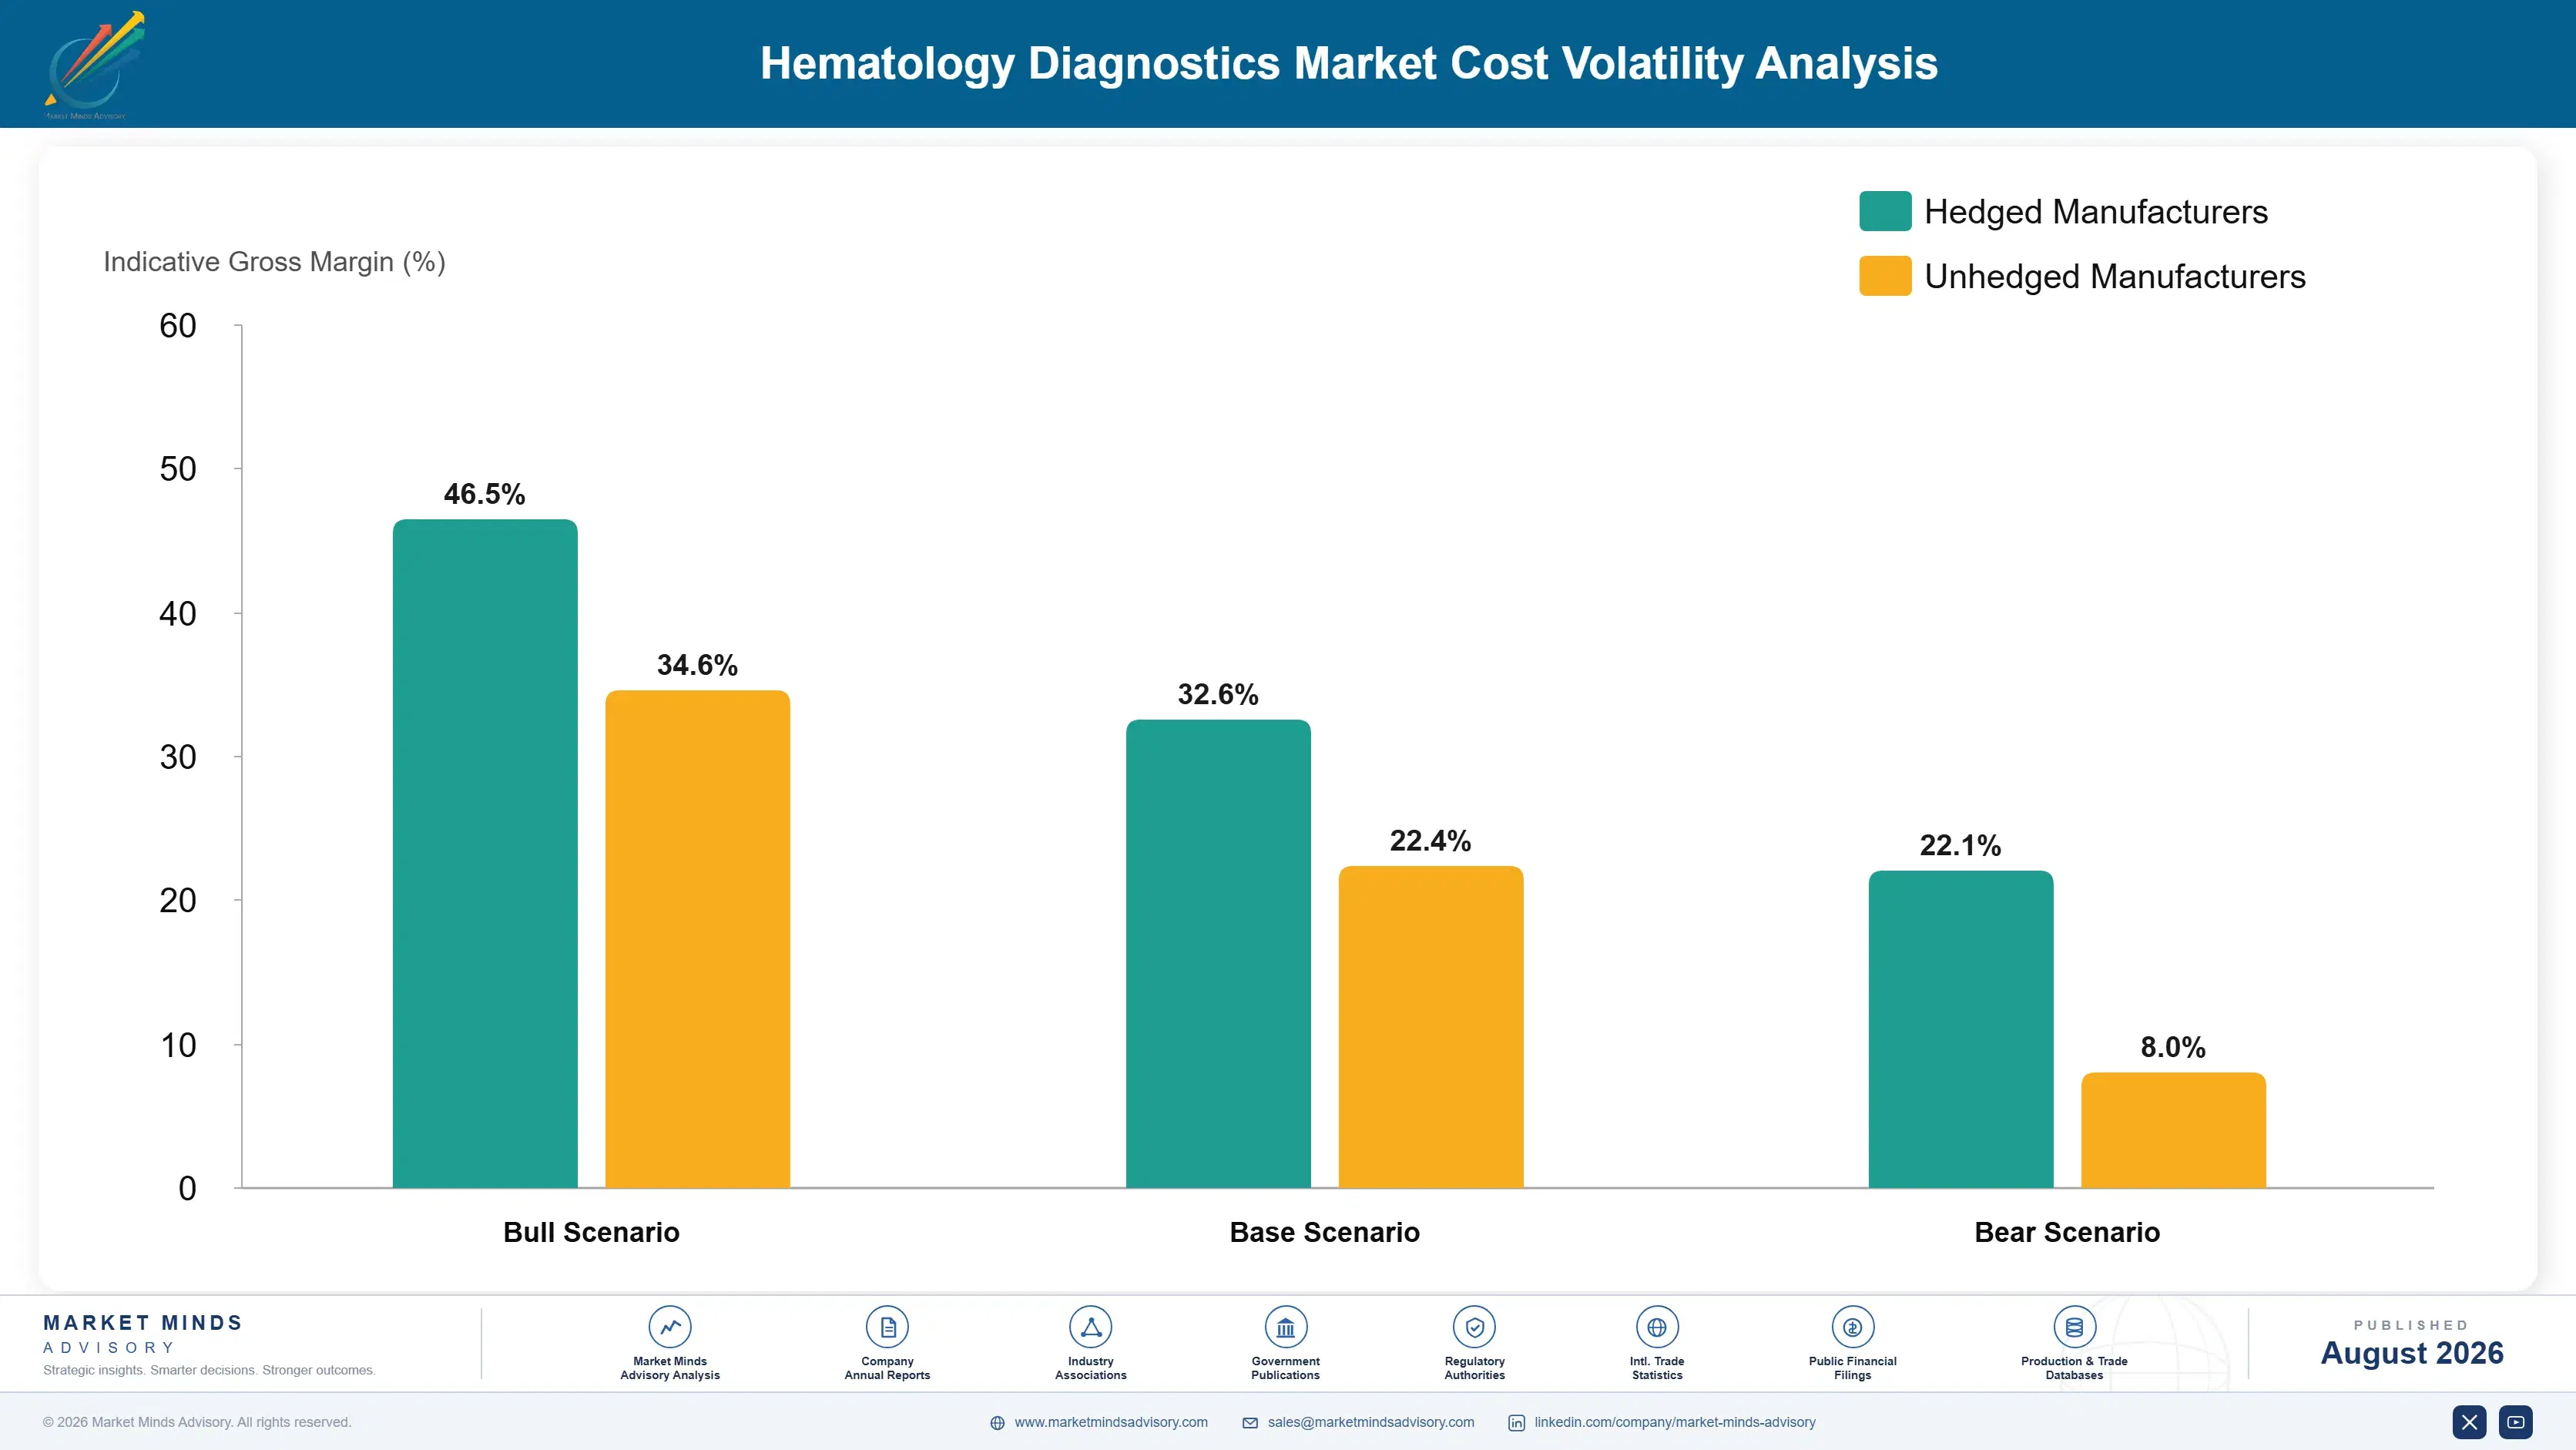
Reagent Chemistry, Optical Components, Assembly Labour

Reagent and consumable costs account for roughly 28% of cost of goods sold, sourced from specialty chemical suppliers and proprietary in-house chemistry production whose cost varies with raw material and biological component availability depending on assay type used. Optical and electromechanical components contribute a further 26% to 32%. Assembly labour and quality testing take 12% to 16%, with the remainder covering freight and facility overhead across the supply chain.
Specialty biological reagent component pricing rose materially through 2021 and 2022 amid broader supply chain disruption affecting antibody and calibration material suppliers across the diagnostics industry generally and its many component vendors. Sysmex's annual report disclosed material input cost pressure across that period, and several manufacturers absorbed margin compression rather than raise reagent pricing on existing rental contracts already under committed multi-year terms with customers.

Exposure varies by reagent chemistry and manufacturing integration. Manufacturers producing reagents in-house control cost and supply more directly than those dependent on third-party biological component suppliers whose pricing and availability sit outside their control entirely. Manufacturers with long-term component supply agreements protect against volatility considerably better than those purchasing reactively during demand spikes and shortages.
hematology-diagnostics-market-cost-volatility-analysis-1787332706814

Bring reagent chemistry production in-house where feasible

Manufacturers producing proprietary reagent chemistry internally rather than depending on third-party biological component suppliers control both cost and supply reliability more directly, a structure that requires substantial upfront investment but protects margin considerably better once production scale is achieved across the full installed base. Sysmex and Beckman Coulter have both pursued this path deliberately.

Negotiate long-term component supply agreements

Manufacturers securing multi-year supply agreements for critical biological and chemical components ahead of price spikes protect margin and reagent availability considerably better than those sourcing reactively, a structure that requires accurate demand forecasting smaller manufacturers sometimes struggle to commit to confidently upfront before demand fully materialises across their entire regional laboratory customer base each year.

Build reagent pricing escalation into rental contracts

Manufacturers building reagent cost escalation clauses directly into multi-year rental agreements pass input volatility through to laboratory customers rather than absorbing it against thin recurring margin, a structure that protects profitability during price spikes though it requires negotiating leverage smaller manufacturers sometimes lack against larger laboratory network buyers with more purchasing power and longer contract memory.

Portfolio Architecture for Margin Defence

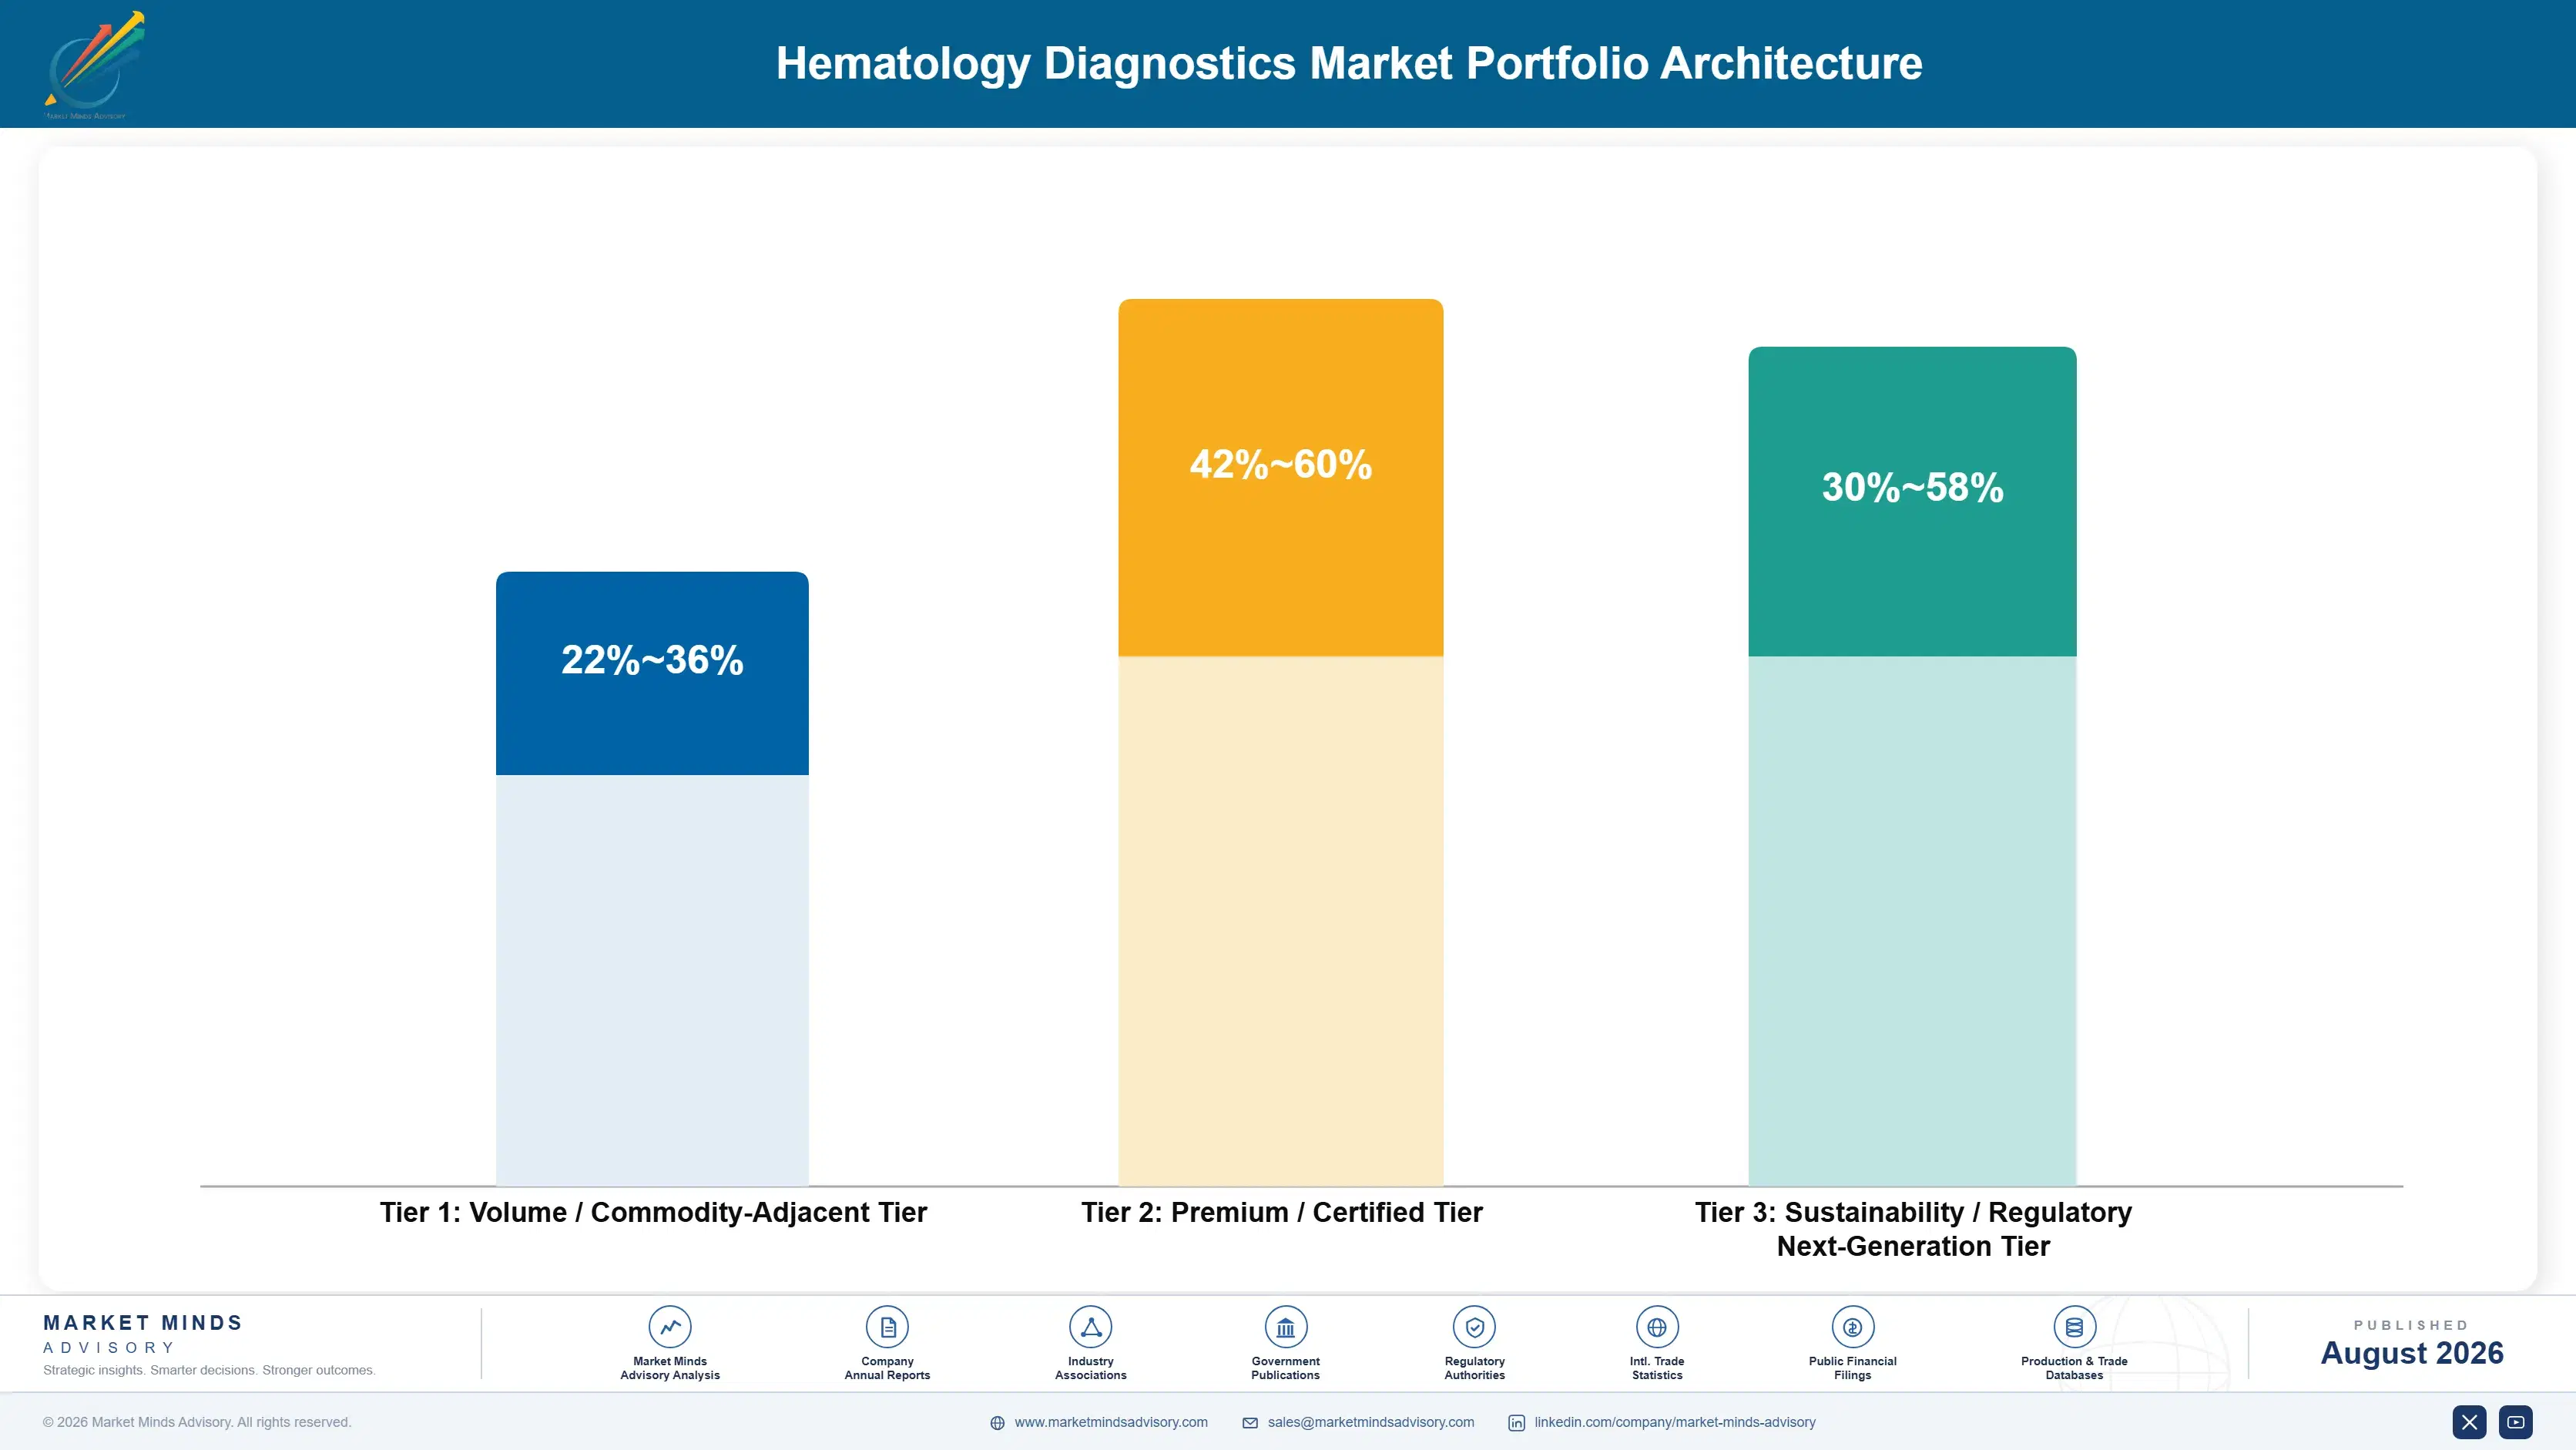
The portfolio splits into three tiers with sharply different economics. Standard automated hematology analyzers form the volume tier, competing largely on price and rental terms with margin set by consumable cost and manufacturing scale. Flow cytometry and specialised testing platforms earn more because reagent chemistry depth and clinical complexity both resist the commoditisation pressure hitting standard analyzers. Reagent-rental-integrated managed service contracts sit differently, priced ag
The tension runs between winning standard analyzer volume on price and building cytometry and service capability that protects margin over the long run. A manufacturer chasing every standard tender available eventually gets squeezed as regional competitors undercut aggressively on price, yet building cytometry and service depth requires investment thin-margin standard analyzer sales rarely fund adequately. Manufacturers handling this well treat standard analyzers as the volume base and cytometry as the margin engine.

High-value pools concentrate where reagent lock-in, cytometry breadth, or service depth limit competition: proprietary reagent platforms generating recurring consumable revenue, flow cytometry platforms serving expanding oncology protocols, and service-contract-backed laboratory relationships spanning multiple renewal cycles. Standard analyzers sit at the other end, competing almost entirely on price against every regional manufacturer with comparable throughput.

Volume / Commodity-Adjacent Tier

Standard automated hematology analyzers for mainstream hospital and physician office laboratories competing largely on price and rental terms. Margin is thin and set almost entirely by reagent cost and manufacturing scale.
Gross Margin: 22-36%

Premium / Certified Tier

Flow cytometry and specialised hematology testing platforms with proprietary reagent chemistry serving oncology and immunology diagnostic protocols nationwide. Margin reflects reagent lock-in and clinical complexity investment made over time across major reference laboratory networks.
Gross Margin: 42-60%

Sustainability / Regulatory / Next-Generation Tier

Reagent-rental-integrated managed service contracts and next-generation point-of-care hematology platforms addressing decentralised testing demand directly across most care settings. The wide range reflects early-stage pricing still settling industry-wide as adoption scales across new laboratory segments.
Gross Margin: 30-58%
hematology-diagnostics-market-portfolio-architecture-1787332707314

High-value Sub-segments and Strategic Watch-out

Flow Cytometry Systems

High value and high growth at 8.9%, the fastest technology, as expanding oncology and immunology diagnostic protocols pull cytometry into routine hospital laboratory workflows across nearly every major healthcare market, and manufacturers building compact hospital-ready platforms capture this shift first, ahead of slower reference-only competitors.
Gross Margin: 42-60%

Point-of-Care Hematology Testing

High value with strong growth at 7.8%, driven by decentralised testing demand that lets clinicians obtain results at the bedside without waiting for centralised laboratory turnaround times, a shift accelerating across emergency departments and outpatient clinics each single visit and reshaping how vendors design portable instrumentation.
Gross Margin: 34-54%

Automated Hematology Analyzers

The volume core by installed base, growing at 5.6% as standard complete blood count instruments remain the largest category even as growth concentrates in cytometry and specialised formats elsewhere, keeping this segment the revenue anchor for most manufacturers today despite thinner margin than the faster-growing specialty categories.
Gross Margin: 22-36%

Coagulation Analyzers

The strategic watch-out, growing at just 3.6% and facing steady commoditisation pressure as standard coagulation testing becomes table stakes bundled with broader hematology platforms rather than a differentiated standalone purchase decision, squeezing standalone coagulation vendors hardest across most laboratory tiers and pushing several toward exit or acquisition.
Gross Margin: 20-34%

How Hematology Diagnostics Revenue Actually Persists

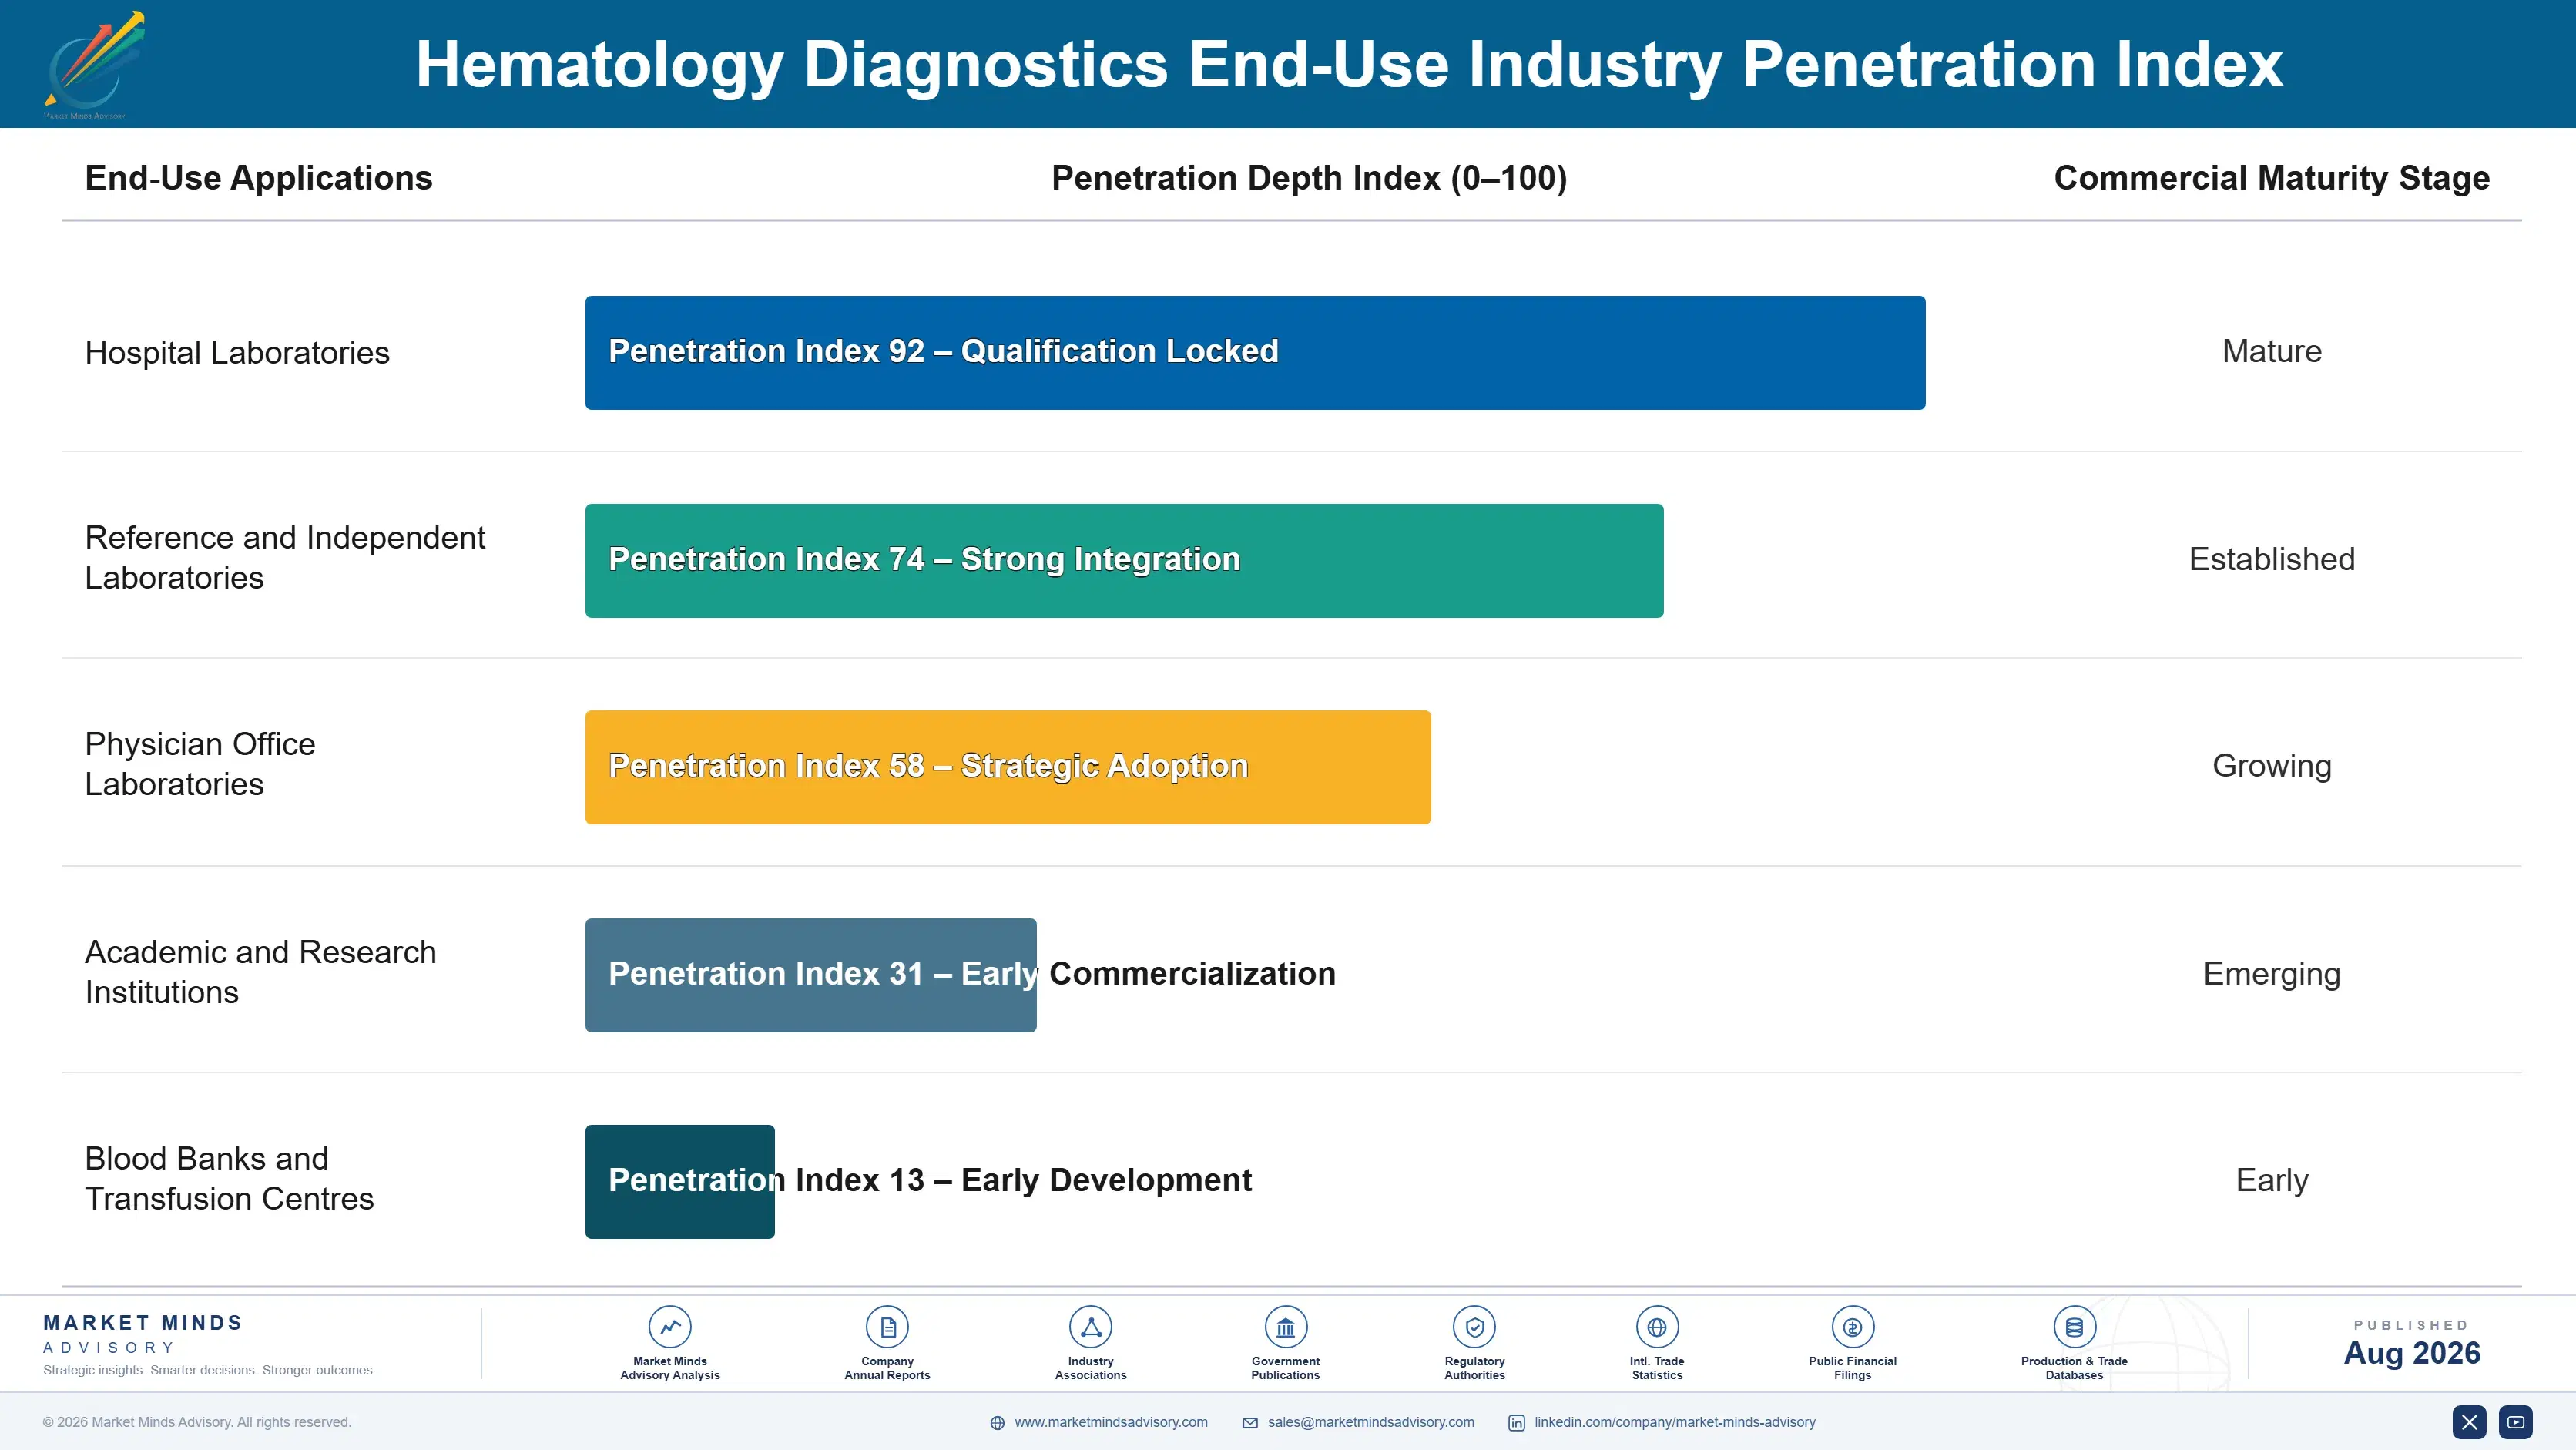
Revenue depends on a laboratory's multi-year rental or service relationship, not on winning a single instrument placement. A reagent rental contract generates recurring consumable revenue across its full committed term, so annuity value sits in that ongoing relationship rather than in the original instrument placement itself. Straight capital equipment sales behave differently, generating a single transaction with comparatively limited recurring revenue once the instrument is delivering reliable
Stickiness varies sharply by commercial model and reagent chemistry. Reagent rental relationships stick hardest, since switching manufacturers mid-contract risks workflow disruption and validation cost laboratory directors avoid unless genuinely forced. Standard capital-purchased analyzers stick moderately, protected mainly by reagent compatibility and staff training familiarity rather than genuine differentiation. Point-of-care instruments switch most readily, since simpler validation requirements lower the switching barrier considerably.

Buyer profiles have shifted generationally. Laboratory directors who once selected instruments primarily on analytical performance increasingly weigh total cost of ownership and reagent rental terms, given how much budget certainty matters under tightening hospital capital constraints. Procurement and finance leadership increasingly sit alongside laboratory directors in vendor selection, a shift reagent rental economics has made necessary rather than optional.
hematology-diagnostics-market-end-use-penetration-index-1787332707803

Our Call On Hematology Diagnostics

These are among the four positions where our research anticipates prominent divergence between winners and laggards over the coming forecast period. Each is grounded in the demand model, the regulatory perimeter, and the announced capacity pipeline.
01 / REAGENT LOCK-IN WINS

Proprietary chemistry beats instrument price alone

Reagent and consumable costs account for roughly 28% of cost of goods sold, and manufacturers who design instruments requiring proprietary reagent chemistry capture that recurring revenue rather than ceding it to third-party suppliers competing purely on price against the original equipment manufacturer directly. That lock-in also protects long-run pricing power considerably better than an open-reagent instrument architecture ever could achieve across a comparable installed base. Manufacturers should treat reagent chemistry development as a core strategic investment, not a secondary engineering concern handled late in the design cycle.
02 / CYTOMETRY GROWTH REWARDS SPEED

Hospital-ready platforms capture the expanding buyer base

Expanding oncology and immunology diagnostic protocols are pulling flow cytometry demand out of specialist reference laboratories and into routine hospital laboratory workflows, and manufacturers building compact, hospital-friendly cytometry platforms ahead of this shift capture share before competitors can retool their product lines for the new buyer segment emerging quickly across multiple markets. Growing this addressable buyer base should rank above defending existing reference laboratory accounts alone, since the expanding segment is where future growth genuinely concentrates. Manufacturers slow to move risk ceding this ground permanently.
03 / RENTAL TERMS OPEN MARKETS

Capital-free access converts constrained labs into buyers

Laboratories in price-sensitive emerging markets increasingly gain access to modern instrumentation through reagent rental agreements that eliminate the capital barrier entirely, and manufacturers offering aggressive rental terms tailored to smaller regional laboratories capture volume a traditional capital sale model could never reach profitably at comparable scale. That structure converts an entire population of previously unreachable customers into genuine, recurring revenue relationships worth building deliberately rather than treating as an afterthought. Manufacturers ignoring this segment cede genuine long-run growth to more aggressive competitors.
04 / SERVICE DEPTH PROTECTS RENEWALS

Maintenance relationships anchor multi-year revenue

Hematology analyzers require regular calibration and maintenance across their 7 to 10 year operating life, and manufacturers who maintain the original service relationship into ongoing maintenance capture recurring revenue considerably more predictable than one-time instrument sales alone ever provide across a comparable period of ownership. That relationship also generates renewal intelligence about a laboratory's future equipment plans before competitors even learn a tender is coming their way. Manufacturers under-investing in service depth lose renewals to more attentive rivals eventually, often without realising the account was ever genuinely at risk.

Engagement Snapshot From the Field

A live engagement with an industry participant carrying material or product regulatory and market exposure ahead of a defining policy shift, showing how our research translates into a defensible multi-year portfolio strategy.
MARKET MINDS ADVISORY · CLIENT ENGAGEMENT SUMMARY
Hematology Diagnostics Producer Strategic Portfolio Review and Transition Roadmap 2026·Investment Scenario on Hematology Diagnostics Exposure Evaluation 2025-26
CLIENT PROFILE
A regional laboratory network operating twelve hospital and reference laboratories engaged MMA while evaluating whether to consolidate around a single hematology analyzer vendor ahead of a major equipment refresh cycle. The client reported annual hematology testing volume near 4.2 million samples, with three different analyzer platforms currently deployed across its facilities (client-reported, unverified by MMA).
STRATEGIC CHALLENGE
Leadership needed to evaluate whether consolidating to a single vendor would deliver sufficient reagent pricing and service efficiency to justify the disruption of standardising workflows and retraining staff across facilities currently running three different platforms with different validation requirements and quality control procedures established separately over many years of independent operation.
MMA APPROACH
MMA benchmarked four qualified vendors on reagent rental pricing, service response time, and flow cytometry breadth against the client's testing volume and specialty mix across all twelve facilities. We modelled consolidation savings against the one-time cost of standardising workflows and retraining laboratory staff. We then assessed each vendor's implementation timeline and transition risk specifically.
KEY FINDINGS
  1. Consolidating to a single vendor would reduce projected reagent costs by roughly 14% through improved volume pricing across the entire network overall.
  2. Two of four vendors could not guarantee implementation timelines meeting the client's equipment refresh deadline across all twelve facilities simultaneously, eliminating them from consideration early in the process.
  3. Standardising on one platform would reduce annual service contract cost by an estimated 22% compared with managing three separate vendor relationships independently.
  4. The leading vendor's reagent rental terms would convert a planned capital purchase into an operating expense, improving near-term cash flow considerably going forward.
CLIENT PROFILE
A regional laboratory network operating twelve hospital and reference laboratories engaged MMA while evaluating whether to consolidate around a single hematology analyzer vendor ahead of a major equipment refresh cycle. The client reported annual hematology testing volume near 4.2 million samples, with three different analyzer platforms currently deployed across its facilities (client-reported, unverified by MMA).
STRATEGIC CHALLENGE
Leadership needed to evaluate whether consolidating to a single vendor would deliver sufficient reagent pricing and service efficiency to justify the disruption of standardising workflows and retraining staff across facilities currently running three different platforms with different validation requirements and quality control procedures established separately over many years of independent operation.
MMA APPROACH
MMA benchmarked four qualified vendors on reagent rental pricing, service response time, and flow cytometry breadth against the client's testing volume and specialty mix across all twelve facilities. We modelled consolidation savings against the one-time cost of standardising workflows and retraining laboratory staff. We then assessed each vendor's implementation timeline and transition risk specifically.
KEY FINDINGS
  1. Consolidating to a single vendor would reduce projected reagent costs by roughly 14% through improved volume pricing across the entire network overall.
  2. Two of four vendors could not guarantee implementation timelines meeting the client's equipment refresh deadline across all twelve facilities simultaneously, eliminating them from consideration early in the process.
  3. Standardising on one platform would reduce annual service contract cost by an estimated 22% compared with managing three separate vendor relationships independently.
  4. The leading vendor's reagent rental terms would convert a planned capital purchase into an operating expense, improving near-term cash flow considerably going forward.
RECOMMENDED STRATEGY
Phase 1: Phase 1 (0 to 4 months): Finalise vendor selection and negotiate network-wide reagent rental and service contract terms directly with leadership. Phase 2: Phase 2 (4 to 12 months): Transition facilities in phases, prioritising sites with the oldest existing equipment and shortest remaining service life. Phase 3: Phase 3 (12 to 18 months): Complete network-wide standardisation and renegotiate consolidated pricing under the combined volume commitment achieved across all twelve facilities.
OUTCOME
The client completed vendor consolidation within the eighteen-month target and achieved reagent cost savings close to the modelled estimate across the full network of twelve facilities. Service response time also improved measurably under the single-vendor relationship established, and staff retraining finished ahead of the original schedule set at project outset (client-reported, unverified by MMA).

Frequently Asked Questions

Foundational context covering the market sizes, CAGR, scope, country, region and competition that inform every finding below. This section is provided to cover basics and most often pre-purchase conversations, answered from the MMA Primary Research Dataset.

What is the current size of the Hematology Diagnostics Market?

The global hematology diagnostics market is valued at USD 6.8 billion in 2025, covering automated hematology analyzers, flow cytometry systems, coagulation analyzers, and point-of-care testing. Molecular diagnostics are excluded.

How large will the Hematology Diagnostics Market be by 2036?

The market is forecast to reach USD 13.46 billion by 2036 in the base case, about 1.86 times the 2026 level. That represents incremental value of roughly USD 6.22 billion across the decade.

What is the CAGR for the Hematology Diagnostics Market 2026 to 2036?

The market grows at a 6.4% CAGR in the base case, with bull and bear scenarios at 7.6% and 5.1%. The spread turns mainly on reagent rental adoption pace and emerging market laboratory investment.

Which segment is growing fastest?

Flow cytometry systems grow fastest at 8.9%, about 1.39 times the overall rate, as expanding oncology and immunology protocols pull cytometry into routine workflows. Point-of-care testing follows at 7.8%.

Who are the major companies in the Hematology Diagnostics Market?

Leading companies include Sysmex Corporation, Beckman Coulter, Abbott Laboratories, Siemens Healthineers, and Roche Diagnostics. Concentration is high, with the top five holding roughly 58% of revenue.

Which country is growing fastest?

India grows fastest at an 8.6% CAGR, as laboratory infrastructure expansion brings automated testing to facilities that previously ran manual differential counts. China follows on manufacturing scale.

Report Segmentation Architecture

The full report scope spans multiple orthogonal segmentation dimensions, with cross-tabulated demand data provided for each dimension pair. Coverage extends further to regional breakdowns, trend trajectories, and the competitive detail needed to support segment-level decision-making.

By Instrument Technology

  • Flow Cytometry Systems
  • Automated Hematology Analyzers
  • Coagulation Analyzers
  • Point-of-Care Hematology Testing
  • Hemoglobinopathy and Specialized Testing Systems

By End-Use Industry

  • Hospital Laboratories
  • Reference and Independent Laboratories
  • Physician Office Laboratories
  • Academic and Research Institutions
  • Blood Banks and Transfusion Centres

By Commercial Dimension

  • Direct Capital Equipment Sales
  • Reagent Rental and Managed Service Contracts
  • Service and Maintenance Agreements
  • Distributor and Wholesale Channels

By Region

  • North America
  • Western Europe
  • East Asia
  • South Asia and Pacific
  • Latin America
  • Middle East and Africa
  • Eastern Europe

Scope, Methodology, and Coverage

Every figure in this report is reproducible from documented input assumptions. The scope below maps the historical period, the forecast horizon, the segmentation dimensions, and the countries covered, alongside the underlying primary and qualitative methodology.
Historical Period
2020 to 2025
Forecast Period
2026 to 2036
Base Year
2025 (USD billions; MMA Primary Research Dataset, August 2026)
Market Definition
The hematology diagnostics market comprises instruments, reagents, and consumables used to analyse blood cell counts, morphology, and related parameters, valued at manufacturer revenue from equipment sales, reagent rental contracts, and associated services. It spans flow cytometry systems, automated hematology analyzers, coagulation analyzers, point-of-care hematology testing, and hemoglobinopathy and specialized testing systems across hospital, reference, and physician office laboratories. Molecular diagnostics, blood bank and transfusion screening equipment, and general clinical chemistry analyzers are excluded.
Quantitative Units
USD billions (current prices); installed instrument counts where applicable
Segmentation Dimensions
By Instrument Technology; By End-Use Industry; By Commercial Dimension; By Region
Regions Covered
North America, Western Europe, East Asia, South Asia and Pacific, Latin America, Middle East and Africa, Eastern Europe
Countries Covered
USA, China, Japan, Germany, South Korea, India, UK, France, Canada, Australia, Brazil, Mexico, UAE, Saudi Arabia, South Africa, Poland, Czech Republic, Hungary, Romania, Vietnam, Indonesia, Italy, Spain, Netherlands, and additional markets relevant to this sector
Key Companies Profiled
Sysmex Corporation, Beckman Coulter, Abbott Laboratories, Siemens Healthineers, Roche Diagnostics, Mindray Medical, Horiba Medical, Nihon Kohden, bioMerieux, Werfen, Diatron, Boule Diagnostics, EKF Diagnostics, Erba Mannheim, Radiometer, CellaVision, Quotient Suisse, PZ Cormay, Diagon Diagnostics, HemoCue
Quantitative Methodology
Primary survey, n=3,800 respondents, Q4 2025, six countries; demand-side model with trade association cross-validation
Qualitative Methodology
47 expert interviews, Q4 2025; applied to validate demand model assumptions, identify emerging dynamics, and assess competitive positioning
Report Format
PDF and XLSX data workbook (Word format preview document)
Publisher
Market Minds Advisory
Report Code
MMA-2026-MED-120
Published
August 2026
Contact
sales@marketmindsadvisory.com | www.marketmindsadvisory.com

Purchase the full Hematology Diagnostics Market Report (2026 to 2036).

The full MMA Hematology Diagnostics report sizes the market across five instrument technologies, five end-use industries, four commercial dimensions, and seven regions through 2036. It profiles 20 companies on a consistent manufacturing revenue basis, scoring each on reagent chemistry depth, flow cytometry breadth, and service relationship strength. Scenario models quantify how reagent rental adoption, cytometry expansion, and component cost volatility move both revenue and margin by technology. The report also includes reagent rental penetration benchmarking, service contract revenue tracking, and laboratory consolidation trend analysis for commercial and laboratory leadership teams.
Five-technology and four-dimension market sizing to 2036
Twenty-company benchmark on manufacturing revenue basis
Reagent rental penetration and pricing benchmarking by region
Flow cytometry adoption tracking across hospital laboratories
Service contract and maintenance revenue modelling
Laboratory consolidation and vendor selection trend analysis

Built For The People Who Decide

From boardroom strategy to bench-side execution, this report is read cover-to-cover by leaders shaping the next decade of their industry, turning demand scenarios, market dynamics and valuation benchmarks into decisions.
CXOs/ Presidents/ VPs/ Managers
M&A and Corporate Development
Strategy Teams and R&D Heads
Procurement and Product Directors
Regulatory and Compliance Leaders
Investor Relations and Equity Analysts