
Market Minds Advisory
Bioenzyme Fertilizer Market

Bioenzyme Fertilizer Market: Living Products Sold Into A Dead Supply Chain

A commercial reading of enzyme and microbial crop inputs, where the biology works in the trial plot and then sits on a hot warehouse shelf for eleven months before anybody applies it.

Lead Analyst

Bilal Shaikh

Published

September 2026

Make Smarter Decisions with Customized Research Insights

Request a free sample report and evaluate market opportunities, growth trends, and competitive dynamics relevant to your business needs.

2025 MARKET VALUE$2.8BMarket Size 2025
2036 FORECAST VALUE$9.5BBase Case , 2026 to 2036
CAGR 2026 TO 203611.7 %Bull 13.0% / Bear 10.3%
INCREMENTAL OPPORTUNITY$6.4BNet 10- year value creation
EXPANSION MULTIPLE3.04x2036 value over 2026 base
Strategic Levers
M&A Pipeline
Regional Outlook
Country Rankings
Competitive Intelligence
Segmental Deep-dive
Call-Us : 91 93563 13602

Executive Snapshot and Market Trajectory

The science is not what holds this category back. A microbial inoculant that performs beautifully in a trial plot has to survive manufacture, distribution through a hot warehouse, and a farmer who applies it eleven months later. Shelf stability is the commercial product. Everything commercial follows from that.
The market stands at USD 2.8 billion in 2025 and reaches USD 9.51 billion by 2036 at an 11.7% CAGR. Nutrient solubilising microbial inoculants grow fastest at 16.8%, about 1.44 times the overall rate, because they reduce purchased phosphate and potash rather than merely promising better soil. North America holds 26% of value on row crop input programmes and evidence standards, while India posts the quickest national growth at 17.4%.
Fragmentation is extreme, with the top five holding roughly 22% of bioenzyme fertilizer revenue across agrochemical majors, specialist biologicals firms, and a long tail of regional formulators. Two forces pull against each other. Fertiliser cost spikes and nitrogen regulation keep pushing growers to try biological inputs, while inconsistent field performance and the absence of any credible efficacy standard keep them from committing acreage at scale. Commitment follows consistency, and consistency has simply not arrived yet.
Market Definition
The bioenzyme fertilizer market covers crop nutrition inputs whose active function is enzymatic or microbial, spanning nutrient solubilising microbial inoculants, nitrogen fixing inoculants, enzyme and metabolite formulations, mycorrhizal and root symbiont products, and organic matter decomposition consortia. Conventional mineral and synthetic fertilisers, compost, manure and bulk organic amendments sold on nutrient content, biological crop protection products targeting pests and disease, plant growth regulators of synthetic origin, soil conditioners sold on physical properties, and agronomy advisory services are excluded.
Base Year Value
$2.8B in 2025 (MMA Primary Research Dataset, August 2026)
Forecast Period
2026 to 2036, eleven discrete annual values
CAGR
11.7% base case. Bull 13.0%. Bear 10.3%.
Fastest Growth Segment
Nutrient Solubilising Microbial Inoculants: 16.8% CAGR
Fastest Growth Country
India: 17.4% CAGR
Fastest Growth Region
South Asia and Pacific: 14.0% CAGR
Largest Region
North America: 26% of 2025 global value
Market Leaders
Novonesis, Syngenta Biologicals, UPL, Corteva Agriscience, Rizobacter. Source: MMA Analysis based on company annual reports.
Primary Survey
n=3,800 procurement and R&D decision-makers, Q4 2025, six countries
Methodology
Demand-side build-up, cross-validated against public data, 47 expert interviews

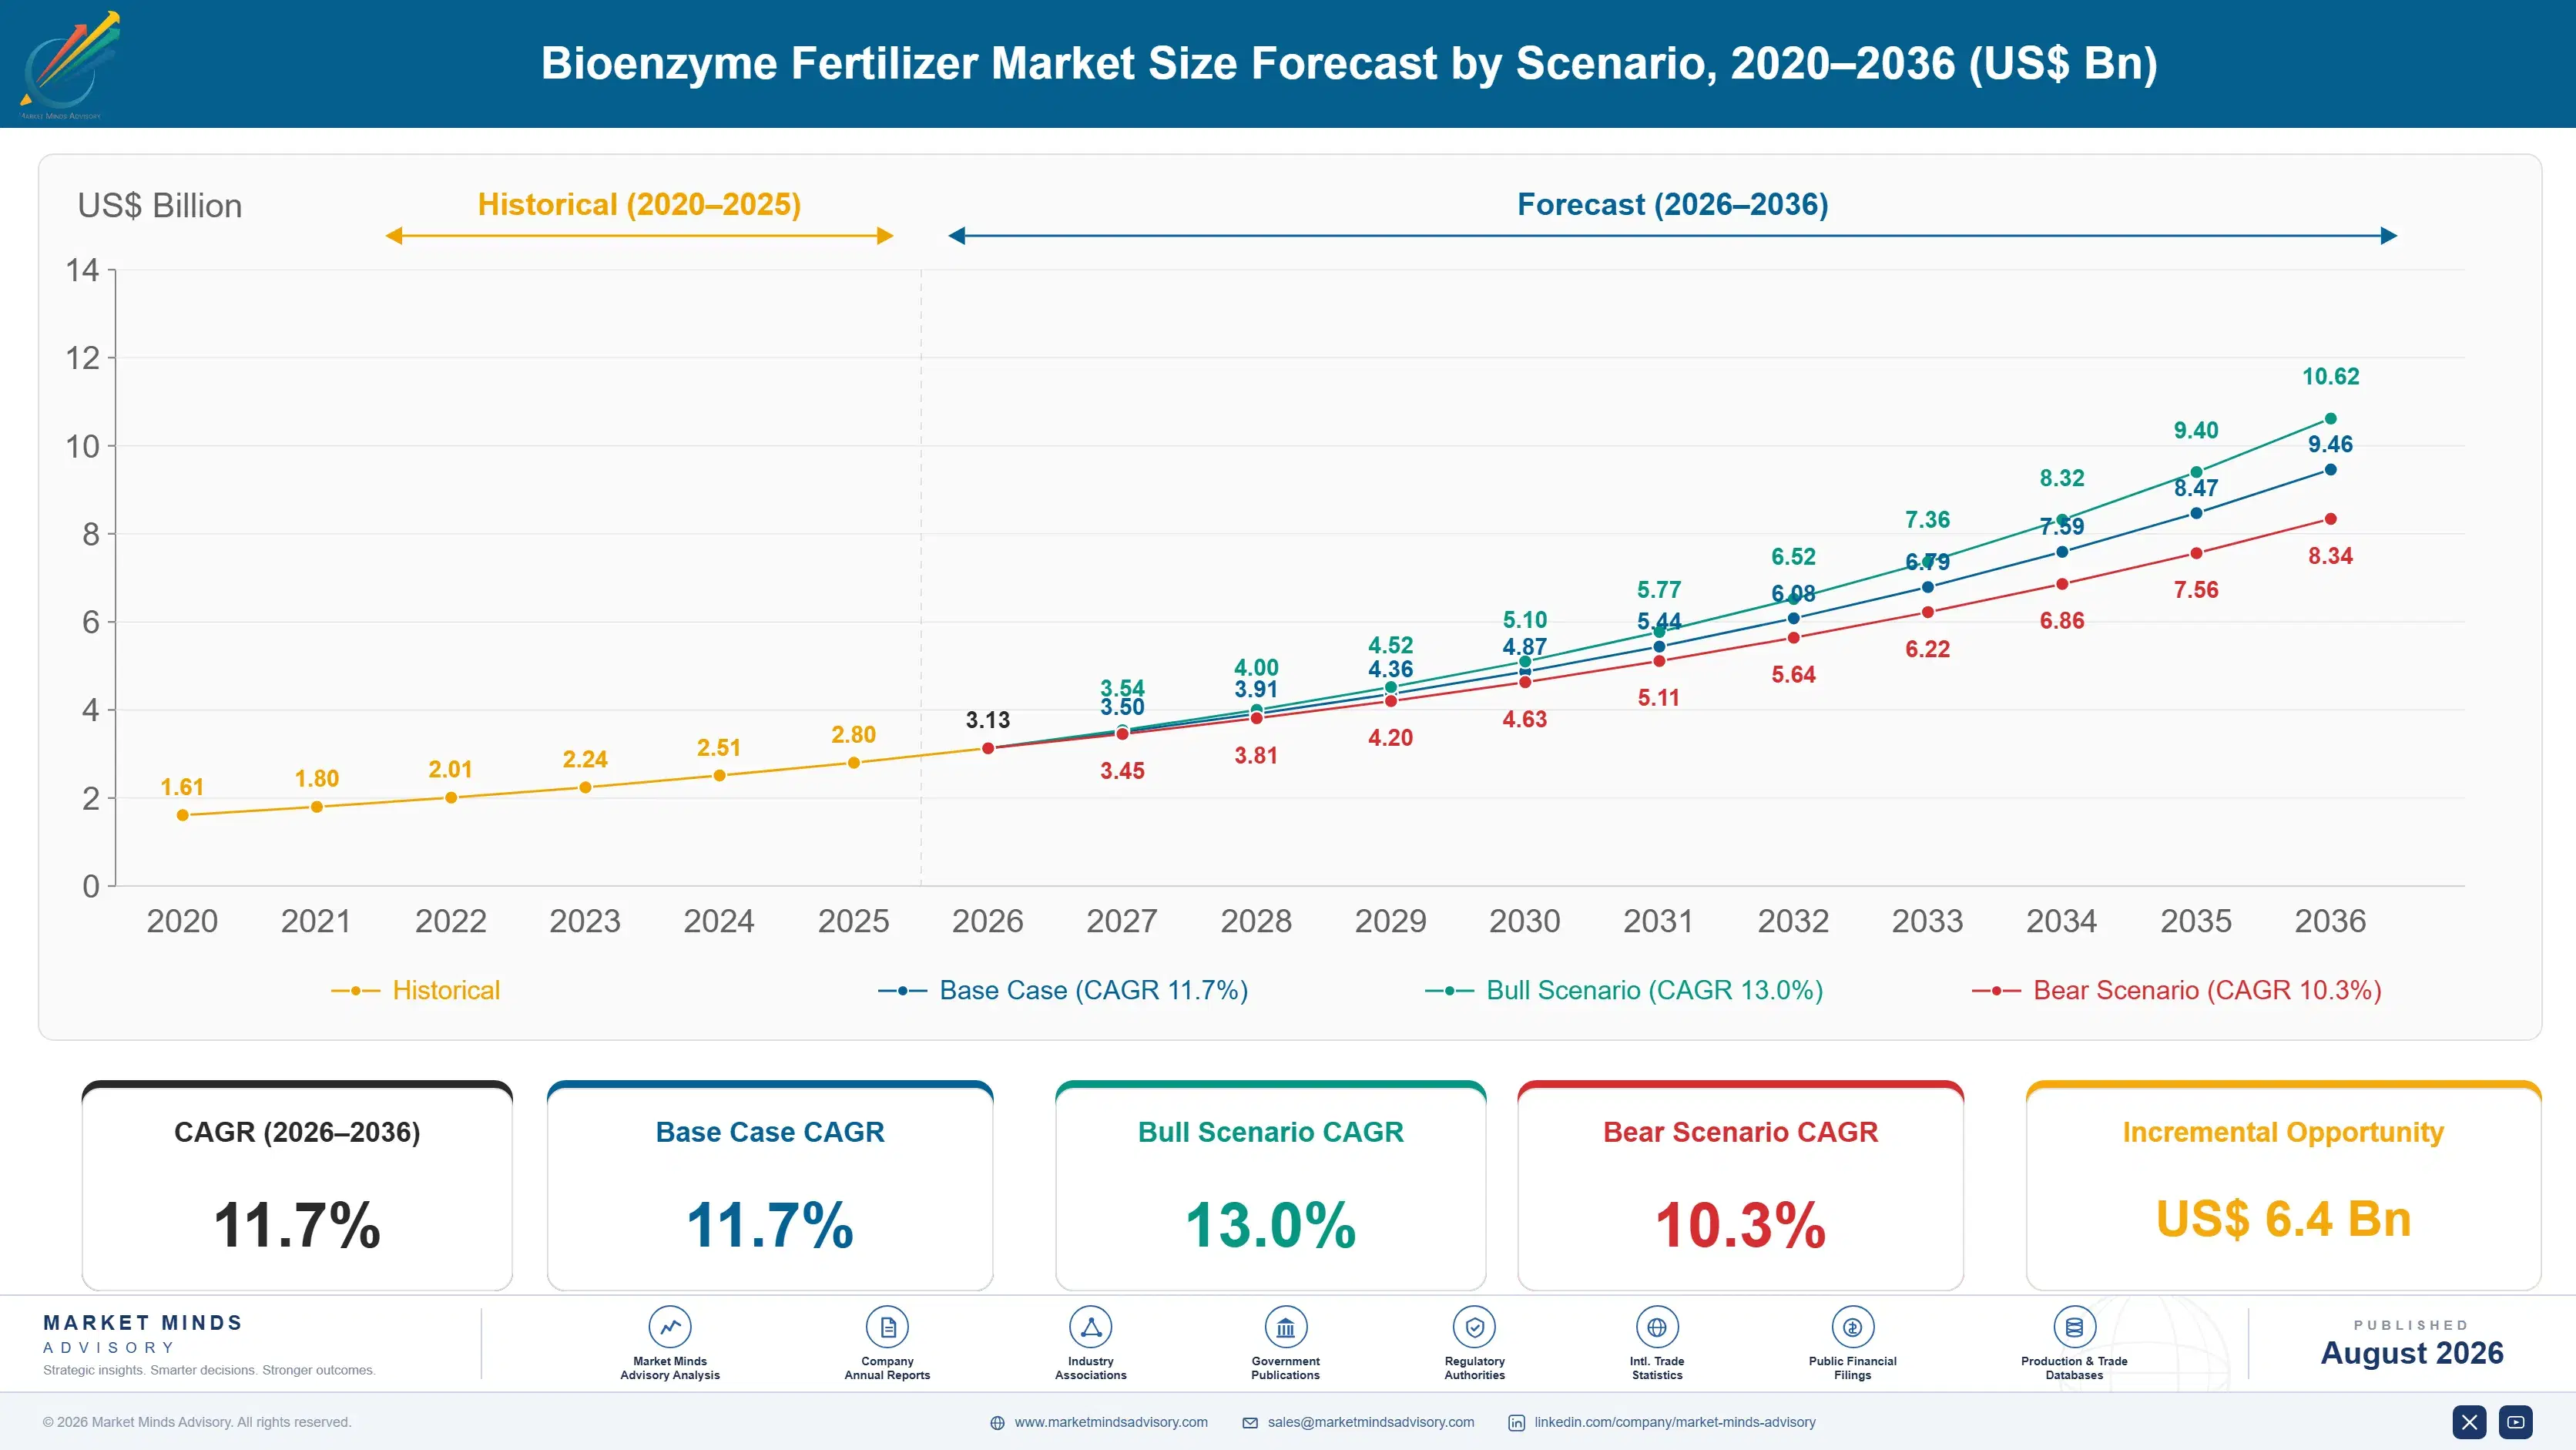
Bioenzyme Fertilizer Market Forecast Scenarios

bioenzyme-fertilizer-market-size-forecast-scenario-1787332023795
Growth from 2020 to 2025 compounded near 10.4%, and fertiliser pricing rather than any product improvement drove most of it. Nitrogen and phosphate costs spiked through 2021 and 2022 as gas prices rose and export curbs bit, and growers who had ignored biologicals ran trials. Retention afterwards was mixed, because inconsistent results gave many of them reason to stop. The category kept growers whose soils responded.
Three mechanisms carry the base case to 11.7%. First, nutrient use efficiency pressure, where nitrogen rules and fertiliser cost both reward anything that reduces purchased input per tonne. Second, subsidy reform across large smallholder markets, which is shifting support away from urea toward biological and balanced nutrition. Third, formulation improvement in shelf stability, which addresses why most of these products underperformed in a farmer's hands rather than in a trial.
The bull case at 13.0% assumes efficacy standards emerge and shelf stability improves enough to make field results predictable, which would convert trial acreage into programme volume. The bear case at 10.3% assumes performance stays inconsistent, growers revert to mineral fertiliser whenever its price falls, and the absence of any efficacy standard lets poor products discredit the whole category in every market they reach.

Biology That Has To Survive The Warehouse

Demand rests on three foundations. Fertiliser economics provide the pull, since anything reducing purchased nitrogen or phosphate per tonne earns attention whenever input prices rise. Nutrient regulation provides the obligation, because nitrate limits and application caps force growers to find efficiency somewhere. And shelf stability provides the ceiling, since a product whose biology died in the warehouse cannot perform whatever the trial said.
MARKET CONCENTRATIONCR5: 22%Among the most fragmented input categories in commercial agriculture
PRODUCT SHELF LIFE6 to 18 monthsViable period before biological activity falls below label claim
FIELD RESPONSE VARIABILITYMinus 5% to 25%Yield response range reported across comparable trial sites
REPEAT PURCHASE RATEAbout 41%Growers buying a second season after an initial trial
INPUT COST SHARE3% to 9%Biological product against total crop nutrition spending overall
REGISTRATION TIMELINE1 to 4 yearsApproval period varying enormously between different regulatory jurisdictions
Commercially the number that matters most is repeat purchase. Around 41% of growers who trial a biological input buy it again, which is a verdict on field consistency rather than marketing. Yield response across comparable sites runs from minus 5% to plus 25%, and a grower who lands in the negative half does not return. That variability, not price, keeps this category at 3% to 9% of crop nutrition spend.
The next decade turns on whether efficacy becomes verifiable. No recognised standard exists in most markets, which lets products with no meaningful activity sit alongside effective ones and discredit them together. Solubilising inoculants at 16.8% growth have the clearest case, because reduced phosphate purchase is measurable. Everything depending on soil health claims is far harder for a grower to verify or a regulator to police.
"Four in ten growers buy this stuff twice. Nobody in the industry likes that number, but it is the only honest measure of whether the biology survived the journey from the fermenter to the field, and it explains far more about this market than any trial dataset does."
Director, Agricultural Biologicals and Crop Nutrition Practice · MMA Agriculture

Market Trends

Shelf Stability Becomes The Real Product Development Target

Formulation rather than strain discovery now absorbs most development spend at serious producers, because a viable count that meets label claim at dispatch and fails it at application is worthless regardless of the biology involved. Shelf life of six to 18 months sounds adequate until distribution through unrefrigerated warehouses in hot climates is included. Spore-forming strains, encapsulation, dried carriers, and metabolite formulations that need no living organism at all are the approaches being pursued. Repeat purchase near 41% is the number this work is genuinely trying to move. Nothing else moves that number.
Market Impact: Caps limit nitrogen to 170 kilogram
Subsidy Reform Redirects Support Away From Urea

Large smallholder markets have spent decades subsidising nitrogen so heavily that biological alternatives could never compete on cost, and several are now deliberately unwinding that. India's shift toward balanced nutrition and direct benefit transfer changes relative pricing in a market of very large acreage. The effect is policy-driven rather than agronomic, which makes it fast when it happens and reversible when governments change. Distribution through cooperative and government channels rather than private retail follows the same logic and reaches growers no commercial network touches. Policy moves faster than agronomy ever does.
Market Impact: Segment grows at 16.8% yearly

Market Opportunities and Growth Drivers

Nutrient Regulation Forces Efficiency Somewhere In The Programme

Nitrate directives, application caps, and water quality rules across Europe and increasingly elsewhere limit how much nitrogen a grower may apply regardless of what the crop could use. That obliges growers to find yield from efficiency rather than from volume, which is precisely the claim biological inputs make. Compliance is not optional and the alternative is reduced planted area or reduced yield. This is the one driver that does not weaken when fertiliser prices fall, which makes it the most dependable demand in the category. Compliance does not weaken when prices fall.
Market Impact: Response ranges 30 percentage point

Solubilising Products Show Up On A Fertiliser Invoice

A nutrient solubilising inoculant that releases bound phosphate already present in the soil lets a grower buy less phosphate, and that shows on a purchase invoice in a way soil health claims never do. Verifiability is the entire commercial advantage, which is why this segment grows at 16.8% against a category at 11.7%. Phosphate pricing volatility strengthens the case further whenever it spikes. Growers who cannot measure a benefit stop buying after one season, and this is the one benefit most of them can actually measure. Measurability is the entire commercial case.
Market Impact: Efficacy unregulated in 40 markets

Market Restraints and Challenges

Field Response Varies Too Widely For Programme Commitment

Yield response across comparable trial sites runs from minus 5% to plus 25%, and a grower landing in the negative half does not buy again, which is why repeat purchase sits near 41%. The root cause is that biological performance depends on soil type, existing microbial population, moisture, and temperature in ways a mineral fertiliser does not. Commercially this keeps the category at trial scale rather than programme scale. Participants mitigate through soil testing to predict response, strain selection matched to conditions, and honest targeting of the fields where products actually work.
Market Impact: Viability lasts 6 to 18 months

No Efficacy Standard Separates Real Products From Nothing

Most markets regulate these inputs for safety and contamination but not for efficacy, which means a product with no meaningful biological activity can be registered and sold alongside one that works. The root cause is that regulators built frameworks for chemical inputs where the active ingredient is measurable, and living products resist that approach. Commercially this lets poor products discredit the whole category in a grower's experience. Participants mitigate through third-party trial programmes, viable count guarantees on label, and pushing regulators toward performance-based registration. Living products resist chemical registration frameworks entirely.
Market Impact: Reform covers 140 million hectares
4 additional market trends, 3 additional growth drivers, and 2 additional restraints and challenges are covered in the full report. Contact sales@marketmindsadvisory.com to access the complete intelligence.

Segment CAGR and Growth Architecture

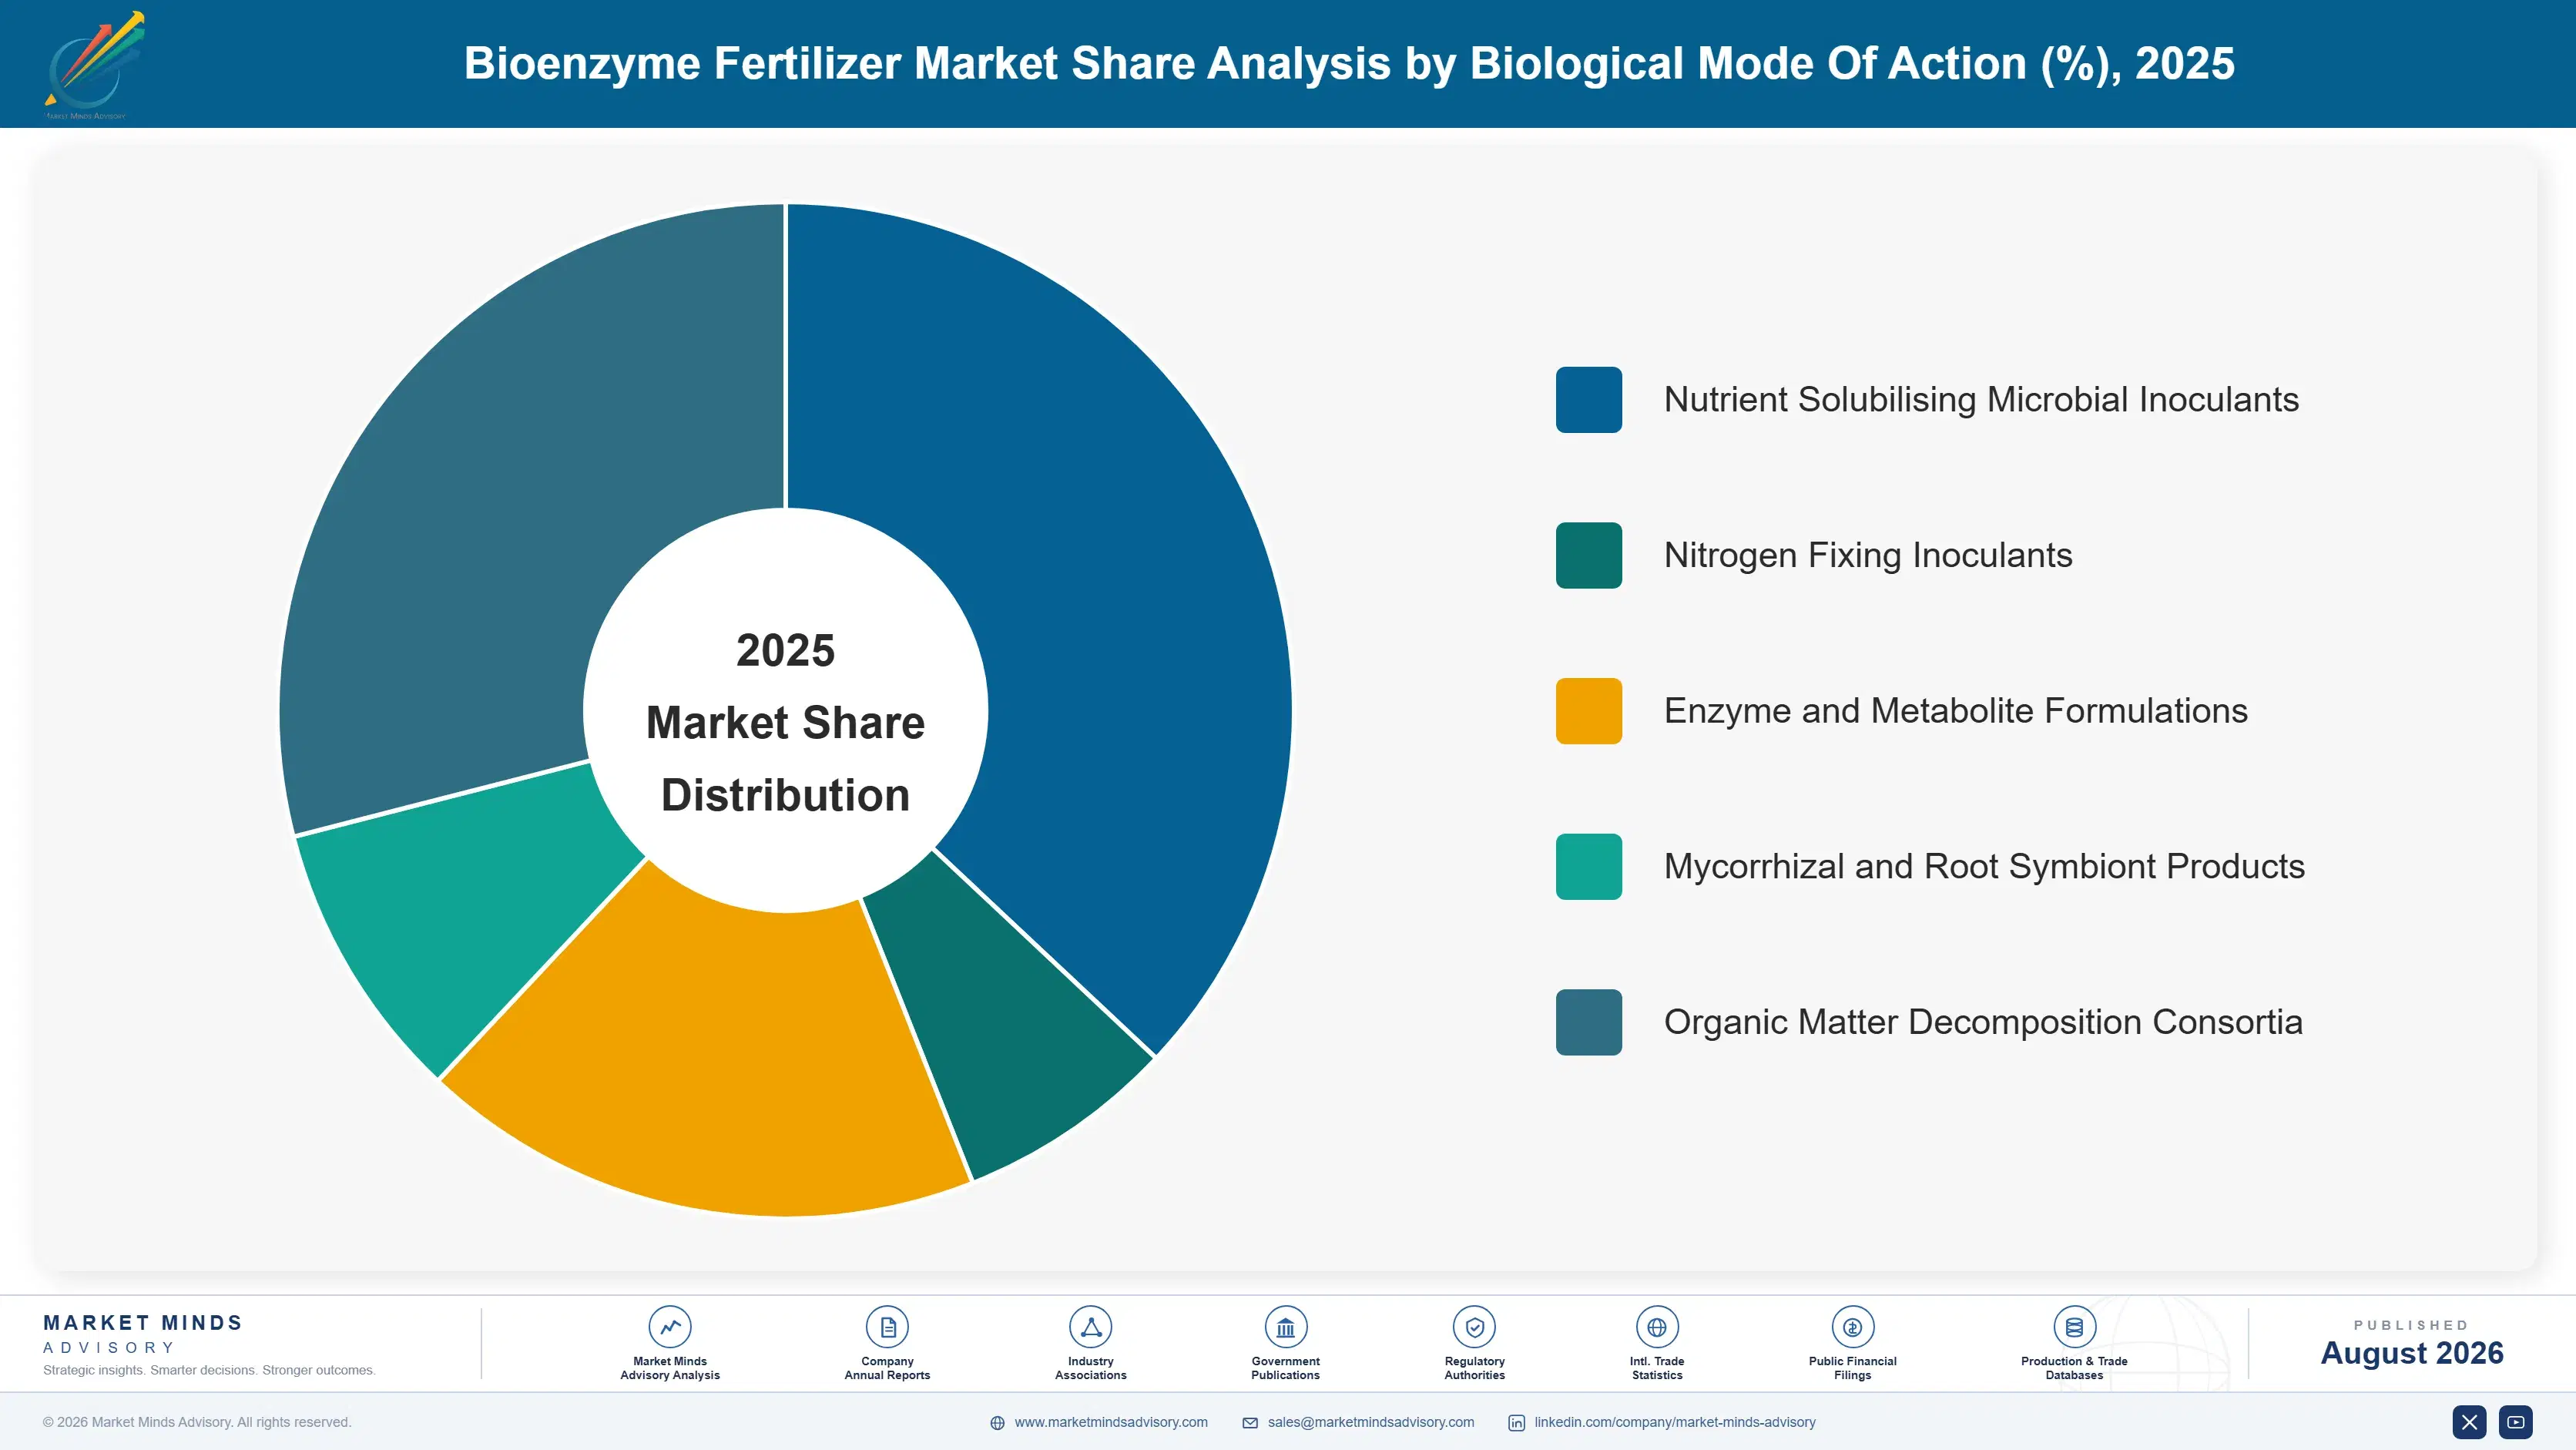
Segmentation follows biological mode of action, a single classification describing how the product delivers its nutritional effect. Each mode carries its own production route, shelf stability challenge, verifiability, and regulatory treatment, so economics track the mechanism rather than the crop applied to. End-use crop group and distribution channel appear separately within the framework as their own distinct dimensions.
bioenzyme-fertilizer-market-market-share-analysis-1787332024343

Nutrient Solubilising Microbial Inoculants

Nutrient solubilising microbial inoculants grow fastest at 16.8%, about 1.44 times the overall 11.7% rate, and verifiability rather than any performance advantage explains it. Organisms that release phosphate and potassium already bound in the soil let a grower reduce purchased fertiliser, which appears on an invoice rather than in a soil health narrative nobody can check. Phosphate price volatility strengthens that case whenever it spikes. Shelf stability remains the practical constraint, since these are living organisms shipped through warehouses that reach forty degrees. Spore-forming strains and dried carrier formulations are the routes producers are taking to solve it. Verifiable benefit rather than biology is what converts a trial into a programme here.
CAGR 16.8%

Nitrogen Fixing Inoculants

Nitrogen fixing inoculants grow at 13.4%, the second-fastest mode, and they carry the longest commercial history of anything in this category. Rhizobium products for soybean, pulses, and other legumes have been sold for decades with well-understood agronomy and genuinely predictable response, which is why growers trust them where they distrust newer biologicals. Free-living and associative nitrogen fixation for cereals is a much harder proposition and results remain inconsistent despite considerable investment. Nitrogen regulation and fertiliser cost both support demand. The legume market is mature and the cereal opportunity is where the growth and the disappointment both sit. Trust built over decades is the asset, and it does not transfer to cereals.
CAGR 13.4%
Full segment breakdown across 5 segments available in the complete report.

Regional Architecture and Country Demand Map

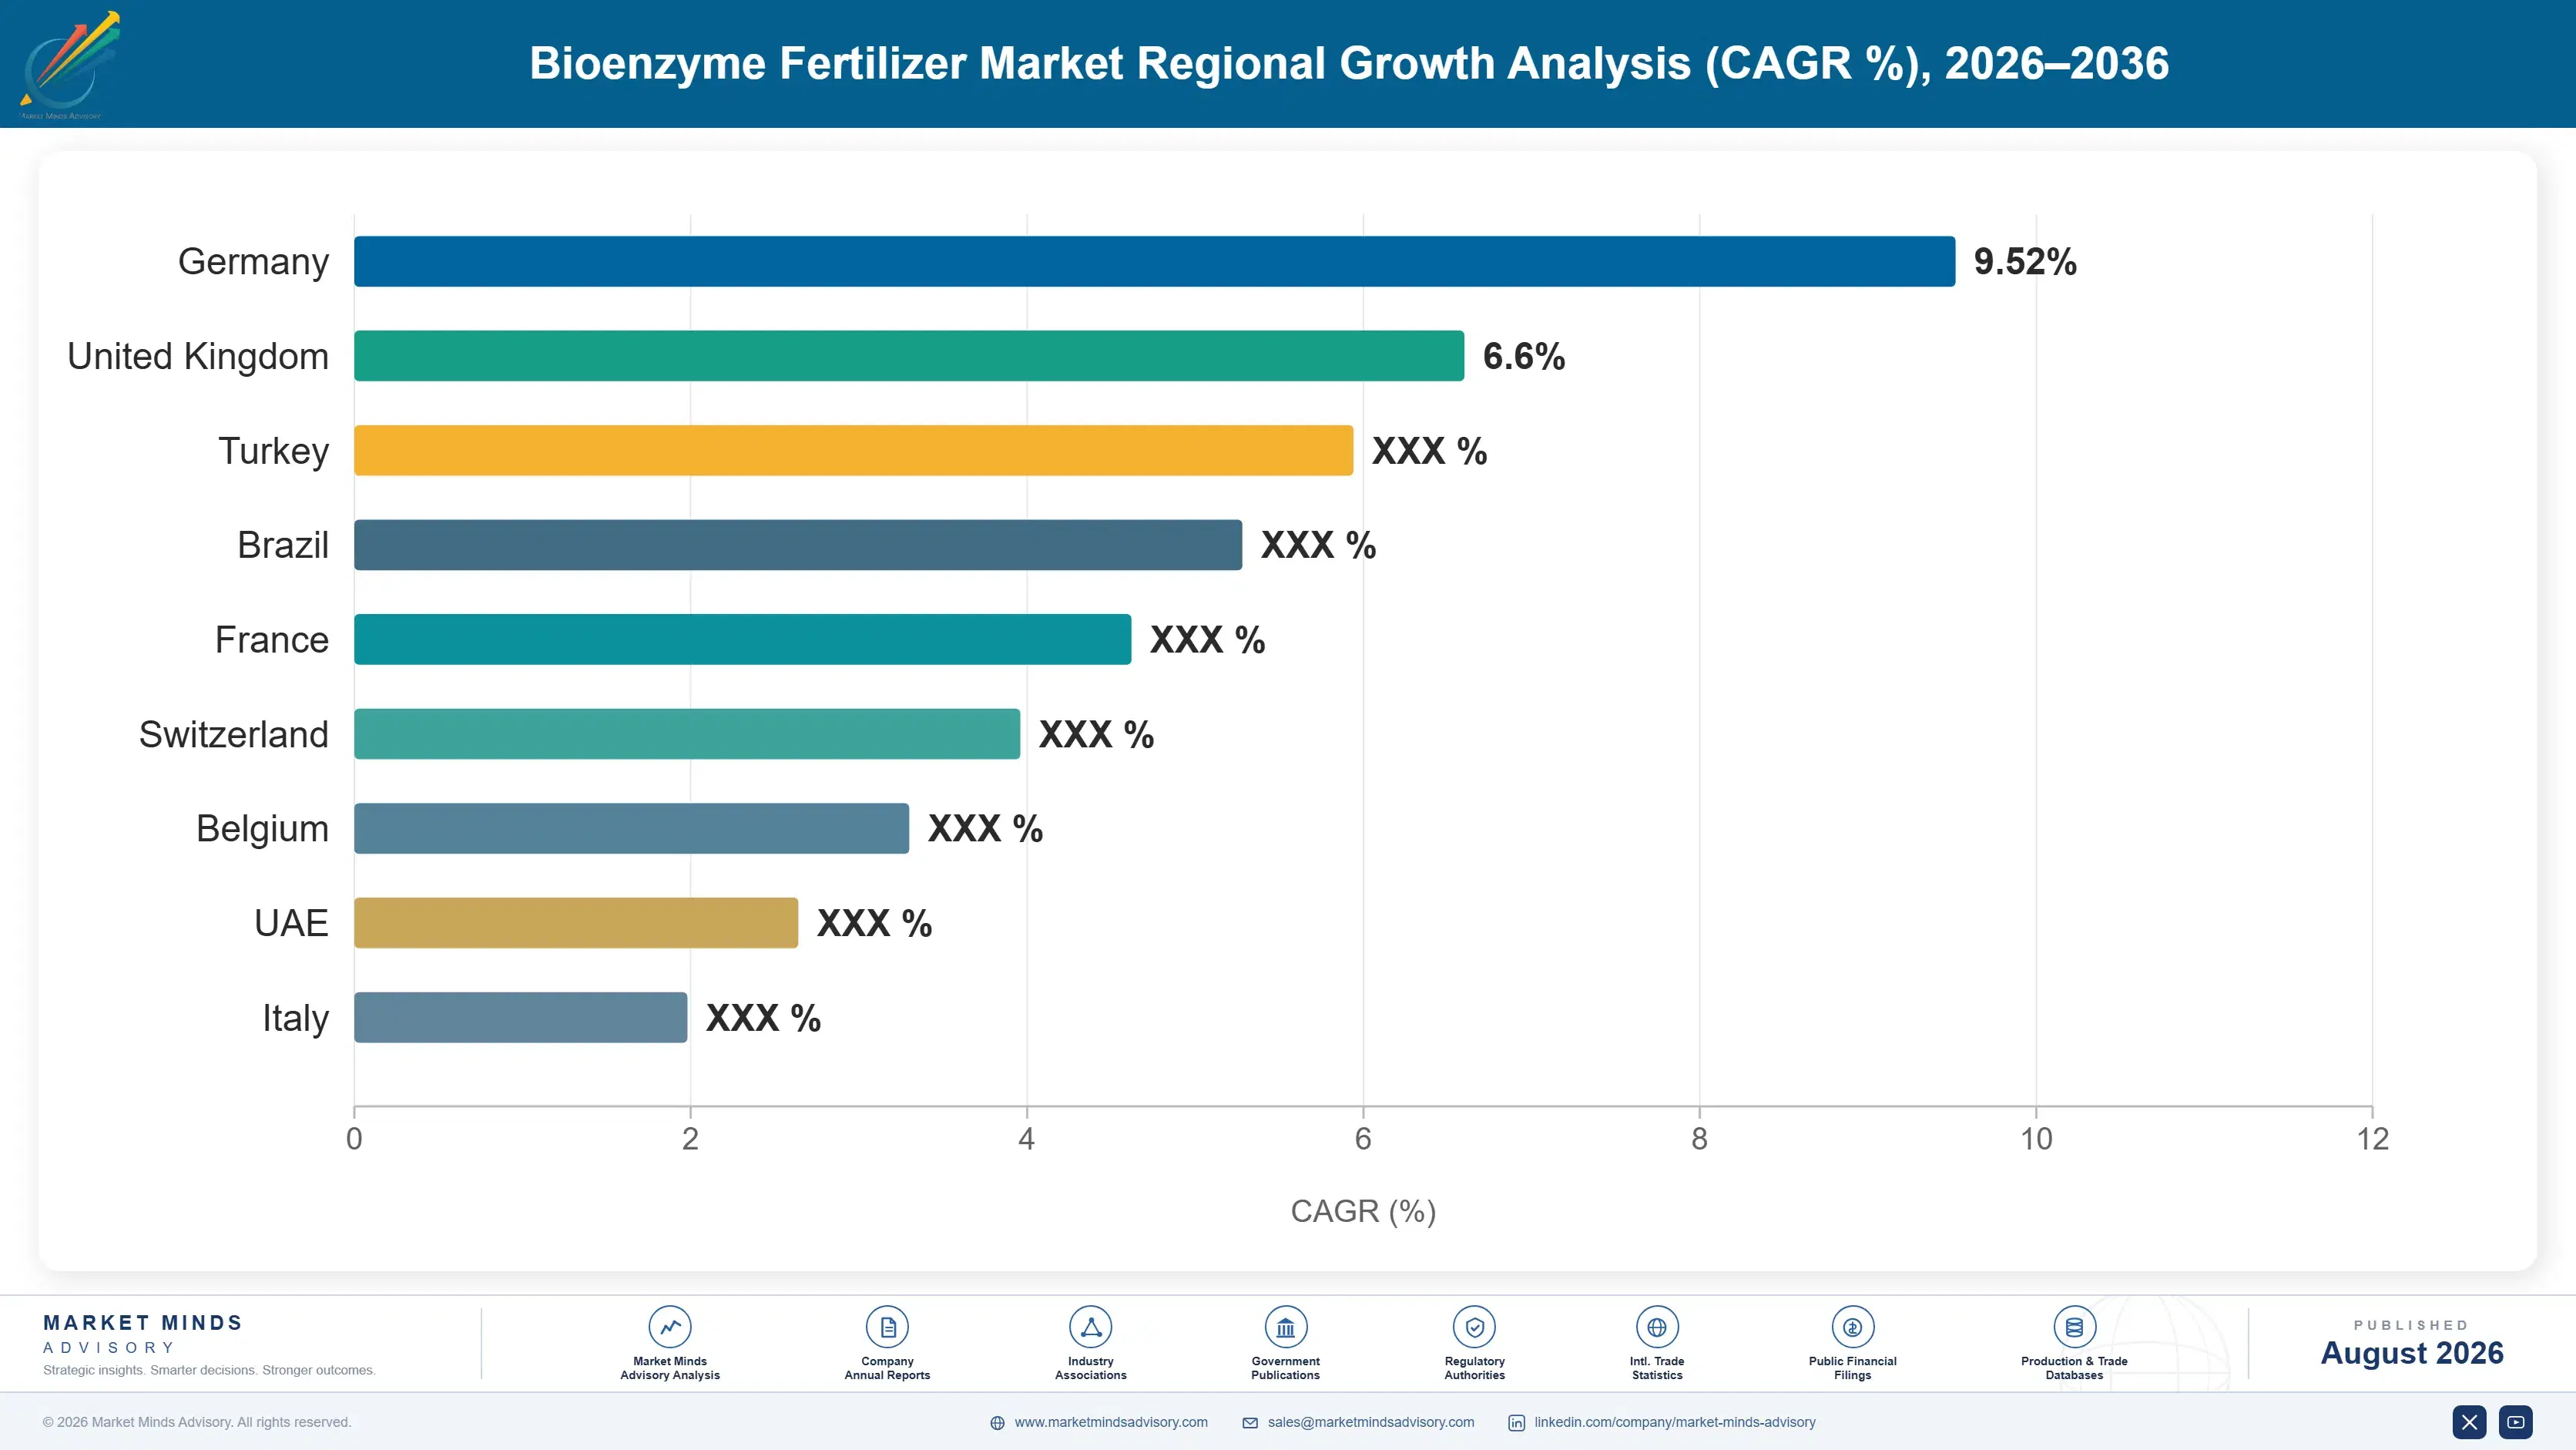
Subsidy policy and nutrient regulation together set this distribution rather than acreage alone. North America leads on row crop input spending and evidence standards, while South Asia and Pacific grows quickest as support shifts away from heavily subsidised urea. Verifiability rather than acreage decides adoption everywhere else.

North America

North America holds 26% of value, and large-scale row crop economics rather than regulation shape adoption. Growers here run precise input programmes with agronomic support and measure return per acre carefully, which favours products with verifiable effects and punishes vague soil health claims quickly. Soybean rhizobium inoculation is near universal and effectively a mature market. Retailer and agronomist recommendation carries enormous weight, so distribution through established crop input channels matters more than direct marketing. Growth of 10.6% reflects steady expansion in solubilising and biostimulant products against a very demanding evidence standard. Evidence expectations here are the highest anywhere, and vague soil health claims get dismissed almost immediately by agronomists and growers alike.
Share: 26% | CAGR: 10.6% (2026 to 2036)

Western Europe

Nutrient regulation defines this market more than economics do. Western Europe holds 24% of value, with nitrate directive application caps and water quality obligations forcing growers to find efficiency rather than apply more, which is the one demand driver that survives falling fertiliser prices. Registration frameworks are considerably more demanding than elsewhere and slow product introduction accordingly. Organic and low-input production is a meaningful share of acreage and a natural fit. Grower scepticism is high and evidence expectations correspondingly strict. Growth of 10.0% is the slowest of the seven regions, reflecting regulatory pull against registration friction. Registration friction rather than grower reluctance is what actually slows this category here most.
Share: 24% | CAGR: 10.0% (2026 to 2036)
Regional intelligence for 5 additional markets available in the complete report: East Asia, South Asia and Pacific, Latin America, Middle East and Africa, Eastern Europe. Contact sales@marketmindsadvisory.com.
bioenzyme-fertilizer-market-country-cagr-analysis-1787332024869

Where Biological Input Margin Actually Holds

Selling a yield claim into a category where four in ten growers buy twice is a marketing problem dressed as an agronomy one. The four moves below work on what actually decides repeat purchase: shelf stability, verifiable benefit, targeting the fields that respond, and reaching the channels growers actually trust. None of them is a claim.

Solve Shelf Stability Before Improving The Strain

A product meeting viable count at dispatch and failing it at application is worthless regardless of the biology, and shelf life of six to 18 months rarely survives distribution through unrefrigerated warehouses in hot climates. Repeat purchase near 41% is largely a stability verdict rather than an efficacy one. Spore-forming strains, encapsulation, dried carriers, and metabolite formulations needing no living organism all address it directly. Producers still funding strain discovery ahead of formulation are optimising the part of the problem that already works. That is the part that already works.
Market Impact: Repeat purchase across the category

Sell Benefits That Appear On A Purchase Invoice

A solubilising product that lets a grower buy less phosphate is verifiable in a way soil health improvement never is, which is why that segment grows at 16.8% against a category at 11.7%. Growers who cannot measure a benefit stop buying after one season, and most biological claims are unmeasurable at farm level. Choosing product positioning by verifiability rather than by biological interest is uncomfortable for development teams. It is also the difference between trial acreage and programme acreage. Development teams resist this framing, and commercial results eventually settle the argument.
Market Impact: Verifiable modes grow at 16.8% agai

Target The Fields That Actually Respond

Yield response runs from minus 5% to plus 25% across comparable sites, and selling to the grower whose soil will land in the negative half destroys the relationship and the category reputation together. Soil testing to predict response costs money and reduces addressable acreage, which every commercial team resists. It also lifts repeat purchase, which is the only number that compounds. Honest targeting is the least popular and most effective commercial discipline available in biological inputs anywhere. Broad selling looks like growth on a forecast and produces product returns instead, season after season.
Market Impact: Yield response spans 30 percentage

Earn The Agronomist And Cooperative Recommendation

Growers take input decisions on advice from retail agronomists, cooperative technical staff, and neighbours, not from product literature, and a category with a credibility problem depends on that recommendation more than most. Third-party trial data with named institutions carries weight that company trials do not. In subsidy-reform markets the cooperative and government channel reaches growers no commercial network touches at all, covering acreage measured in the hundreds of millions of hectares. Building that access takes years and cannot be bought. Named institution trials cost 3 seasons and buy credibility nothing else does.
Market Impact: Cooperative channels alone reach so

Who Controls the Margin Pool

Fragmentation is extreme: the top five hold roughly 22% of bioenzyme fertilizer revenue, across agrochemical majors, specialist biologicals firms, and a very long tail of regional formulators of highly variable quality. The gap between leaders and challengers is formulation and distribution rather than strain libraries, which are widely available. All participants here are assessed on one basis, revenue from enzymatic and microbial crop nutrition product sales, excluding mineral fertilisers, bio
Competition runs along four lines. First, shelf stability formulation, since that decides whether the product works in a grower's hands. Second, distribution and agronomist relationships, because recommendation drives purchase in every market. Third, verifiable benefit positioning, as growers stop buying what they cannot measure. Fourth, trial evidence from named third-party institutions, which carries credibility that company data does not.

Pressure is building from two directions. Poor-quality regional products discredit the category wherever efficacy goes unregulated, which is most markets. Meanwhile agrochemical majors are acquiring biologicals capability and bringing distribution reach specialists cannot match. Rankings should favour producers with proven shelf stability and verifiable positioning over those competing on strain novelty or soil health narrative alone.
bioenzyme-fertilizer-market-company-positioning-matrix-1787332025393

Competitive Moat and Risk Dimensions

NOVONESIS

Moat: Fermentation scale and formulation depth

Novonesis brings industrial fermentation and enzyme formulation capability from a far larger business into agricultural biologicals, which addresses shelf stability as a manufacturing problem rather than a research one. Consistency of viable count between batches is genuinely difficult and it manages that better than most. Partnerships with agrochemical distributors give it reach specialists would take years to build.
NOVONESIS

Risk: Partner dependence and field variability

Route to market runs largely through partners who own the grower relationship and the recommendation that drives purchase, which limits pricing capture. Field response variability affects its products as much as anybody else's, since soil conditions rather than product quality drive much of it. Agricultural biologicals also remain small against the wider enzyme business and compete internally for development attention.
SYNGENTA BIOLOGICALS

Moat: Distribution reach and agronomic support

Syngenta reaches growers through crop protection distribution and agronomist relationships built over decades, which matters enormously in a category where recommendation decides purchase and credibility is scarce. Bundling biologicals into established input programmes gets them onto acreage that standalone products struggle to reach. Trial infrastructure and agronomic support capability are considerably deeper than specialist competitors can fund.
SYNGENTA BIOLOGICALS

Risk: Portfolio conflict and evidence standards

Selling biological inputs that reduce mineral fertiliser and chemical usage sits awkwardly alongside a portfolio built on those products, and internal incentives rarely resolve cleanly. Grower scepticism attaches to biologicals sold by companies whose reputation was built elsewhere. Acquired biologicals capability also needs integrating into commercial models designed around chemistry with entirely different shelf life assumptions.

Players Tracked

Prominent Players

Novonesis
Syngenta Biologicals
UPL
Corteva Agriscience
Rizobacter

Other Key Players

BASF Agricultural Solutions
Bayer Crop Science
Lallemand Plant Care
Valagro
Koppert Biological Systems
Symborg
Agrinos
Kula Bio
Pivot Bio
Sumitomo Chemical
T Stanes and Company
International Panaacea
Biobest Group
Andermatt Group
Certis Belchim

Recent Developments

FEBRUARY 2025

Indian subsidy reform extends support toward biological nutrition

Policy support widened further from heavily subsidised urea toward balanced nutrition and biological inputs across very large smallholder acreage, changing relative pricing that agronomic argument had never shifted. This was subsidy policy rather than any commercial transaction, and it moved demand through cooperative and government channels rather than private retail.
Signal: Policy changes relative pricing overnight
SEPTEMBER 2024

Shelf stability formulation programmes advance across producers

Several producers moved spore-forming strain, encapsulation, and dried carrier formulations into commercial products aimed at surviving unrefrigerated distribution in hot climates. These were product development launches rather than acquisitions or joint ventures, and they target the reason repeat purchase has stayed near four in ten growers.
Signal: Formulation rather than strain discovery i
MAY 2024

Agrochemical majors continue acquiring biologicals capability

Further acquisitions of specialist biologicals businesses by large crop input companies proceeded across several markets, bringing distribution reach and agronomic support to products that had been sold by small firms. These were acquisitions rather than joint ventures or partnerships, and they concentrated a previously very fragmented supply base modestly.
Signal: Distribution reach rather than any product

Fermentation Feedstock, Carriers, Energy, Packaging

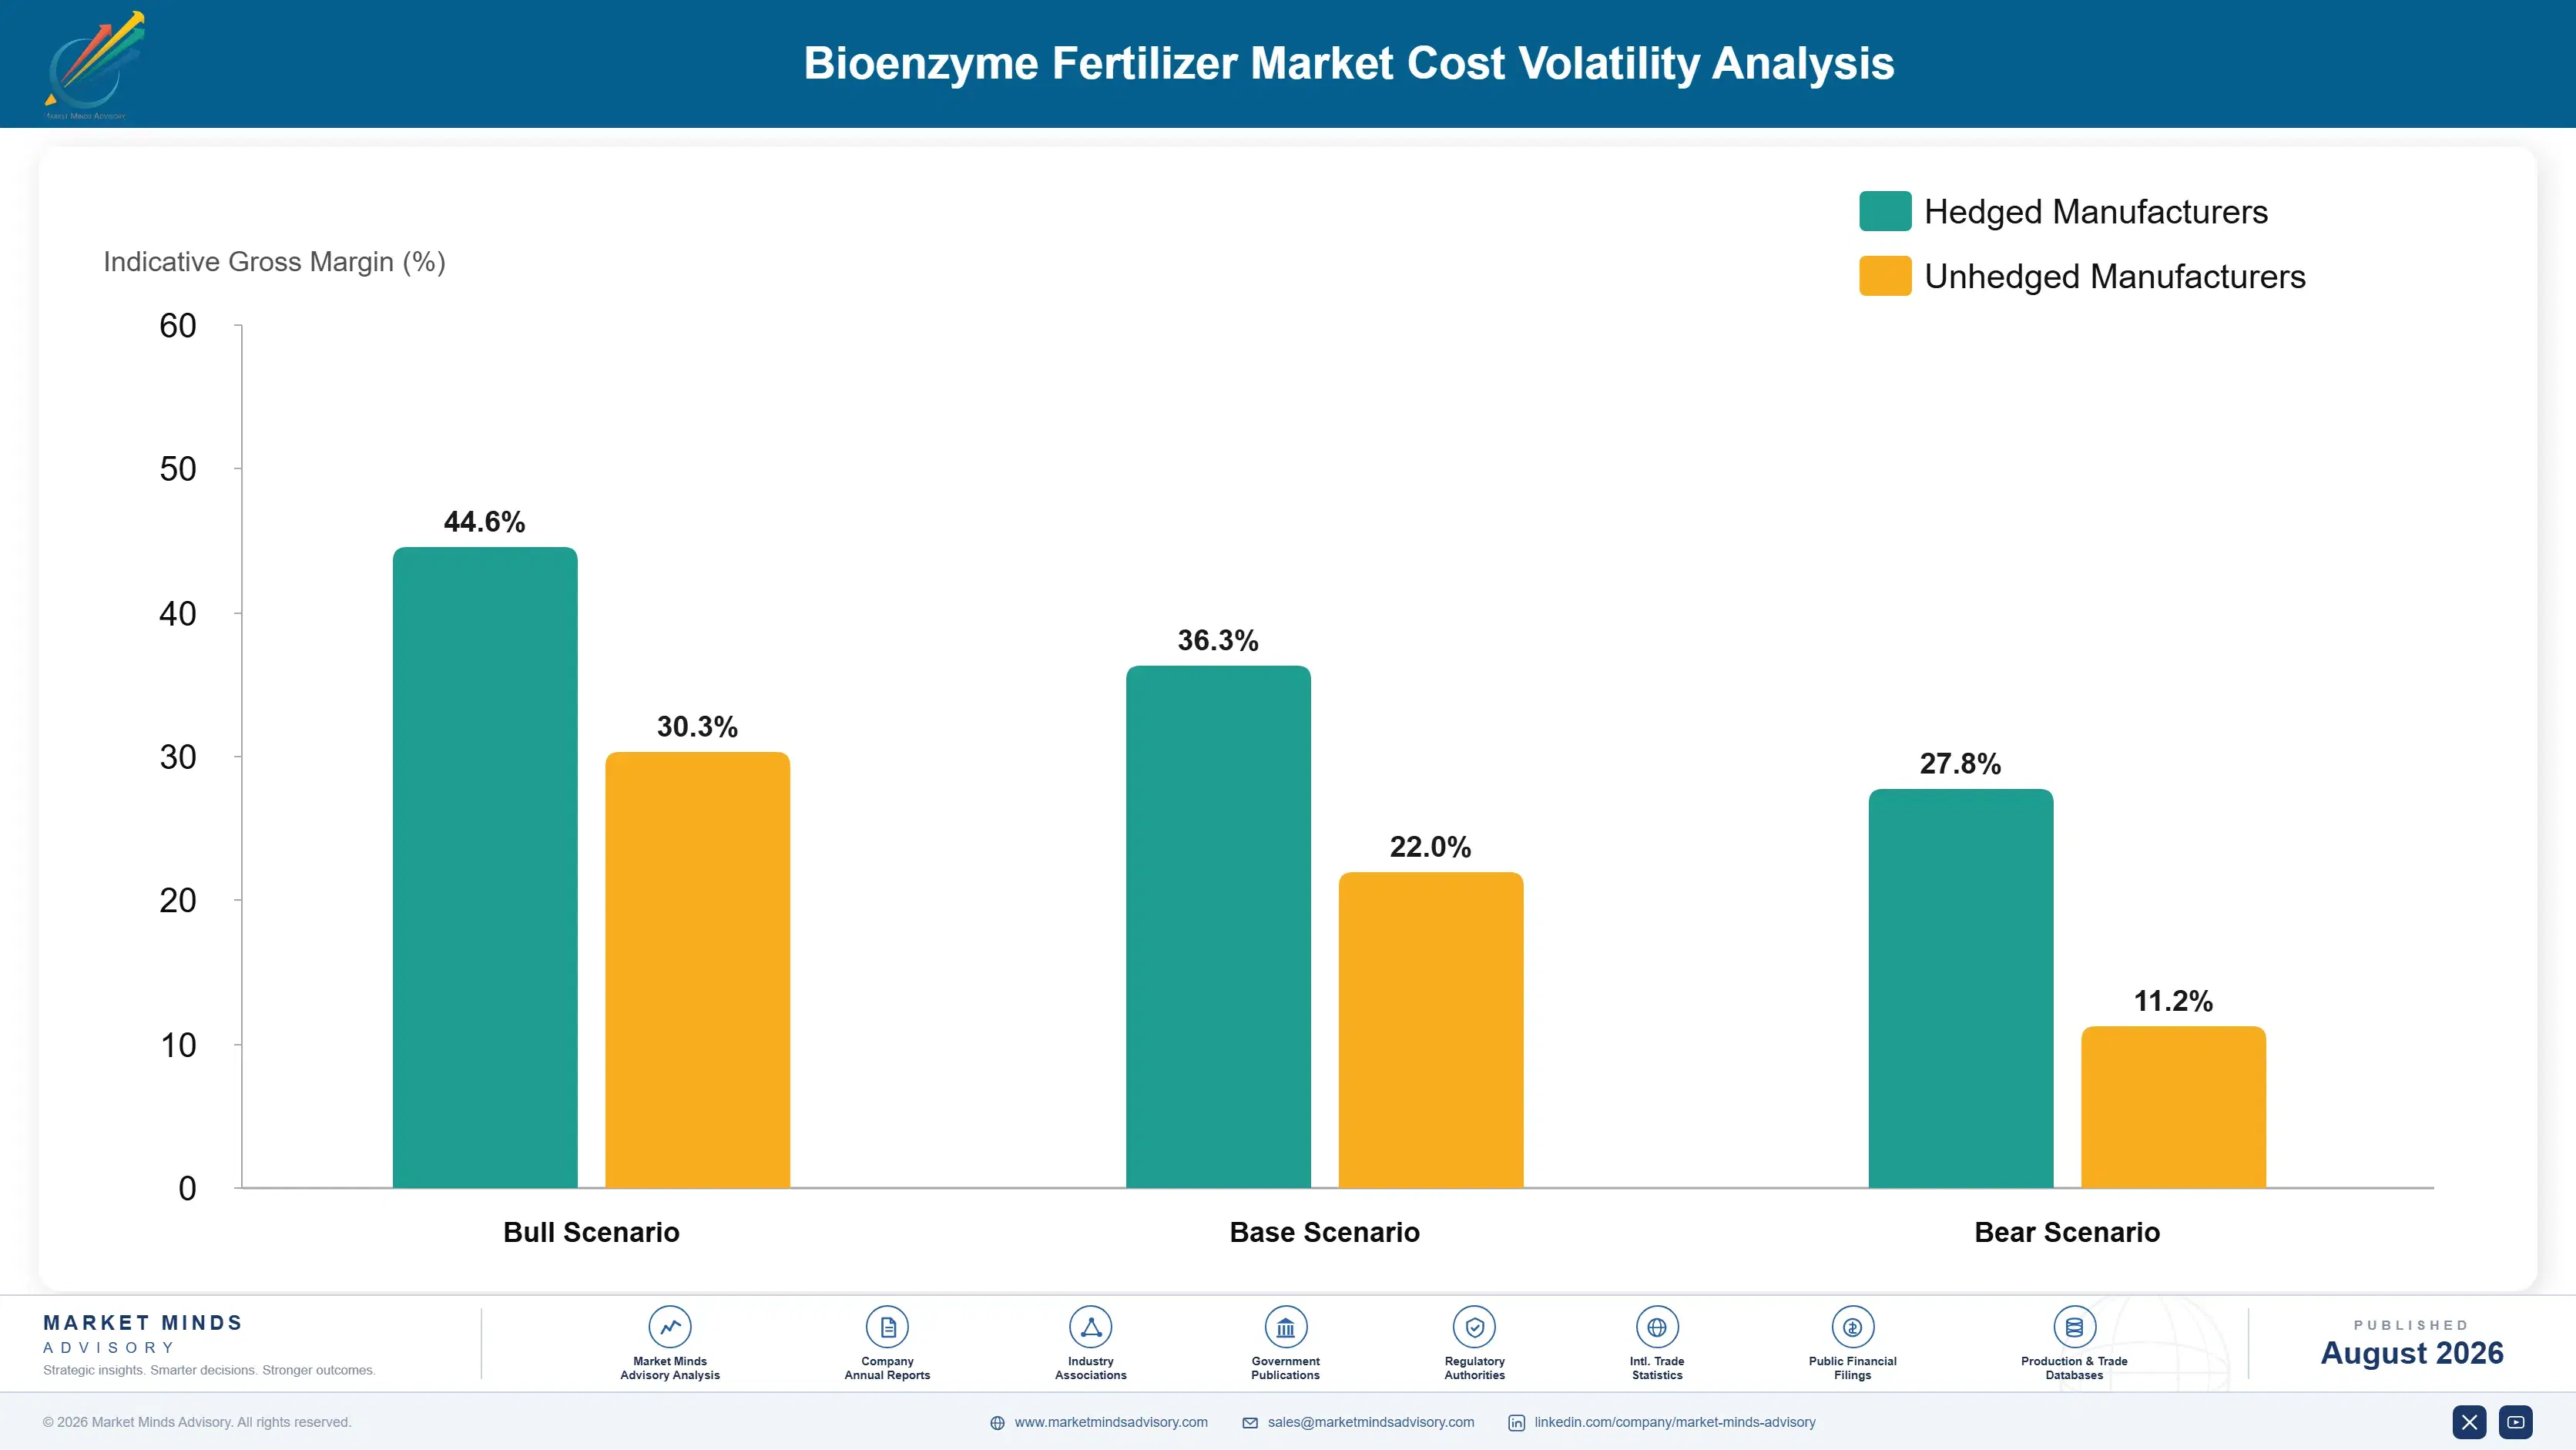
Production cost here divides between growing the organism and keeping it alive afterwards. Fermentation feedstock including sugars, molasses, and nitrogen sources runs 22% to 30% of product cost. Fermentation and downstream processing energy adds 16% to 24%, carrier materials including peat, talc, and encapsulation systems 14% to 22%, and packaging with barrier and light protection a further 9% to 15% because the contents are alive.
Feedstock and energy both rose sharply through 2022 as agricultural commodity and gas prices moved together, and biological input producers had no ability to raise prices against mineral fertiliser that was itself becoming expensive but familiar. Novonesis and UPL both disclosed input cost pressure across those reporting periods, and IEA analysis recorded European industrial gas at several times prior-year levels on a genuinely energy-intensive fermentation process.

Exposure separates by formulation route rather than by fermentation scale. A producer selling liquid live cultures carries cold chain cost, short shelf life, and write-off risk that a dried or spore-based formulation avoids entirely. Geography compounds it, since distribution into hot climates destroys liquid product economics while dried formats travel almost indifferently, which is why formulation choice determines addressable geography more than any commercial decision does.
bioenzyme-fertilizer-market-cost-volatility-analysis-1787332025588

Reformulate toward dried and spore-based carriers

Liquid live cultures carry cold chain cost, short shelf life, and write-off risk that dried and spore-forming formats largely avoid. The reformulation requires efficacy revalidation and frequently accepts slightly lower peak activity in exchange for stability. That trade is almost always correct, because a product surviving the warehouse outperforms a better one that does not.

Qualify multiple fermentation feedstocks per strain

Sugars, molasses, and agricultural by-products all support fermentation but each shifts yield and impurity profile enough to need qualification. Running one feedstock leaves a producer exposed to a single agricultural market moving for unrelated reasons. Qualifying alternatives costs development time once and provides cost flexibility across seasons, which matters when the competing product is mineral fertiliser priced on different drivers.

Cut packaging cost by extending formulation stability

Barrier and light-protective packaging is 9% to 15% of product cost precisely because the contents are living and vulnerable. A formulation stable without heroic packaging removes that cost permanently rather than negotiating it down. The development work is substantial and the saving accrues on every unit sold thereafter, which makes it one of the few genuinely compounding improvements available here.

Portfolio Architecture for Margin Defence

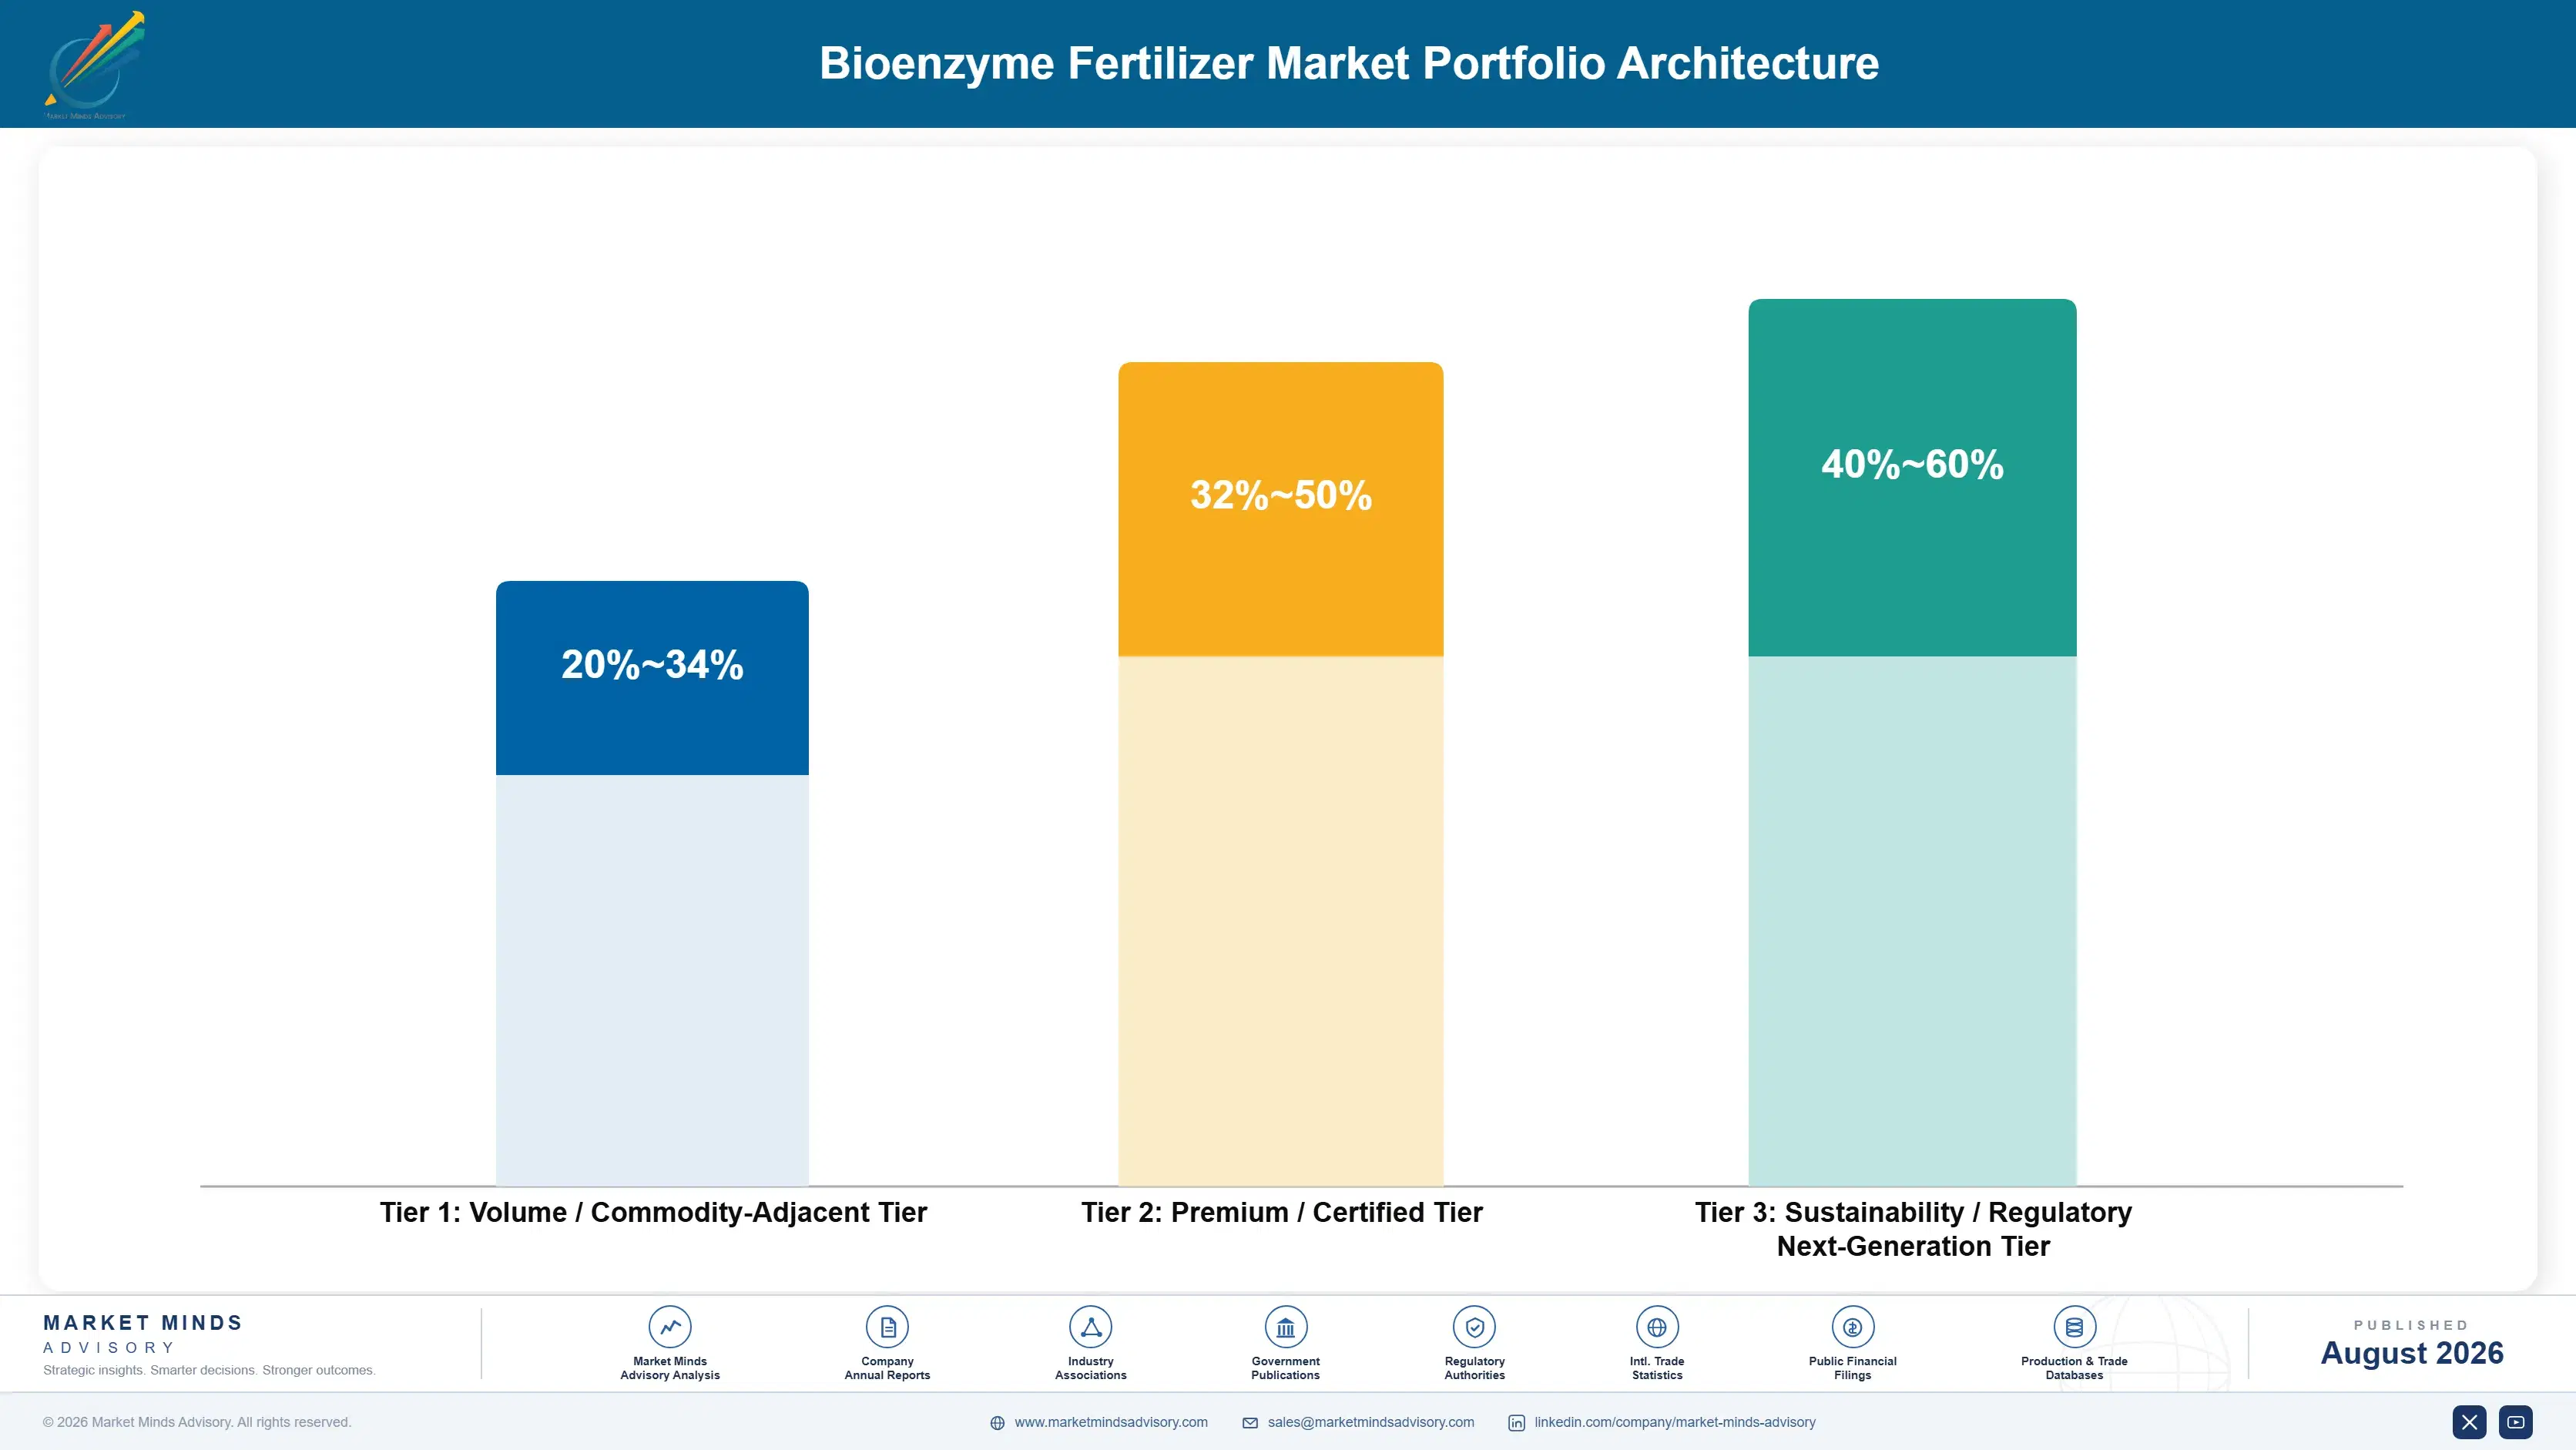
The portfolio splits into three tiers with different economics. Commodity microbial products with vague soil health claims form the volume tier, where regional formulators of variable quality compete on price and growers cannot distinguish anything. Established inoculants with predictable agronomy earn more because trust has been built over decades. Verifiable solubilising products and stabilised formulations price against a measurable benefit rather than against a competing bottle.
The tension runs between volume products that fill fermenters and verifiable products that earn repeat purchase. Commodity microbial volume keeps fermentation capacity loaded, covers fixed cost, and maintains the distributor relationships through which better products sell. Yet it competes against formulators whose quality control is minimal and whose claims are unpoliced. Producers handling this well accept thin commodity margin while directing development toward stability and verifiable modes of action.

High-value pools concentrate where measurement or trust limits competition: solubilising products whose benefit appears on a fertiliser invoice, legume inoculants with decades of predictable response, stabilised formulations surviving hot-climate distribution, and products carrying named third-party trial evidence. All four escape the credibility problem afflicting the category. Undifferentiated soil health products sit at the other end, where a grower cannot verify anything and repeat purchase collapses.

Volume / Commodity-Adjacent Tier

Commodity microbial consortia and organic matter decomposition products sold on price with unverifiable soil health claims. The range is wide because quality control and fermentation efficiency separate producers enormously at similar selling prices.
Gross Margin: 20-34%

Premium / Certified Tier

Established legume inoculants, mycorrhizal products, and enzyme formulations with documented agronomy and registration. The range is wide because trust built over decades supports pricing that newer entrants cannot approach on identical chemistry.
Gross Margin: 32-50%

Sustainability / Regulatory / Next-Generation Tier

Nutrient solubilising inoculants with measurable fertiliser reduction, stabilised hot-climate formulations, and precision-fermentation nitrogen products. The range is wide because verifiability supports pricing while newer routes still carry unrecovered development cost.
Gross Margin: 40-60%
bioenzyme-fertilizer-market-portfolio-architecture-1787332026083

High-value Sub-segments and Strategic Watch-out

Nutrient Solubilising Microbial Inoculants

High value and high growth at 16.8%, the fastest mode, because reduced phosphate purchase shows on an invoice rather than in a soil health narrative. Shelf stability through hot-climate distribution remains the practical constraint on realising that advantage anywhere. Nothing else genuinely limits the growth here.
Gross Margin: 40-60%

Nitrogen Fixing Inoculants

High value with strong growth at 13.4%, carrying decades of predictable legume agronomy that growers genuinely trust. Cereal nitrogen fixation is where the growth and the disappointment both sit, since results remain inconsistent despite very substantial investment. Cereal nitrogen fixation still remains the unsolved commercial prize.
Gross Margin: 32-50%

Enzyme and Metabolite Formulations

The volume core, growing at 11.2% and benefiting from needing no living organism, which removes the shelf stability problem entirely. Efficacy is correspondingly harder to demonstrate, since there is no viable count to guarantee on the label at all. Convenience carries this segment more than evidence.
Gross Margin: 30-46%

Organic Matter Decomposition Consortia

The strategic watch-out, growing at 9.4% on residue management and soil organic matter concerns that growers care about but cannot measure. This is where unpoliced claims and poor regional products do most of the damage to category credibility. Unpoliced claims do most of their damage here.
Gross Margin: 20-34%

How Grower Programmes Actually Hold

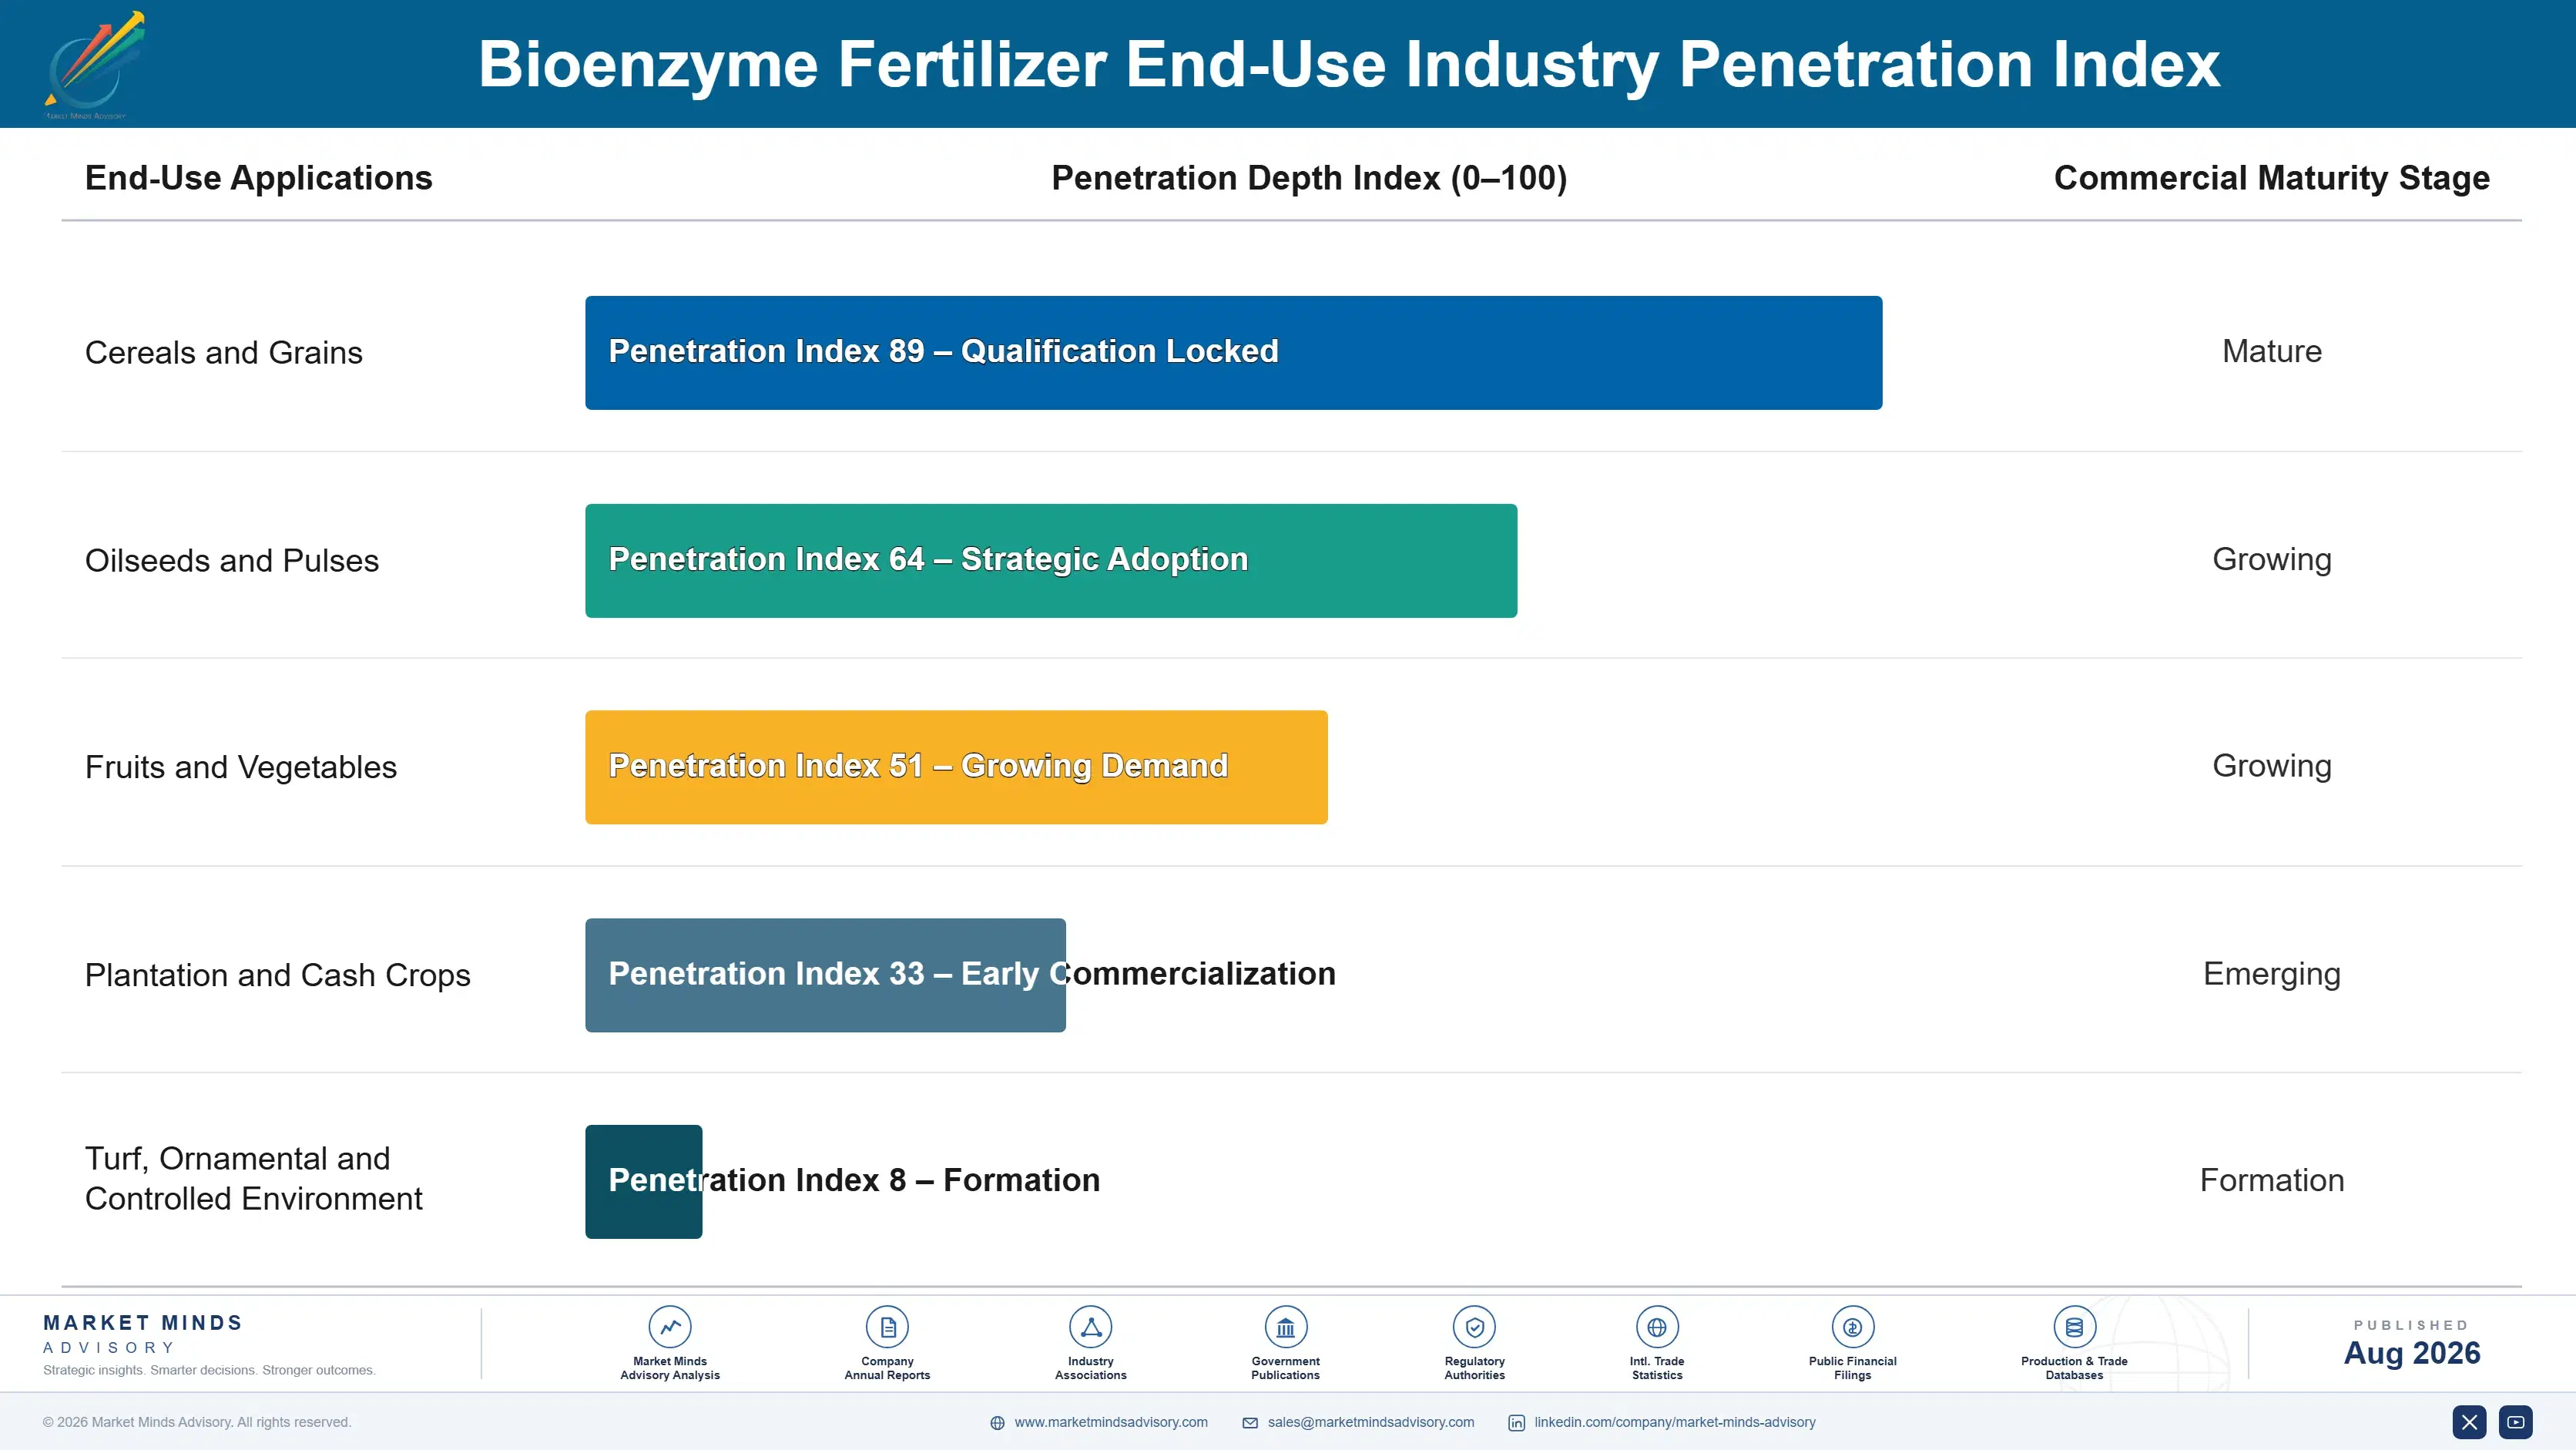
Demand commits at the second purchase, not the first. A grower trials on a small area, measures what they can, and either brings it into the programme or never mentions it, which is why repeat purchase near 41% matters. A product inside a programme recurs annually with the crop plan and is difficult to displace. The competitive moments are the trial season, a fertiliser price spike, and any regulation changing what is applied.
Stickiness varies by verifiability and agronomic history. Legume inoculants stick hardest, since decades of predictable response made them standard practice rather than a decision. Solubilising products stick where the saving is measurable on an invoice. Enzyme formulations stick through convenience and shelf stability. Undifferentiated soil health products barely stick, because a grower who cannot measure a benefit has no reason to buy twice.

Buyer profiles have moved from individual growers trying products toward agronomists, cooperative technical staff, and sustainability programmes attached to grain buyers. Food companies now specify practices upstream in ways reaching the input decision directly. That change rewards suppliers with named third-party evidence and measurable claims, and penalises those still selling soil health narratives to a grower who checks the yield monitor and decides accordingly.
bioenzyme-fertilizer-market-end-use-penetration-index-1787332026575

Our Call On Bioenzyme Fertilizer

These are among the four positions where our research anticipates prominent divergence between winners and laggards over the coming forecast period. Each is grounded in the demand model, the regulatory perimeter, and the announced capacity pipeline.
01 / SHELF STABILITY PRIORITY

Formulation is the product, not the strain

A product meeting viable count at dispatch and failing it at application is worthless whatever the biology promised, and shelf life of six to 18 months rarely survives distribution through unrefrigerated warehouses at forty degrees. Repeat purchase near 41% is largely a stability verdict rather than an efficacy one, however uncomfortable that is to accept internally at all. Producers still funding strain discovery ahead of formulation work are optimising the one part of the problem that already functions perfectly well.
02 / VERIFIABLE BENEFIT POSITIONING

Growers stop buying what they cannot measure

A solubilising product that lets a grower purchase less phosphate is verifiable on a purchase invoice in a way that soil health improvement simply never is, which is exactly why that segment grows at 16.8% against a category at 11.7%. Most biological claims cannot be measured at farm level at all, and growers who cannot measure a benefit do not ever return for a second season. Choosing positioning by verifiability rather than by biological interest is unpopular internally and commercially decisive anyway.
03 / HONEST FIELD TARGETING

Selling to the wrong soil destroys the category

Yield response runs from minus 5% to plus 25% across otherwise comparable sites, so selling to a grower whose soil will land in the negative half costs that relationship and damages the whole category reputation at the very same time. Soil testing to predict response costs real money and reduces addressable acreage, which every commercial team on earth resists instinctively. It also lifts repeat purchase, which is the only number in this entire business that genuinely compounds year after year.
04 / RECOMMENDATION CHANNEL ACCESS

Agronomists and cooperatives decide what gets applied

Growers take their input decisions on advice from retail agronomists, cooperative technical staff, and neighbours rather than from any product literature, and a category carrying a genuine credibility problem depends on that recommendation far more than most others do. Named third-party trial evidence from recognised institutions carries weight that company data simply does not. In subsidy-reform markets the cooperative and government channel reaches acreage measured in the hundreds of millions of hectares that no commercial network anywhere touches at all.

Engagement Snapshot From the Field

A live engagement with an industry participant carrying material or product regulatory and market exposure ahead of a defining policy shift, showing how our research translates into a defensible multi-year portfolio strategy.
MARKET MINDS ADVISORY · CLIENT ENGAGEMENT SUMMARY
Bioenzyme Fertilizer Producer Strategic Portfolio Review and Transition Roadmap 2026·Investment Scenario on Bioenzyme Fertilizer Exposure Evaluation 2025-26
CLIENT PROFILE
An agricultural input distributor covering four countries engaged MMA after biological product returns and grower complaints rose for a third consecutive season. The client reported carrying 84 biological products from 31 suppliers, write-offs of about USD 4 million annually on expired stock, and repeat purchase across the range of roughly 29% (client-reported, unverified by MMA).
STRATEGIC CHALLENGE
Culling the range risked losing supplier relationships and shelf presence against competing distributors, while continuing to carry products that failed in growers' hands was damaging agronomist credibility. Nobody had established whether the failures were product quality, storage conditions, or simply wrong field selection. The board needed to know before the next season's purchasing commitments were made.
MMA APPROACH
MMA tested viable counts on stock held in the client's own warehouses rather than accepting supplier dispatch certificates, which nobody had done. We separated failures caused by dead product from those caused by unsuitable soil conditions, since the two point to different remedies. We then compared repeat purchase by product against warehouse storage conditions and against agronomist recommendation, rather than treating the range as one.
KEY FINDINGS
  1. About 37% of tested stock failed label viable count while still inside its stated shelf life, concentrated in liquid formulations stored above thirty degrees (client-reported, unverified by MMA).
  2. Repeat purchase varied from 8% to 63% across the range, and formulation type predicted it considerably better than either supplier reputation or price did.
  3. Nine products had no third-party trial evidence in the client's territories at all, and agronomists had quietly stopped recommending every one of them.
  4. Warehouse temperature rather than transit was where most viability loss occurred, which was fixable at a fraction of the annual write-off cost.
CLIENT PROFILE
An agricultural input distributor covering four countries engaged MMA after biological product returns and grower complaints rose for a third consecutive season. The client reported carrying 84 biological products from 31 suppliers, write-offs of about USD 4 million annually on expired stock, and repeat purchase across the range of roughly 29% (client-reported, unverified by MMA).
STRATEGIC CHALLENGE
Culling the range risked losing supplier relationships and shelf presence against competing distributors, while continuing to carry products that failed in growers' hands was damaging agronomist credibility. Nobody had established whether the failures were product quality, storage conditions, or simply wrong field selection. The board needed to know before the next season's purchasing commitments were made.
MMA APPROACH
MMA tested viable counts on stock held in the client's own warehouses rather than accepting supplier dispatch certificates, which nobody had done. We separated failures caused by dead product from those caused by unsuitable soil conditions, since the two point to different remedies. We then compared repeat purchase by product against warehouse storage conditions and against agronomist recommendation, rather than treating the range as one.
KEY FINDINGS
  1. About 37% of tested stock failed label viable count while still inside its stated shelf life, concentrated in liquid formulations stored above thirty degrees (client-reported, unverified by MMA).
  2. Repeat purchase varied from 8% to 63% across the range, and formulation type predicted it considerably better than either supplier reputation or price did.
  3. Nine products had no third-party trial evidence in the client's territories at all, and agronomists had quietly stopped recommending every one of them.
  4. Warehouse temperature rather than transit was where most viability loss occurred, which was fixable at a fraction of the annual write-off cost.
RECOMMENDED STRATEGY
Phase 1: Phase 1 (0 to 5 months): Fix warehouse temperature control at the three sites where viability loss concentrated before culling any products. Phase 2: Phase 2 (5 to 15 months): Cut the range to products with third-party evidence and dried or spore-based formulation, dropping the rest. Phase 3: Phase 3 (15 to 26 months): Introduce soil-based field selection guidance so agronomists recommend products only where response is likely.
OUTCOME
The client cut expired stock write-offs by roughly 71% through temperature control alone, before removing 38 products from the range. Repeat purchase across the retained portfolio rose to about 52% within two seasons, and agronomist willingness to recommend biologicals recovered once the failures stopped (client-reported, unverified by MMA).

Frequently Asked Questions

Foundational context covering the market sizes, CAGR, scope, country, region and competition that inform every finding below. This section is provided to cover basics and most often pre-purchase conversations, answered from the MMA Primary Research Dataset.

What is the current size of the Bioenzyme Fertilizer Market?

The global bioenzyme fertilizer market is valued at USD 2.8 billion in 2025, covering solubilising and nitrogen fixing inoculants, enzyme formulations, mycorrhizal products, and decomposition consortia. Mineral fertilisers and biological crop protection are excluded.

How large will the Bioenzyme Fertilizer Market be by 2036?

The market is forecast to reach USD 9.51 billion by 2036 in the base case, about 3.04 times the 2026 level. That represents incremental value of roughly USD 6.38 billion across the decade.

What is the CAGR for the Bioenzyme Fertilizer Market 2026 to 2036?

The market grows at an 11.7% CAGR in the base case, with bull and bear scenarios at 13.0% and 10.3%. The spread turns mainly on field consistency and whether efficacy standards emerge.

Which segment is growing fastest?

Nutrient solubilising microbial inoculants grow fastest at 16.8%, about 1.44 times the overall rate, because reduced fertiliser purchase is measurable. Nitrogen fixing inoculants follow at 13.4%.

Who are the major companies in the Bioenzyme Fertilizer Market?

Leading suppliers include Novonesis, Syngenta Biologicals, UPL, Corteva Agriscience, and Rizobacter. Fragmentation is extreme, with the top five holding roughly 22% of bioenzyme fertilizer revenue.

Which country is growing fastest?

India grows fastest at a 17.4% CAGR, as subsidy support shifts from urea toward biological and balanced nutrition. China and Brazil follow on policy direction and soybean acreage.

Report Segmentation Architecture

The full report scope spans multiple orthogonal segmentation dimensions, with cross-tabulated demand data provided for each dimension pair. Coverage extends further to regional breakdowns, trend trajectories, and the competitive detail needed to support segment-level decision-making.

By Biological Mode Of Action

  • Nutrient Solubilising Microbial Inoculants
  • Nitrogen Fixing Inoculants
  • Enzyme and Metabolite Formulations
  • Mycorrhizal and Root Symbiont Products
  • Organic Matter Decomposition Consortia

By End-Use Industry

  • Cereals and Grains
  • Oilseeds and Pulses
  • Fruits and Vegetables
  • Plantation and Cash Crops
  • Turf, Ornamental and Controlled Environment

By Distribution Channel

  • Agricultural Input Retail and Dealer
  • Cooperative and Government Programme Supply
  • Direct Contract To Large Grower
  • Online and Direct To Farm Sale

By Region

  • North America
  • Western Europe
  • East Asia
  • South Asia and Pacific
  • Latin America
  • Middle East and Africa
  • Eastern Europe

Scope, Methodology, and Coverage

Every figure in this report is reproducible from documented input assumptions. The scope below maps the historical period, the forecast horizon, the segmentation dimensions, and the countries covered, alongside the underlying primary and qualitative methodology.
Historical Period
2020 to 2025
Forecast Period
2026 to 2036
Base Year
2025 (USD billions; MMA Primary Research Dataset, August 2026)
Market Definition
The bioenzyme fertilizer market comprises the manufacture and sale of crop nutrition inputs whose active function is enzymatic or microbial, valued at producer selling prices to distributors, cooperatives, government programmes, and growers. It spans nutrient solubilising microbial inoculants, nitrogen fixing inoculants for legumes and cereals, enzyme and microbial metabolite formulations, mycorrhizal and root symbiont products, and organic matter decomposition consortia, together with the carrier systems, stabilisation technology, and application guidance supplied with them. Conventional mineral, synthetic, and controlled-release fertilisers, compost, manure, digestate and bulk organic amendments sold on nutrient content, biological crop protection products targeting pests, weeds, or disease, plant growth regulators of synthetic origin, seed treatments sold as crop protection, soil conditioners and wetting agents sold on physical properties, and agronomy advisory and soil testing services are excluded.
Quantitative Units
USD billions (current prices); volume in thousand tonnes and treated area in million hectares
Segmentation Dimensions
By Biological Mode Of Action; By End-Use Industry; By Distribution Channel; By Region
Regions Covered
North America, Western Europe, East Asia, South Asia and Pacific, Latin America, Middle East and Africa, Eastern Europe
Countries Covered
India, China, USA, Brazil, Argentina, Canada, Mexico, Germany, France, Spain, Italy, Netherlands, Poland, Romania, Ukraine, UK, Japan, South Korea, Australia, Indonesia, Vietnam, Thailand, Turkey, Egypt, Morocco, Kenya, Nigeria, South Africa, UAE, Saudi Arabia, and additional markets relevant to this sector
Key Companies Profiled
Novonesis, Syngenta Biologicals, UPL, Corteva Agriscience, Rizobacter, BASF Agricultural Solutions, Bayer Crop Science, Lallemand Plant Care, Valagro, Koppert Biological Systems, Symborg, Agrinos, Kula Bio, Pivot Bio, Sumitomo Chemical, T Stanes and Company, International Panaacea, Biobest Group, Andermatt Group, Certis Belchim
Quantitative Methodology
Primary survey, n=3,800 respondents, Q4 2025, six countries; demand-side model with trade association cross-validation
Qualitative Methodology
47 expert interviews, Q4 2025; applied to validate demand model assumptions, identify emerging dynamics, and assess competitive positioning
Report Format
PDF and XLSX data workbook (Word format preview document)
Publisher
Market Minds Advisory
Report Code
MMA-2026-AGR-351
Published
August 2026
Contact
sales@marketmindsadvisory.com | www.marketmindsadvisory.com

Purchase the full Bioenzyme Fertilizer Market Report (2026 to 2036).

The full MMA Bioenzyme Fertilizer report sizes the market across five biological modes of action, five crop groups, four distribution channels, and seven regions through 2036. It profiles 20 suppliers on a consistent basis of enzymatic and microbial crop nutrition revenue, scoring each on shelf stability formulation, distribution and agronomist reach, verifiable benefit positioning, and third-party trial evidence. Scenario models quantify how subsidy reform, nutrient regulation, and formulation improvement move both volume and achievable margin by mode of action. The report also includes repeat purchase benchmarking by product type, viable count retention testing through distribution, field response variability analysis by soil condition, and efficacy regulation mapping across jurisdictions.
Five-mode and four-channel market sizing to 2036
Twenty-supplier benchmark on microbial and enzymatic crop nutrition revenue
Repeat purchase benchmarking by product type and formulation
Viable count retention testing through real distribution conditions
Field response variability analysis by soil type and condition
Efficacy regulation mapping across major agricultural jurisdictions

Built For The People Who Decide

From boardroom strategy to bench-side execution, this report is read cover-to-cover by leaders shaping the next decade of their industry, turning demand scenarios, market dynamics and valuation benchmarks into decisions.
CXOs/ Presidents/ VPs/ Managers
M&A and Corporate Development
Strategy Teams and R&D Heads
Procurement and Product Directors
Regulatory and Compliance Leaders
Investor Relations and Equity Analysts