
Market Minds Advisory
Better For You Snacks Market

Better For You Snacks Market: Reformulation, Claims and the Retail Health Reset

Better for you snacks now face retailer-mandated reformulation deadlines, protein and fiber claim inflation, and a shrinking runway for sugar-heavy legacy SKUs as clean-label audits tighten across grocery, club, and convenience channels worldwide.

Lead Analyst

Lisa Gevelber

Published

September 2026

Make Smarter Decisions with Customized Research Insights

Request a free sample report and evaluate market opportunities, growth trends, and competitive dynamics relevant to your business needs.

2025 MARKET VALUE$38.5BMarket Size 2025
2036 FORECAST VALUE$86.2BBase Case , 2026 to 2036
CAGR 2026 TO 20367.6 %Bull 8.9% / Bear 6.3%
INCREMENTAL OPPORTUNITY$44.8BNet 10- year value creation
EXPANSION MULTIPLE2.08x2036 value over 2026 base
Strategic Levers
M&A Pipeline
Regional Outlook
Country Rankings
Competitive Intelligence
Segmental Deep-dive
Call-Us : 91 93563 13602

Executive Snapshot and Market Trajectory

Grocery buyers are enforcing sugar and sodium ceilings at the shelf reset level, forcing snack makers to reformulate faster than marketing claims can keep pace, while protein and fiber fortification has become the fastest route to premium pricing across bars, chips, and puffed formats sold through mainstream retail chains nationwide.
Protein fortified bars and savory bites are pulling category growth ahead of salty snacks, as private label operators use co-manufacturing capacity to launch reformulated lines within single-digit months rather than years. North America commands the largest retail spend on better for you positioning, but India and Southeast Asia are scaling healthy snacking off a smaller base, pulling manufacturing investment toward flexible, multi-SKU production lines built for claim rotation.
Competitive intensity now centers on ingredient sourcing rather than flavor innovation, since certified protein isolates, allulose, and clean starches remain capacity constrained relative to demand. Front of pack warning label regimes moving through Latin America and nutrient profiling rules advancing across European retailers are compressing the window for sugar heavy positioning, pushing established players toward acquiring smaller functional snack brands rather than running slower in house reformulation programs across quarterly planning cycles.
Market Definition
The better for you snacks market covers packaged savory and sweet snack formats reformulated or engineered around reduced sugar, reduced sodium, added protein, added fiber, or clean label positioning, sold through retail, club, and foodservice channels. It excludes unmodified conventional snack SKUs carrying no functional or reformulation claim and excludes meal replacement shakes and standalone dietary supplement tablets.
Base Year Value
$38.5B in 2025 (MMA Primary Research Dataset, August 2026)
Forecast Period
2026 to 2036, eleven discrete annual values
CAGR
7.6% base case. Bull 8.9%. Bear 6.3%.
Fastest Growth Segment
Protein and Fiber Fortified Bars and Bites: 11.4% CAGR
Fastest Growth Country
India: 12.8% CAGR
Fastest Growth Region
South Asia and Pacific: 9.6% CAGR
Largest Region
North America: 32% of 2025 global value
Market Leaders
PepsiCo, Mondelez International, General Mills, Kellanova, and Hain Celestial. Source: MMA Analysis based on company annual reports.
Primary Survey
n=3,800 procurement and R&D decision-makers, Q4 2025, six countries
Methodology
Demand-side build-up, cross-validated against public data, 47 expert interviews

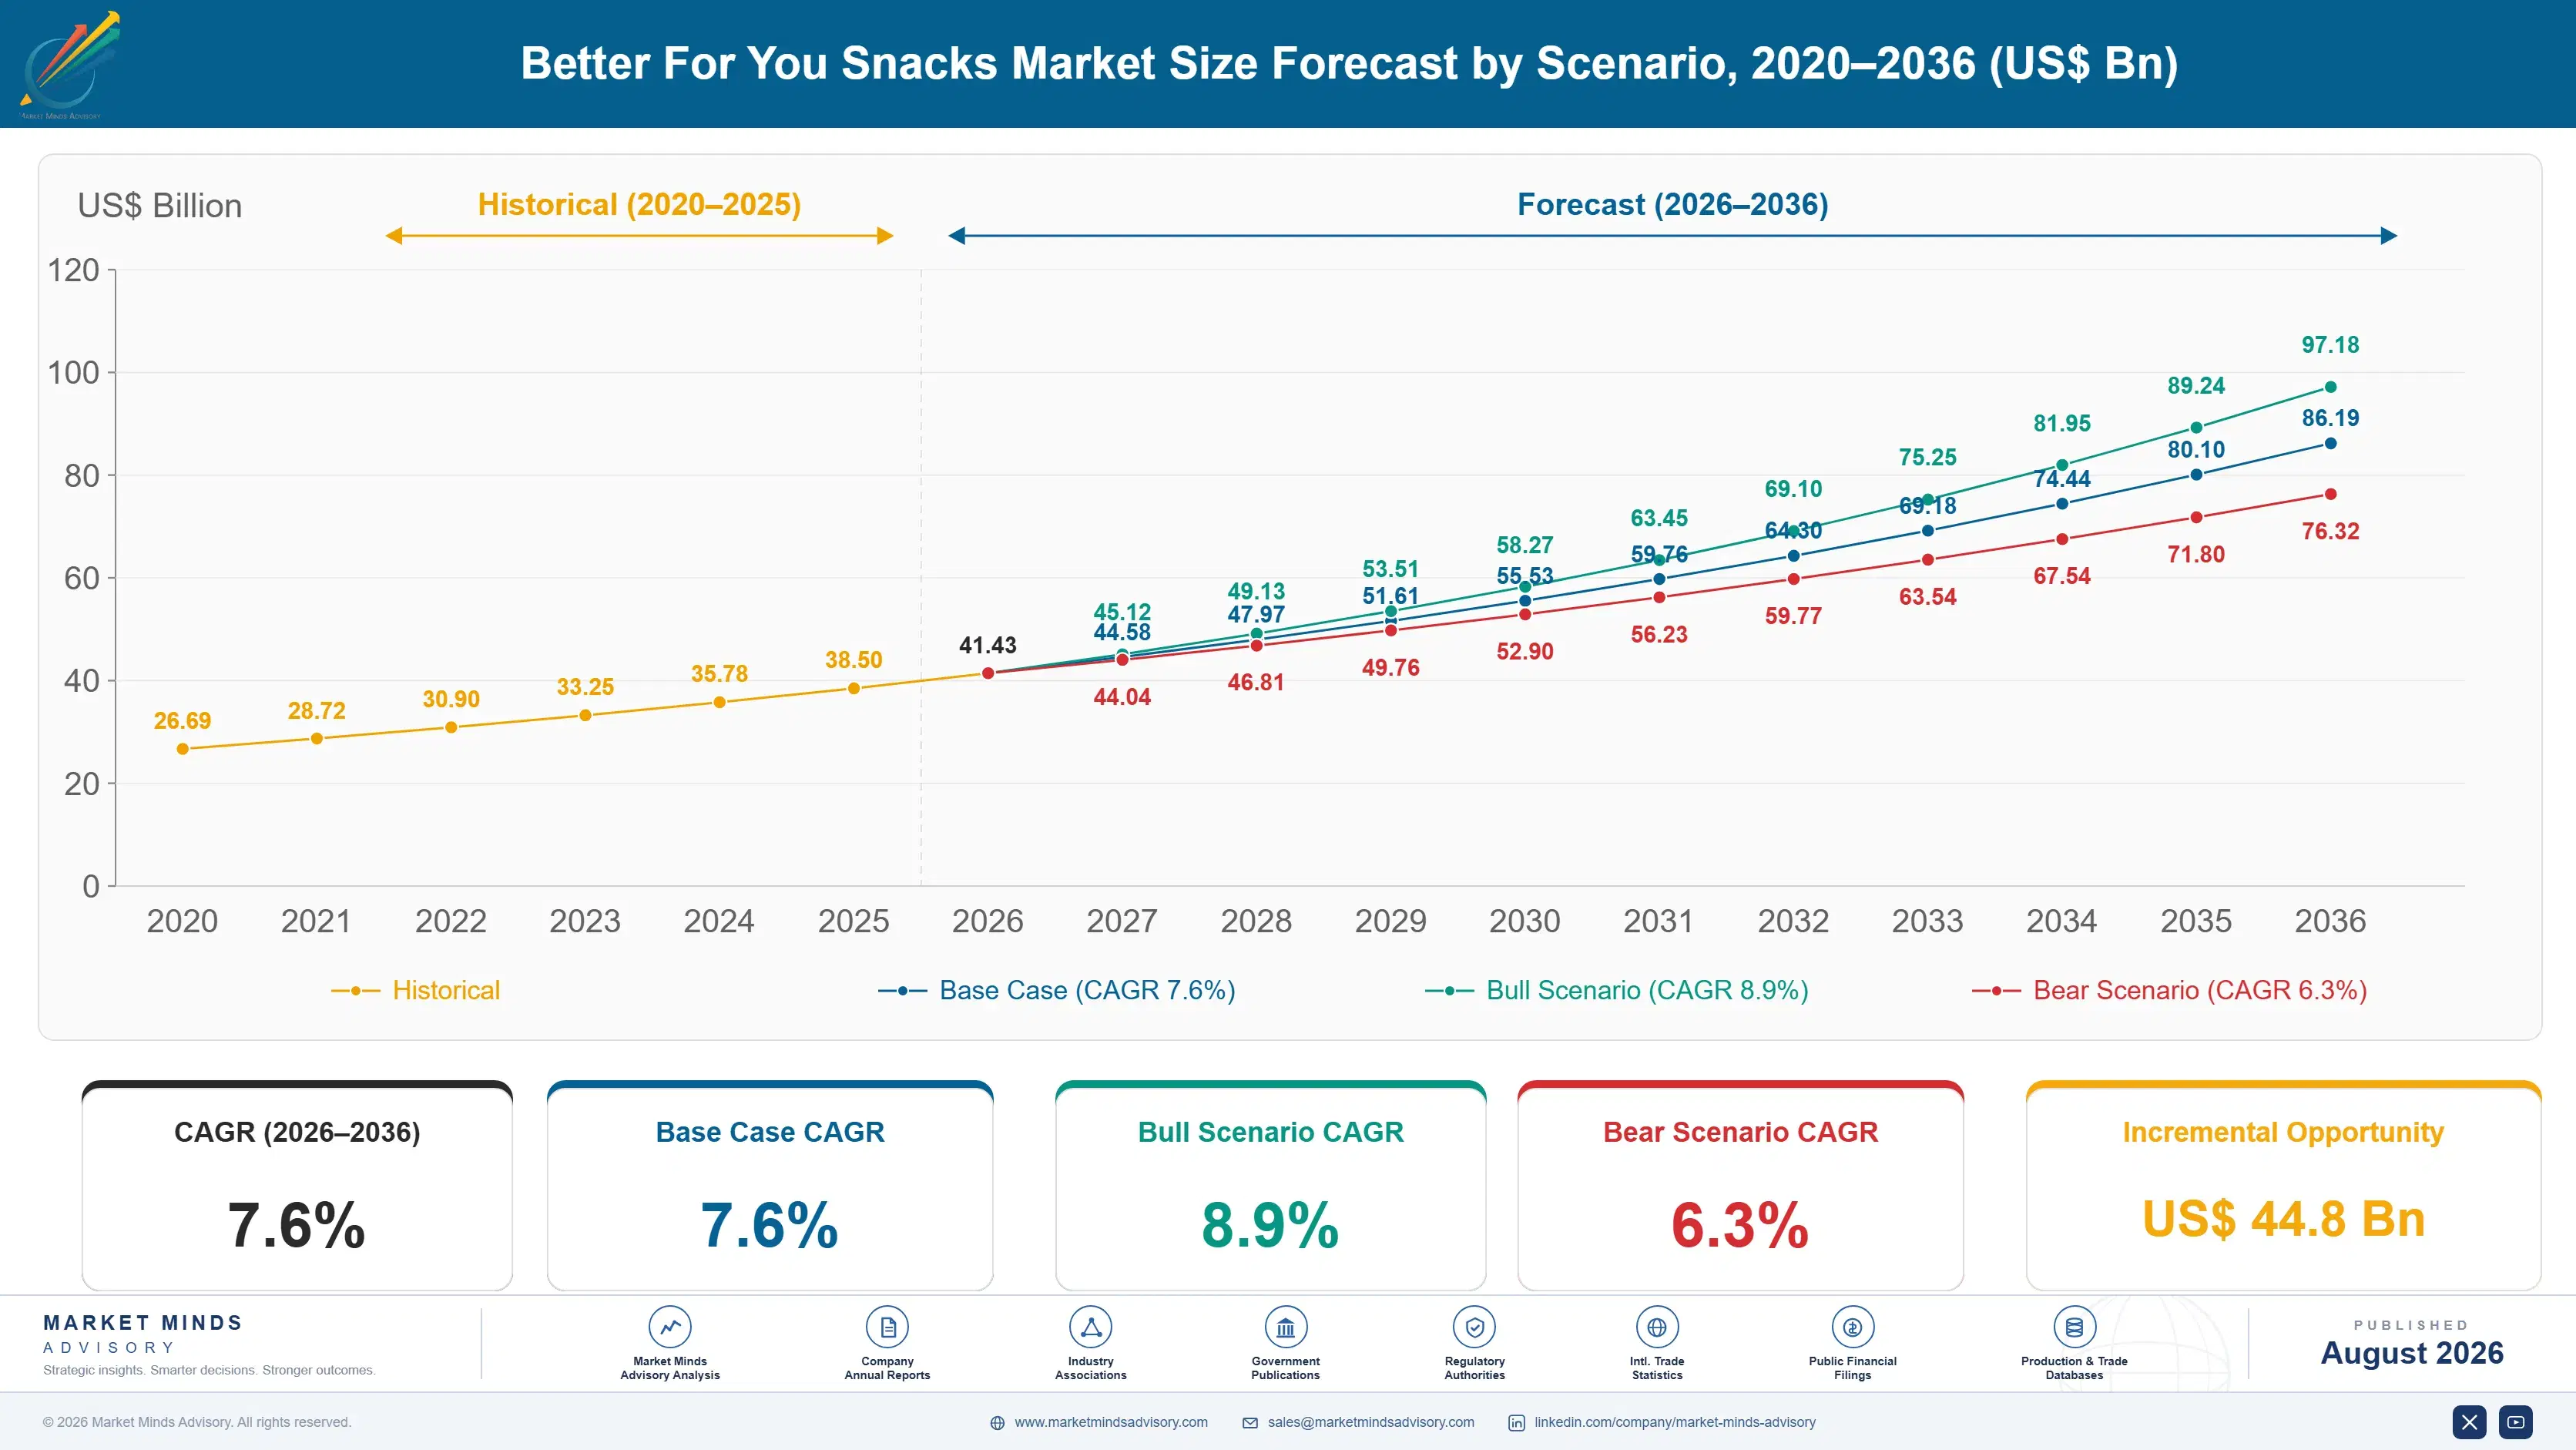
Better For You Snacks Market Forecast Scenarios

better-for-you-snacks-market-size-forecast-scenario-1787463073543
Between 2020 and 2025 the category moved from a niche premium shelf set to a mainstream reformulation mandate, as pandemic era health awareness pushed sugar and sodium reduction from optional marketing into a retailer buying criterion, lifting the segment at a historical pace of roughly 6.4 percent annually across most developed grocery channels, even as several emerging markets lagged this shift entirely.
The base case assumes continued category growth near 7.6 percent annually through 2036, anchored in three commercial mechanisms: retailer shelf reset criteria that increasingly exclude high sugar SKUs from planogram renewal, expanding co-manufacturing capacity for protein isolates and allulose that lowers reformulation cost per unit, and private label operators using better for you positioning to close the price gap with branded snacks while preserving margin, particularly within bar and puffed formats now nearing full-scale rollout.
A bull scenario builds on accelerated national front of pack labeling adoption that forces faster reformulation across the remaining conventional shelf set, while a bear scenario centers on persistent inflation in almond, cocoa, and specialty protein input costs eroding the price premium that better for you formats currently command over conventional snacks at retail, a compression visible across private label heavy chains.

Reformulation Economics and the Premiumization Ceiling

Three forces are converging on the category at once: retailer procurement teams now treat sugar and sodium thresholds as a listing requirement rather than a marketing differentiator, ingredient suppliers are racing to scale allulose and pulse protein capacity to meet reformulation demand, and private label operators are closing the credibility gap with national brands on clean label claims. This convergence is compressing timelines into a single planning year.
MARKET CONCENTRATIONCR5 34%top five players hold a moderate combined revenue share
AVERAGE RETAIL PREMIUM22-28%premium typically charged over comparable conventional snack equivalents
LEADING PRODUCING COUNTRYUnited Stateslargest single national manufacturing and consumption base overall
CO-MANUFACTURING UTILIZATION78%contract manufacturing lines currently running near full rated capacity
PRIVATE LABEL PENETRATION31%store brand share within reformulated snack subcategories overall
PROTEIN INPUT COST SHARE19% of COGSfortification ingredients as a portion of total production cost
Commercially the category behaves less like traditional packaged snacks and more like a rolling reformulation cycle, where a SKU's shelf life is increasingly tied to whether its nutrition panel still clears the latest retailer threshold rather than to consumer taste preference alone, forcing manufacturers to treat compliance engineering as a core capability, a shift rewarding operational discipline over creative marketing execution alone.
Over the next decade, the segments most likely to gain share are those where fortification can be achieved without taste penalty, since repeat purchase in snacking is taste driven even when the initial trial is claim driven, and brands that solve this tension credibly are pulling disproportionate shelf space. Manufacturers slow to resolve it risk ceding shelf space quickly.
"The winners in this category are not the brands with the boldest health claim on the front of pack. They are the ones whose reformulated version tastes close enough to the original that nobody notices the swap."
Director, Food and Nutrition Practice · MMA Food and Beverage / Functional Nutrition Practice · August 2026

Market Trends

Front of Pack Warning Labels Reshaping Shelf Sets

Chile style front of pack warning label regimes have now spread to more than a dozen Latin American and Gulf markets, requiring black octagon or triangle warnings on any snack exceeding defined sugar, sodium, or saturated fat thresholds. Retailers in these markets increasingly refuse planogram renewal for SKUs carrying multiple warnings, effectively forcing reformulation as a condition of continued distribution rather than as a voluntary marketing choice. Manufacturers serving these markets are now running dual formulation lines, one compliant and one legacy, adding real production complexity while the legacy line is phased down over successive planning cycles.
Market Impact: Delists 12% of high sugar SKUs
Allulose and Pulse Protein Capacity Expansion

Global allulose production capacity has roughly tripled since 2021 as approvals expanded beyond the United States into Canada, Mexico, and several Gulf states, easing what had been a severe bottleneck on sugar reduction reformulation. Pulse protein processing capacity, concentrated in Canada and the American Midwest, is expanding on a similar timeline, lowering blended input costs for protein fortified bars and puffed formats. This capacity build is shifting reformulation economics from a scarcity constrained, premium priced exercise toward a more standard input substitution that mid tier manufacturers can now afford at scale.
Market Impact: Adds 6% incremental institutional volume

Market Opportunities and Growth Drivers

Retailer Shelf Reset Criteria Excluding High Sugar SKUs

Large North American and European grocery chains have begun writing maximum sugar and sodium thresholds directly into supplier scorecards used at annual shelf reset negotiations, a practice that barely existed five years ago. SKUs failing the threshold face reduced facing counts or outright delisting at the next planogram cycle, regardless of prior sales velocity. This has converted reformulation from a brand marketing decision into a distribution survival requirement, pulling category wide investment into reformulation R&D and pushing manufacturers to prioritize compliant new product development over line extensions of legacy formulas.
Market Impact: Cuts repeat purchase rate 18%

Employer and Insurer Wellness Procurement Programs

A growing number of large self insured employers and health plans in the United States now subsidize or directly stock better for you snacks in workplace vending and cafeteria programs as part of wellness benefit packages, creating a stable institutional demand channel outside traditional retail. This channel rewards verified nutrition claims and third party certification over flavor innovation, giving certified protein and fiber fortified products a durable purchasing advantage. The channel remains small relative to retail but is growing faster than any other single distribution channel in the category. across most major metropolitan markets.
Market Impact: Raises protein input cost 14%

Market Restraints and Challenges

Taste Penalty Limits Repeat Purchase of Reformulated SKUs

Sugar and sodium reduction frequently alters mouthfeel and flavor release in ways trial purchasers notice on a second or third purchase even when the first purchase is claim driven, and the root cause is that many reformulation techniques substitute bulk and browning functions sugar performs beyond sweetness alone. The commercial impact shows up as elevated first purchase rates paired with weak repeat rates for early reformulated SKUs. Manufacturers are now investing in flavor masking technology and staged sugar reduction, cutting sugar over two or three reformulation cycles rather than in one step, to protect repeat purchase while meeting retailer thresholds.
Market Impact: Forces reformulation of 40% of SKUs

Certified Protein Ingredient Supply Remains Capacity Constrained

Demand for pea, faba, and other certified allergen friendly proteins has outpaced processing capacity additions in several years since 2021, with the underlying cause being long lead times for new protein fractionation plants relative to the speed at which reformulation demand scaled. The commercial impact is periodic input cost spikes that compress margins for mid tier manufacturers lacking long term supply contracts. Larger players are mitigating exposure through direct investment in processing joint ventures and multi year offtake agreements, while smaller brands increasingly rely on ingredient distributors carrying spot market price risk instead.
Market Impact: Cuts reformulation input cost 15%
3 additional market trends, 3 additional growth drivers, and 4 additional restraints and challenges are covered in the full report. Contact sales@marketmindsadvisory.com to access the complete intelligence.

Segment CAGR and Growth Architecture

Segmentation follows product format, since reformulation economics, shelf placement, and claim architecture differ materially between bars, chips, puffs, and other snack formats even when the underlying functional ingredients overlap substantially across categories, and since retailer negotiation criteria are increasingly format specific rather than a manufacturer's full portfolio, a distinction that shapes which segments retailers prioritize during annual shelf reset negotiations.
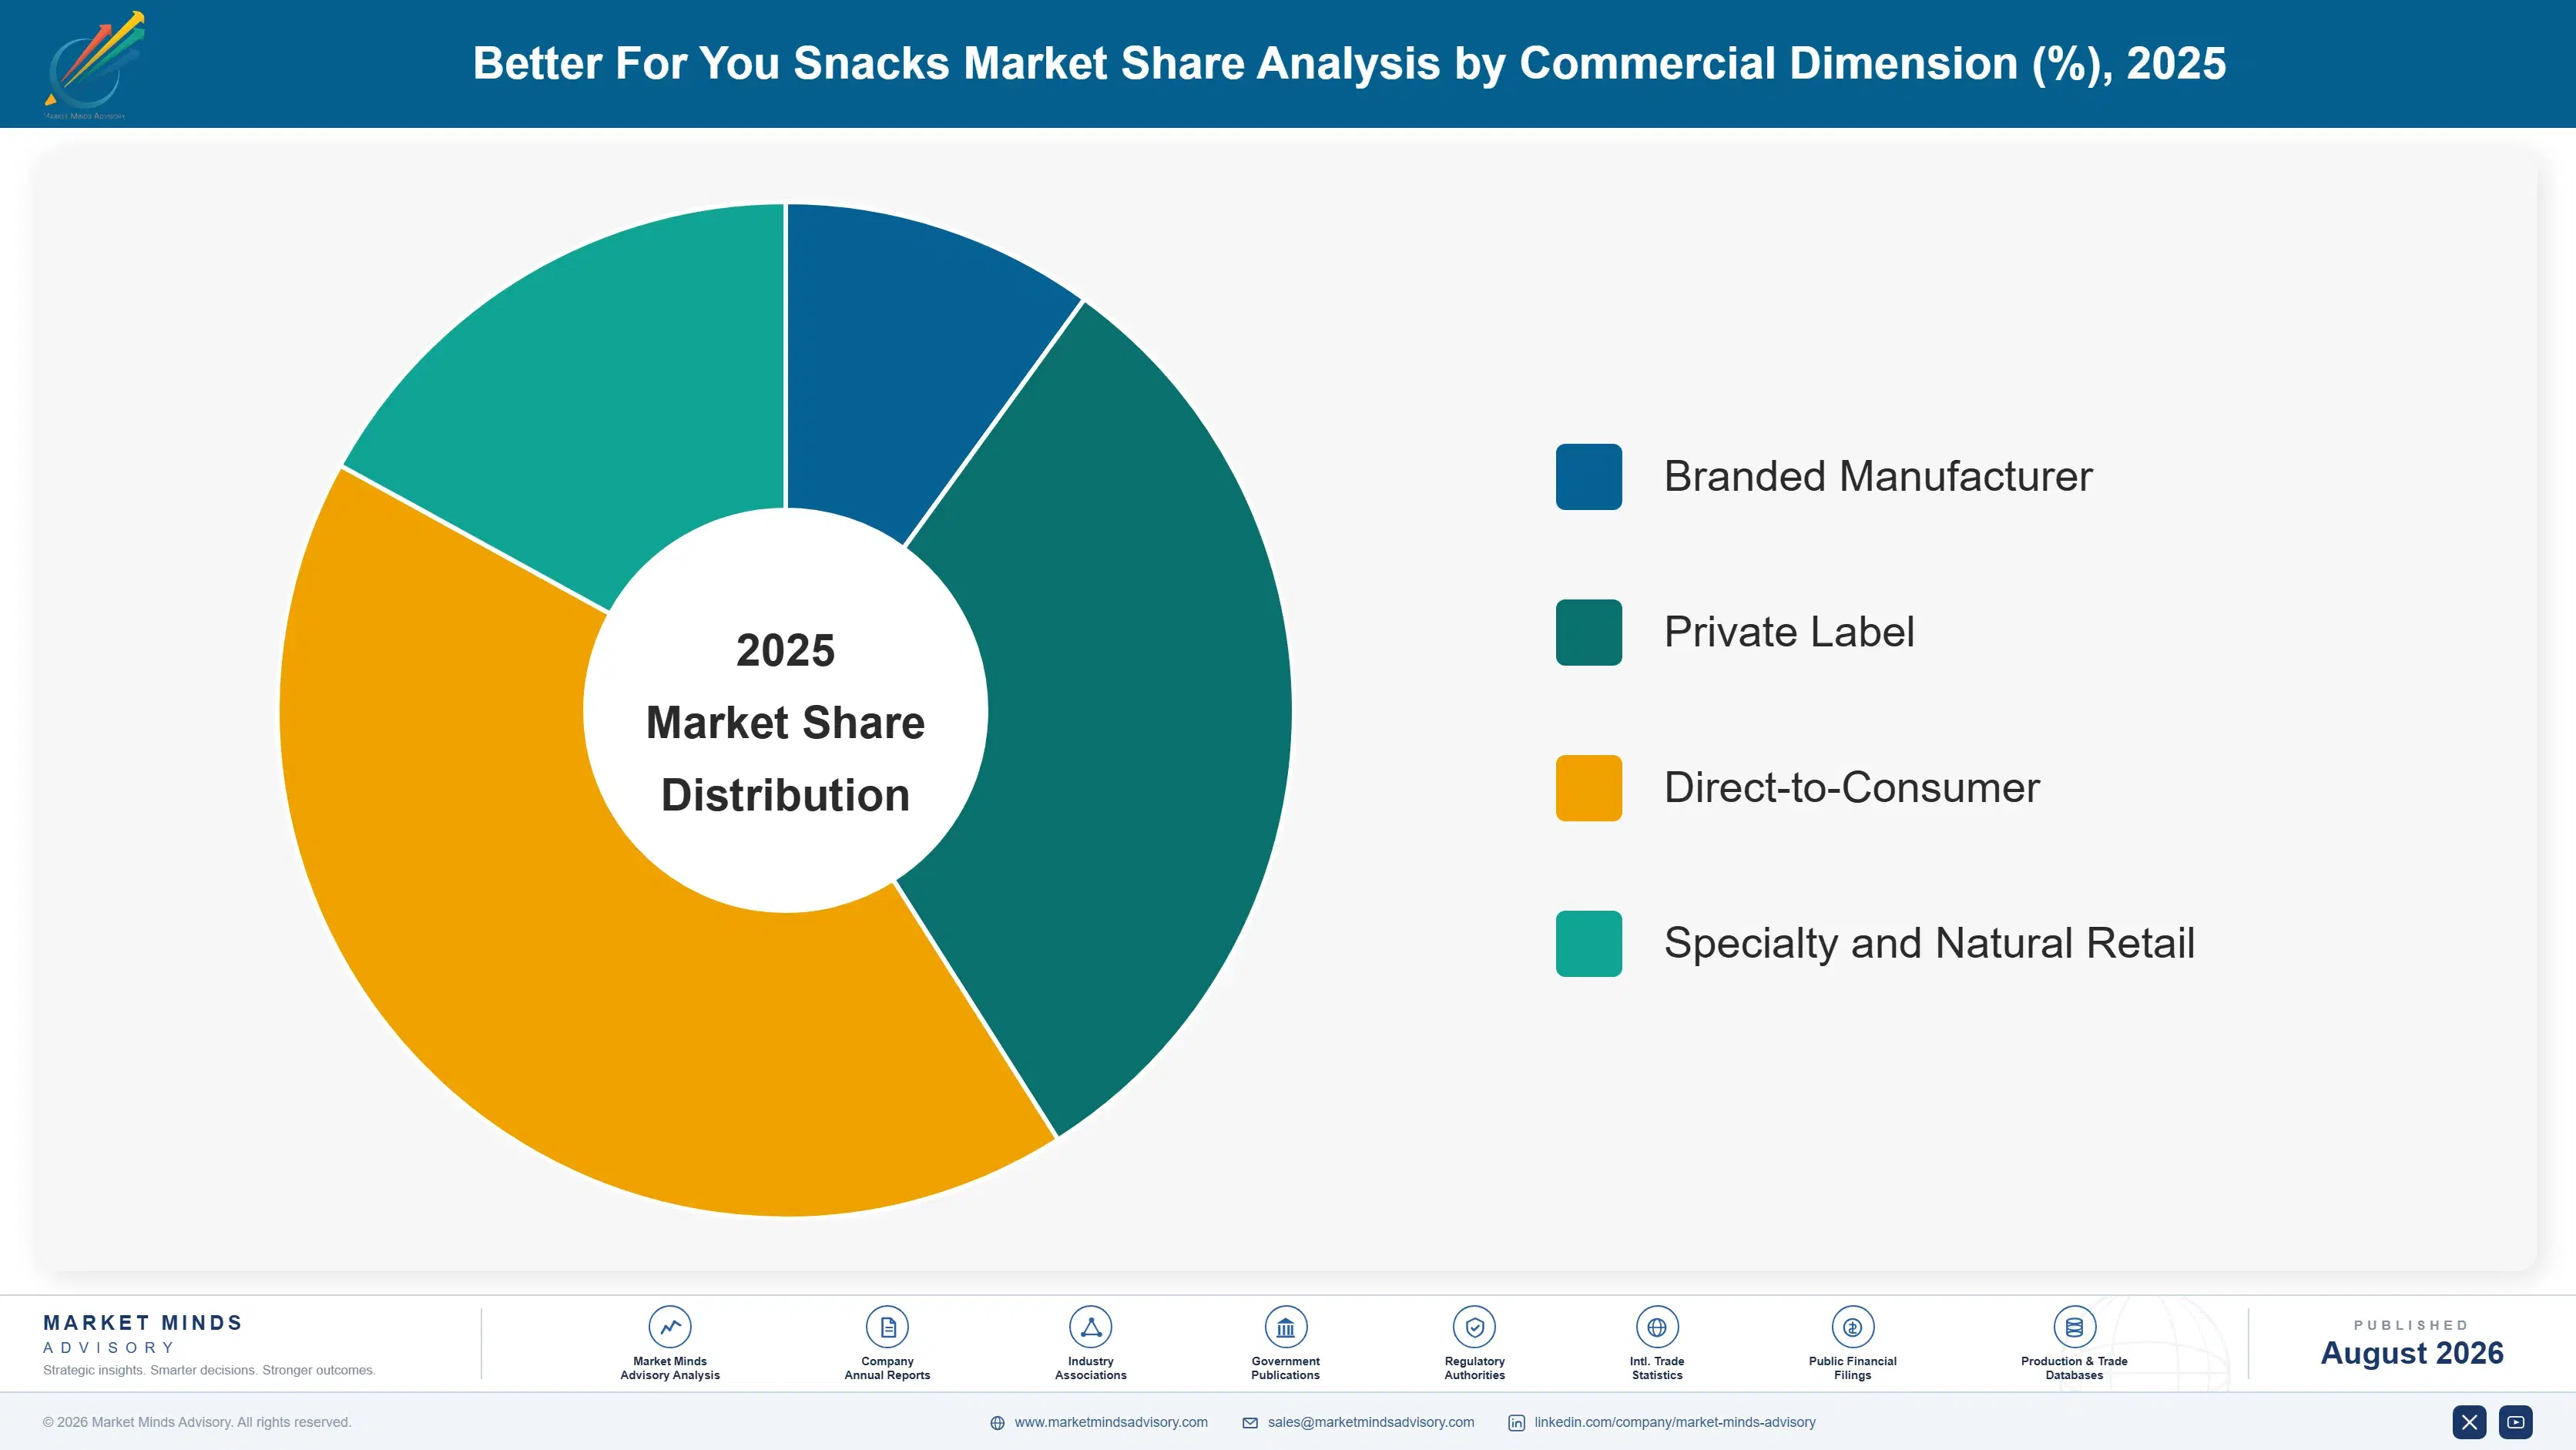
better-for-you-snacks-market-market-share-analysis-1787463074089

Protein and Fiber Fortified Bars

Fortified bars remain the format where functional positioning is most credible to shoppers, since the category originated as a sports nutrition adjacent product and carries an inherited expectation of protein content that chips and puffs lack. Growth is concentrated in savory and grain based bars rather than the traditional sweet granola format, as manufacturers chase shoppers seeking lower sugar alternatives without abandoning the bar format entirely. Private label entrants have been slower to compete here than in other formats because bar manufacturing requires more specialized extrusion and enrobing equipment, preserving branded manufacturer share and pricing power longer than in chips or puffed snacks. Manufacturers are also extending fortified formats into snack size portions aimed at younger buyers.
CAGR 11.4%

Reformulated Baked and Puffed Salty Snacks

Baked and puffed formats are growing fastest among reformulated salty snacks because puffing technology allows sodium and oil reduction with a smaller taste penalty than frying based formats, making the trial to repeat conversion problem less severe than in fried chips. Legume and grain based puffs, made from lentil, chickpea, or ancient grain flours, are taking incremental shelf space from potato and corn based puffs, aided by simultaneous fiber and protein claims that justify premium pricing. Retailer private label programs have moved into this format quickly, compressing branded manufacturer margin faster here than in fortified bars. Retailers are also allocating endcap and secondary display space to these formats during promotional periods, reinforcing their velocity advantage over legacy fried chip lines.
CAGR 9.8%
Full segment breakdown across 6 segments available in the complete report.

Regional Architecture and Country Demand Map

North America leads on retail spend and reformulation depth, Western Europe follows closely on regulatory intensity, while East Asia and South Asia and Pacific scale packaged healthy snacking fastest off smaller current bases, and Latin America, the Middle East, and Eastern Europe remain smaller but steadily expanding markets.

North America

United States grocery and club retailers have institutionalized sugar and sodium thresholds into supplier scorecards faster than any other region, and workplace wellness procurement adds a distribution channel that barely exists elsewhere. Reformulated protein bars and legume based puffs are the fastest growing formats, aided by widespread third party certification infrastructure already built for the adjacent sports nutrition category. Canada is following similar retailer led reformulation criteria roughly two to three years behind the United States. The region's scale advantage comes from combining the largest single national snacking market with the deepest co-manufacturing base for allulose and pulse protein inputs, giving domestic manufacturers faster reformulation cycle times than counterparts sourcing these inputs internationally.
Share: 32% | CAGR: 8.6% (2026 to 2036)

Western Europe

Nutrient profiling models advancing through United Kingdom, French, and Nordic retailers are pushing reformulation at a pace close to North America, but a more fragmented retail landscape across individual national markets slows the speed at which any single reformulation standard becomes universal across the region. Organic and clean label certification carries more shopper weight here than in North America, giving smaller regional brands more room to compete against multinational manufacturers than they have in other markets. Germany and the Nordic countries lead per capita spend on functional snacking, while Southern European markets remain more attached to traditional Mediterranean snack formats, slowing the region's blended growth rate relative to North America.
Share: 22% | CAGR: 6.0% (2026 to 2036)
Regional intelligence for 5 additional markets available in the complete report: East Asia, South Asia and Pacific, Latin America, Middle East and Africa, Eastern Europe. Contact sales@marketmindsadvisory.com.
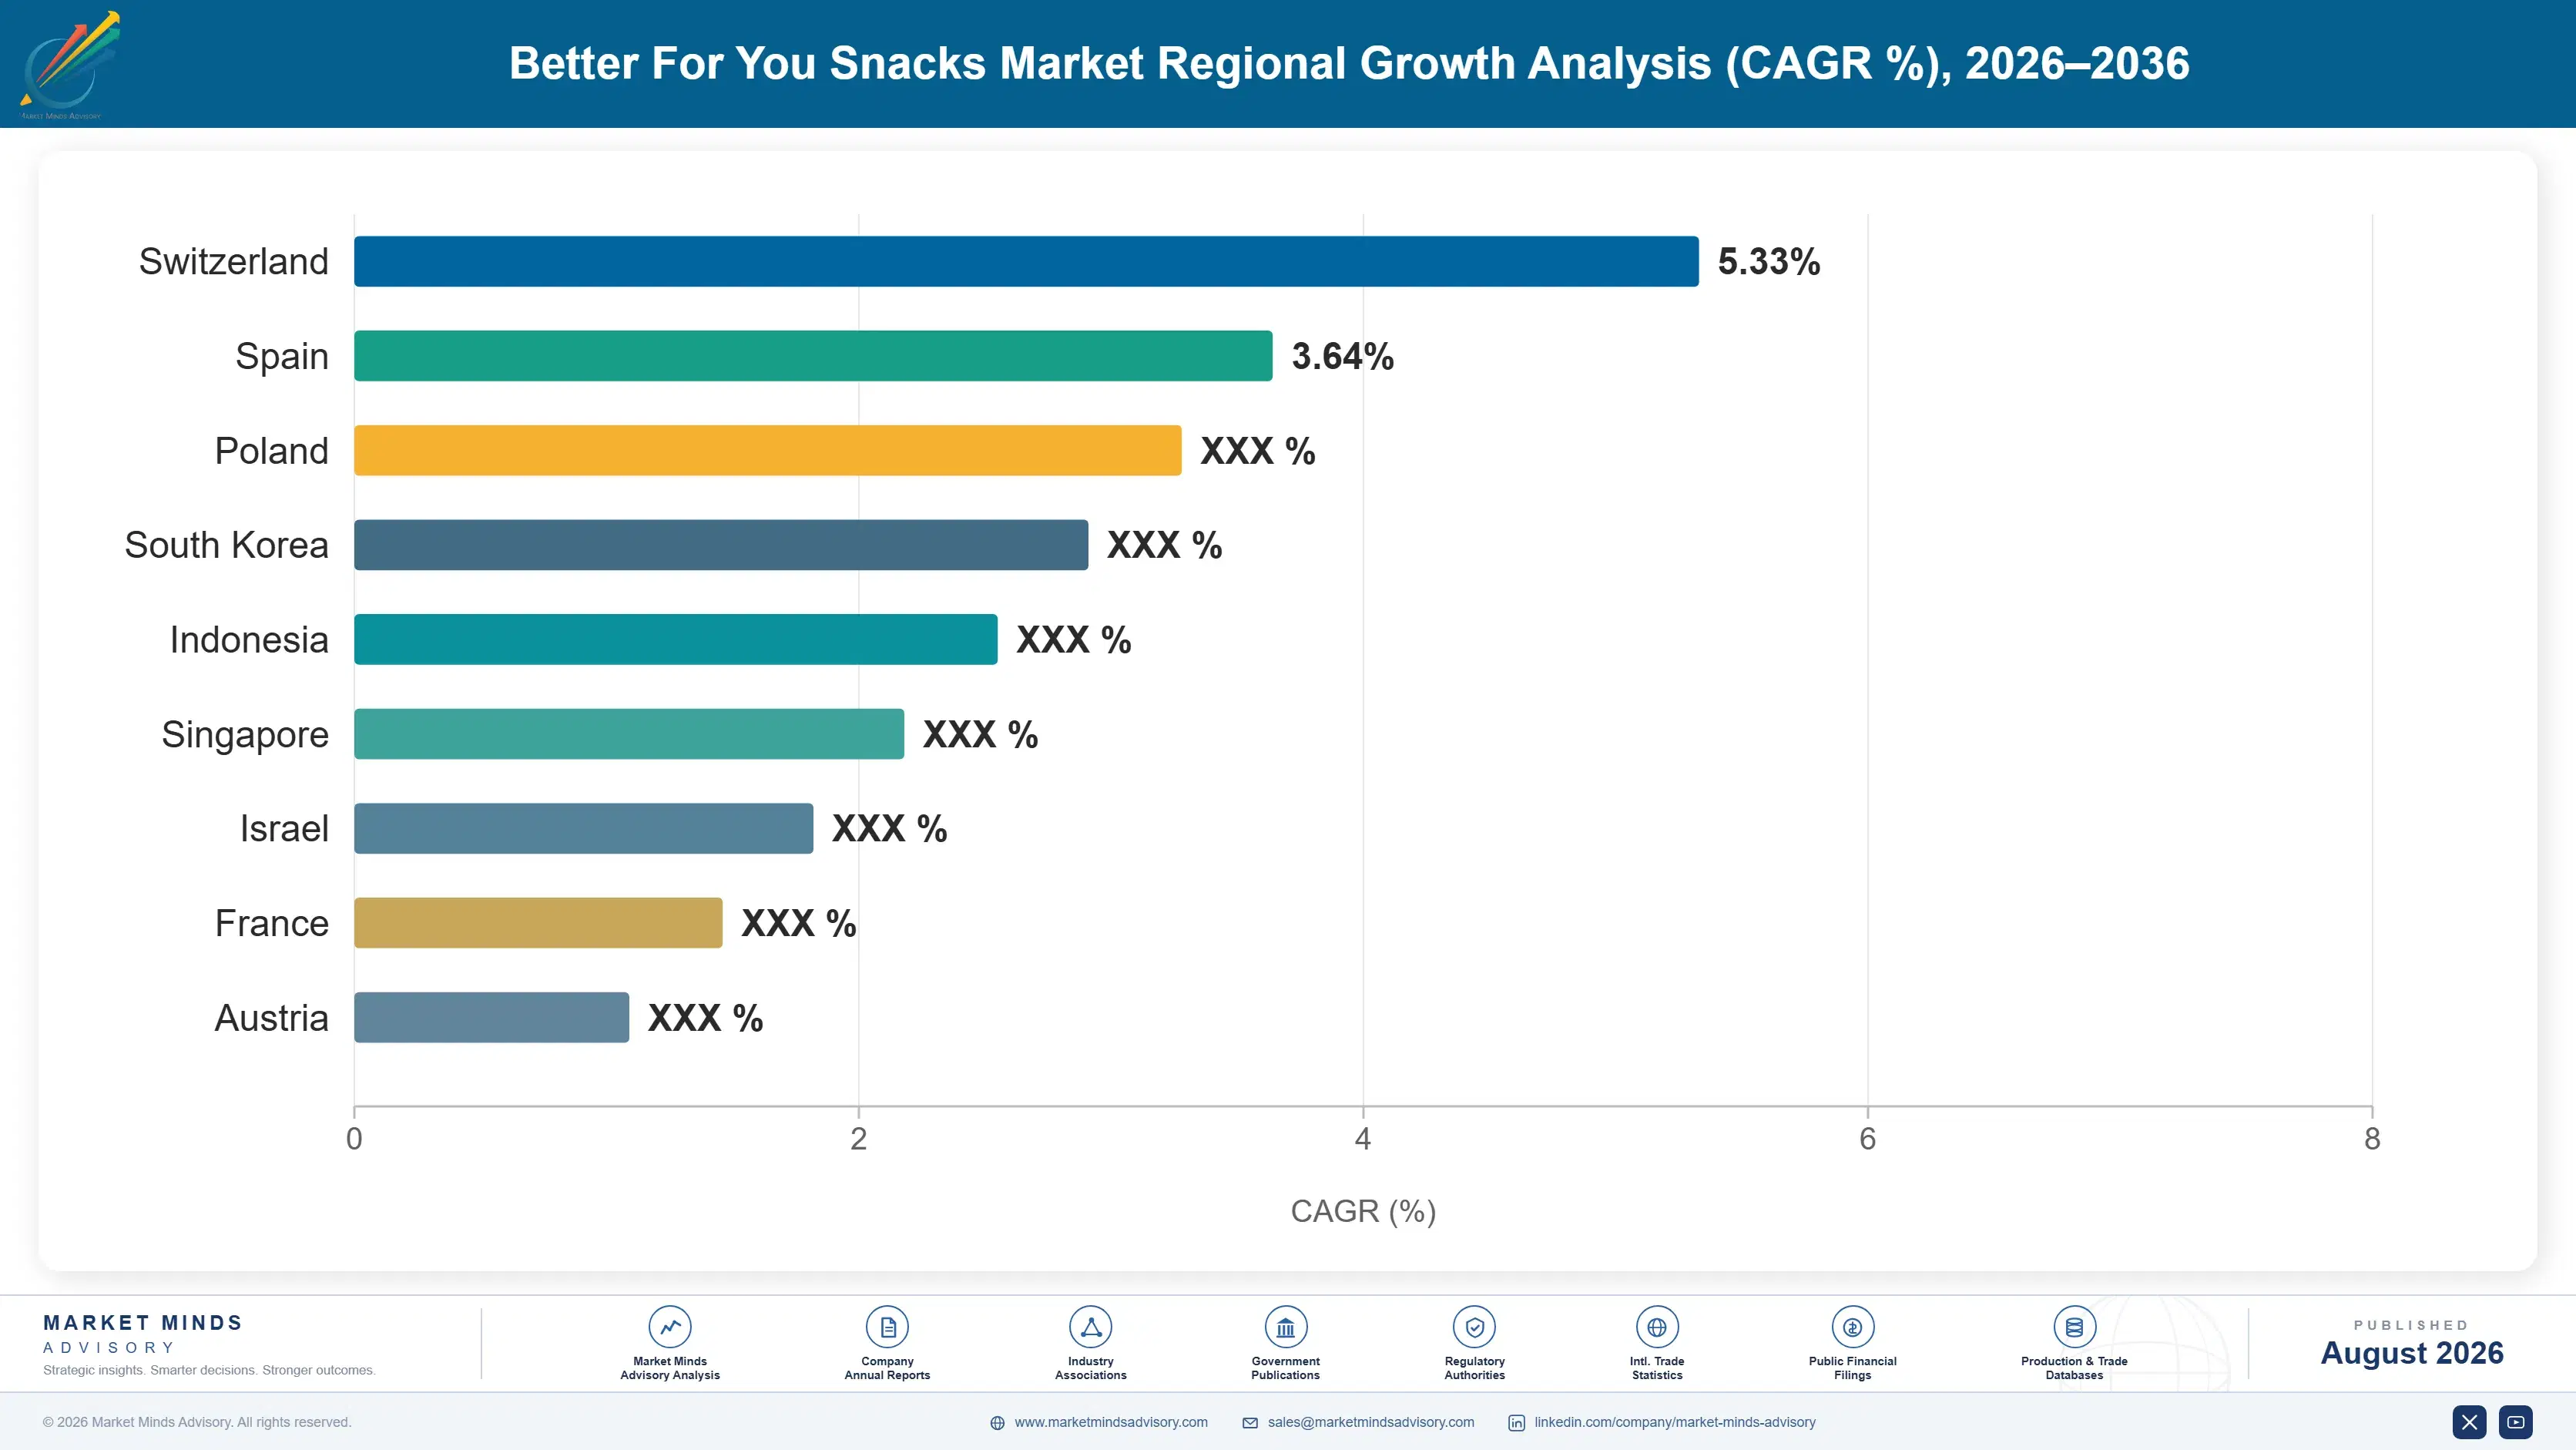
better-for-you-snacks-market-country-cagr-analysis-1787463074601

Claim Architecture and Channel Expansion Levers

Manufacturers are pulling four commercial levers simultaneously: certified claim upgrades, co-manufacturing capacity expansion, institutional channel entry, and private label defense, each addressing a distinct margin pressure point identified across the category's current retailer negotiations. These levers are not mutually exclusive, and manufacturers gaining share fastest typically combine at least two within a single fiscal year.

Third Party Protein and Fiber Certification Upgrades

Moving from a self declared protein or fiber claim to a third party verified certification mark typically supports a retail price premium of 8 to 12 percent, since certification addresses shopper skepticism toward front of pack claims that has grown alongside reformulation marketing volume across the category. Certification costs remain modest relative to the pricing power gained, particularly for mid sized manufacturers lacking the brand equity of category leaders. Retailers increasingly favor certified SKUs in planogram placement decisions, adding a distribution benefit on top of the direct pricing advantage that compounds over successive shelf reset cycles.
Market Impact: Lifts retail price realization by roughly 10 percent annually

Flexible Co-Manufacturing Capacity for Rapid Claim Rotation

Investing in flexible, multi SKU co-manufacturing lines that can switch between formulations within days rather than weeks allows manufacturers to respond to retailer threshold changes without the six to nine month lead time traditional dedicated production lines require. This flexibility is increasingly a condition of large retailer contracts rather than a competitive differentiator, since retailers now expect suppliers to demonstrate reformulation agility during vendor negotiations. Early adopters of flexible capacity have captured incremental shelf space from slower moving competitors during at least two consecutive shelf reset cycles. Manufacturers running flexible lines have cut reformulation lead time by roughly 30 percent.
Market Impact: Cuts reformulation lead time by roughly 60 percent overall

Institutional and Workplace Wellness Channel Entry

Building direct supply relationships with self insured employers, health plans, and workplace vending operators opens a distribution channel growing faster than traditional retail, currently representing roughly 6 percent of category volume in the United States alone. This channel rewards certified claims and consistent formulation over flavor rotation, favoring manufacturers with established quality systems already built for retail distribution. Entry costs are relatively low since existing manufacturing and logistics infrastructure can serve this channel with minimal incremental investment beyond dedicated account management resources. Channel volume has grown at double the rate of traditional grocery distribution over the past two years.
Market Impact: Adds roughly 6 percent of incremental institutional channel volume

Private Label Partnership to Defend Retailer Relationships

Rather than ceding private label reformulated snack production entirely to specialized contract manufacturers, several branded players are now running dedicated private label production lines themselves, protecting the underlying retailer relationship and co-manufacturing volume even as branded shelf share erodes. This approach sacrifices some branded margin but preserves manufacturing scale economics and retailer negotiating leverage that would otherwise transfer entirely to competitors. Margins on private label volume run roughly 15 percent below branded equivalents but still exceed the cost of idle production capacity. This approach has preserved an estimated 20 percent of at-risk retailer shelf volume across recent negotiation cycles.
Market Impact: Preserves roughly 20 percent of at-risk retailer shelf volume

Who Controls the Margin Pool

Concentration remains moderate, with the top five manufacturers holding a combined 34 percent share on a revenue basis, leaving meaningful room for challenger brands that established players have increasingly addressed through acquisition rather than organic competition, particularly for smaller functional snack brands with strong claim credibility but limited manufacturing scale. This gap has widened as smaller brands secure venture funding for rapid expansion.
Current competitive activity centers on three dimensions: acquisition of emerging better for you brands to acquire claim credibility faster than in house reformulation allows, direct investment in protein and allulose processing capacity to secure input supply, and expansion of co-manufacturing capabilities to serve private label customers without cannibalizing branded volume. These investments are increasingly coordinated rather than pursued independently across separate business units.

Emerging pressure comes from retailer private label programs that have closed much of the credibility gap on clean label claims, and from smaller regional manufacturers using flexible co-manufacturing capacity to launch compliant SKUs faster than multinational competitors can move through internal approval processes, threatening to shift shelf share away from established branded players over the next several shelf reset cycles. Rankings among the top five players could shift within the next two reset cycles.
better-for-you-snacks-market-company-positioning-matrix-1787463075122

Competitive Moat and Risk Dimensions

PEPSICO

Moat: Scale and Distribution Reach

PepsiCo's direct store delivery network and existing retailer relationships across grocery, club, and convenience channels give its better for you brands faster distribution access than smaller competitors can achieve, while its scale supports long term ingredient supply contracts that smaller manufacturers cannot match on comparable terms.
PEPSICO

Risk: Portfolio Reformulation Lag

A large legacy conventional snack portfolio creates internal tension between protecting existing volume and accelerating reformulation, slowing the pace at which flagship brands adopt sugar and sodium reduction relative to smaller, purpose built better for you challengers entering the same shelf sets. This lag has already cost measurable shelf space in recent reset cycles.
MONDELEZ INTERNATIONAL

Moat: Global Manufacturing Footprint

A broad international manufacturing footprint allows Mondelez to localize reformulation strategy by region, meeting Latin American warning label requirements and European nutrient profiling standards without relying on a single global formulation, an advantage smaller regional players lack. This regional flexibility also shortens the time needed to bring compliant products to market.
MONDELEZ INTERNATIONAL

Risk: Legacy Recipe Brand Equity

Several flagship brands carry decades of consumer expectation around taste and texture, making aggressive reformulation commercially risky even where regulatory pressure demands it, forcing a slower phased reformulation approach that cedes early mover advantage to smaller, more flexible competitors. This phased approach has already allowed challenger brands to gain measurable shelf space.

Players Tracked

Prominent Players

PepsiCo
Mondelez International
General Mills
Kellanova
Hain Celestial

Other Key Players

Mars Incorporated
Hormel Foods
Simply Good Foods
KIND LLC
Clif Bar and Company
Utz Brands
Conagra Brands
The Kraft Heinz Company
Amy's Kitchen
Beyond Meat
Britannia Industries
Haldiram's
Calbee Inc
Nongshim Co Ltd
Ajinomoto Co Inc

Recent Developments

MARCH 2026

PepsiCo Expands Allulose Sourcing Agreement

PepsiCo signed a multi year supply agreement with a leading allulose producer to secure input volume for its expanding portfolio of reduced sugar snack reformulations across North American manufacturing facilities, addressing a capacity constraint that had slowed reformulation timelines across several flagship brands within its North American manufacturing network.
Signal: Signals sustained reformulation investment ahead of upcoming shelf reset negotiation cycles across major North American retail accounts.
SEPTEMBER 2025

Mondelez Acquires Regional Protein Snack Brand

Mondelez International completed the acquisition of a mid sized protein fortified snack brand with strong third party certification credibility, adding claim verified manufacturing capability and distribution relationships in the natural and specialty retail channel that Mondelez's existing brands had not fully penetrated, particularly among younger, health focused shoppers.
Signal: Confirms acquisition remains faster than organic reformulation for claim credibility across the broader better for you category.
JANUARY 2026

Kellanova Launches Legume Based Puff Platform

Kellanova introduced a new legume flour based puffed snack platform carrying combined protein and fiber claims, manufactured on newly converted flexible extrusion lines capable of rapid formulation changes to meet evolving retailer sugar and sodium thresholds across multiple national markets, ahead of anticipated regulatory changes in key export markets.
Signal: Demonstrates flexible manufacturing investment ahead of anticipated labeling rule changes across several Latin American and Gulf markets.

Protein and Sweetener Input Exposure

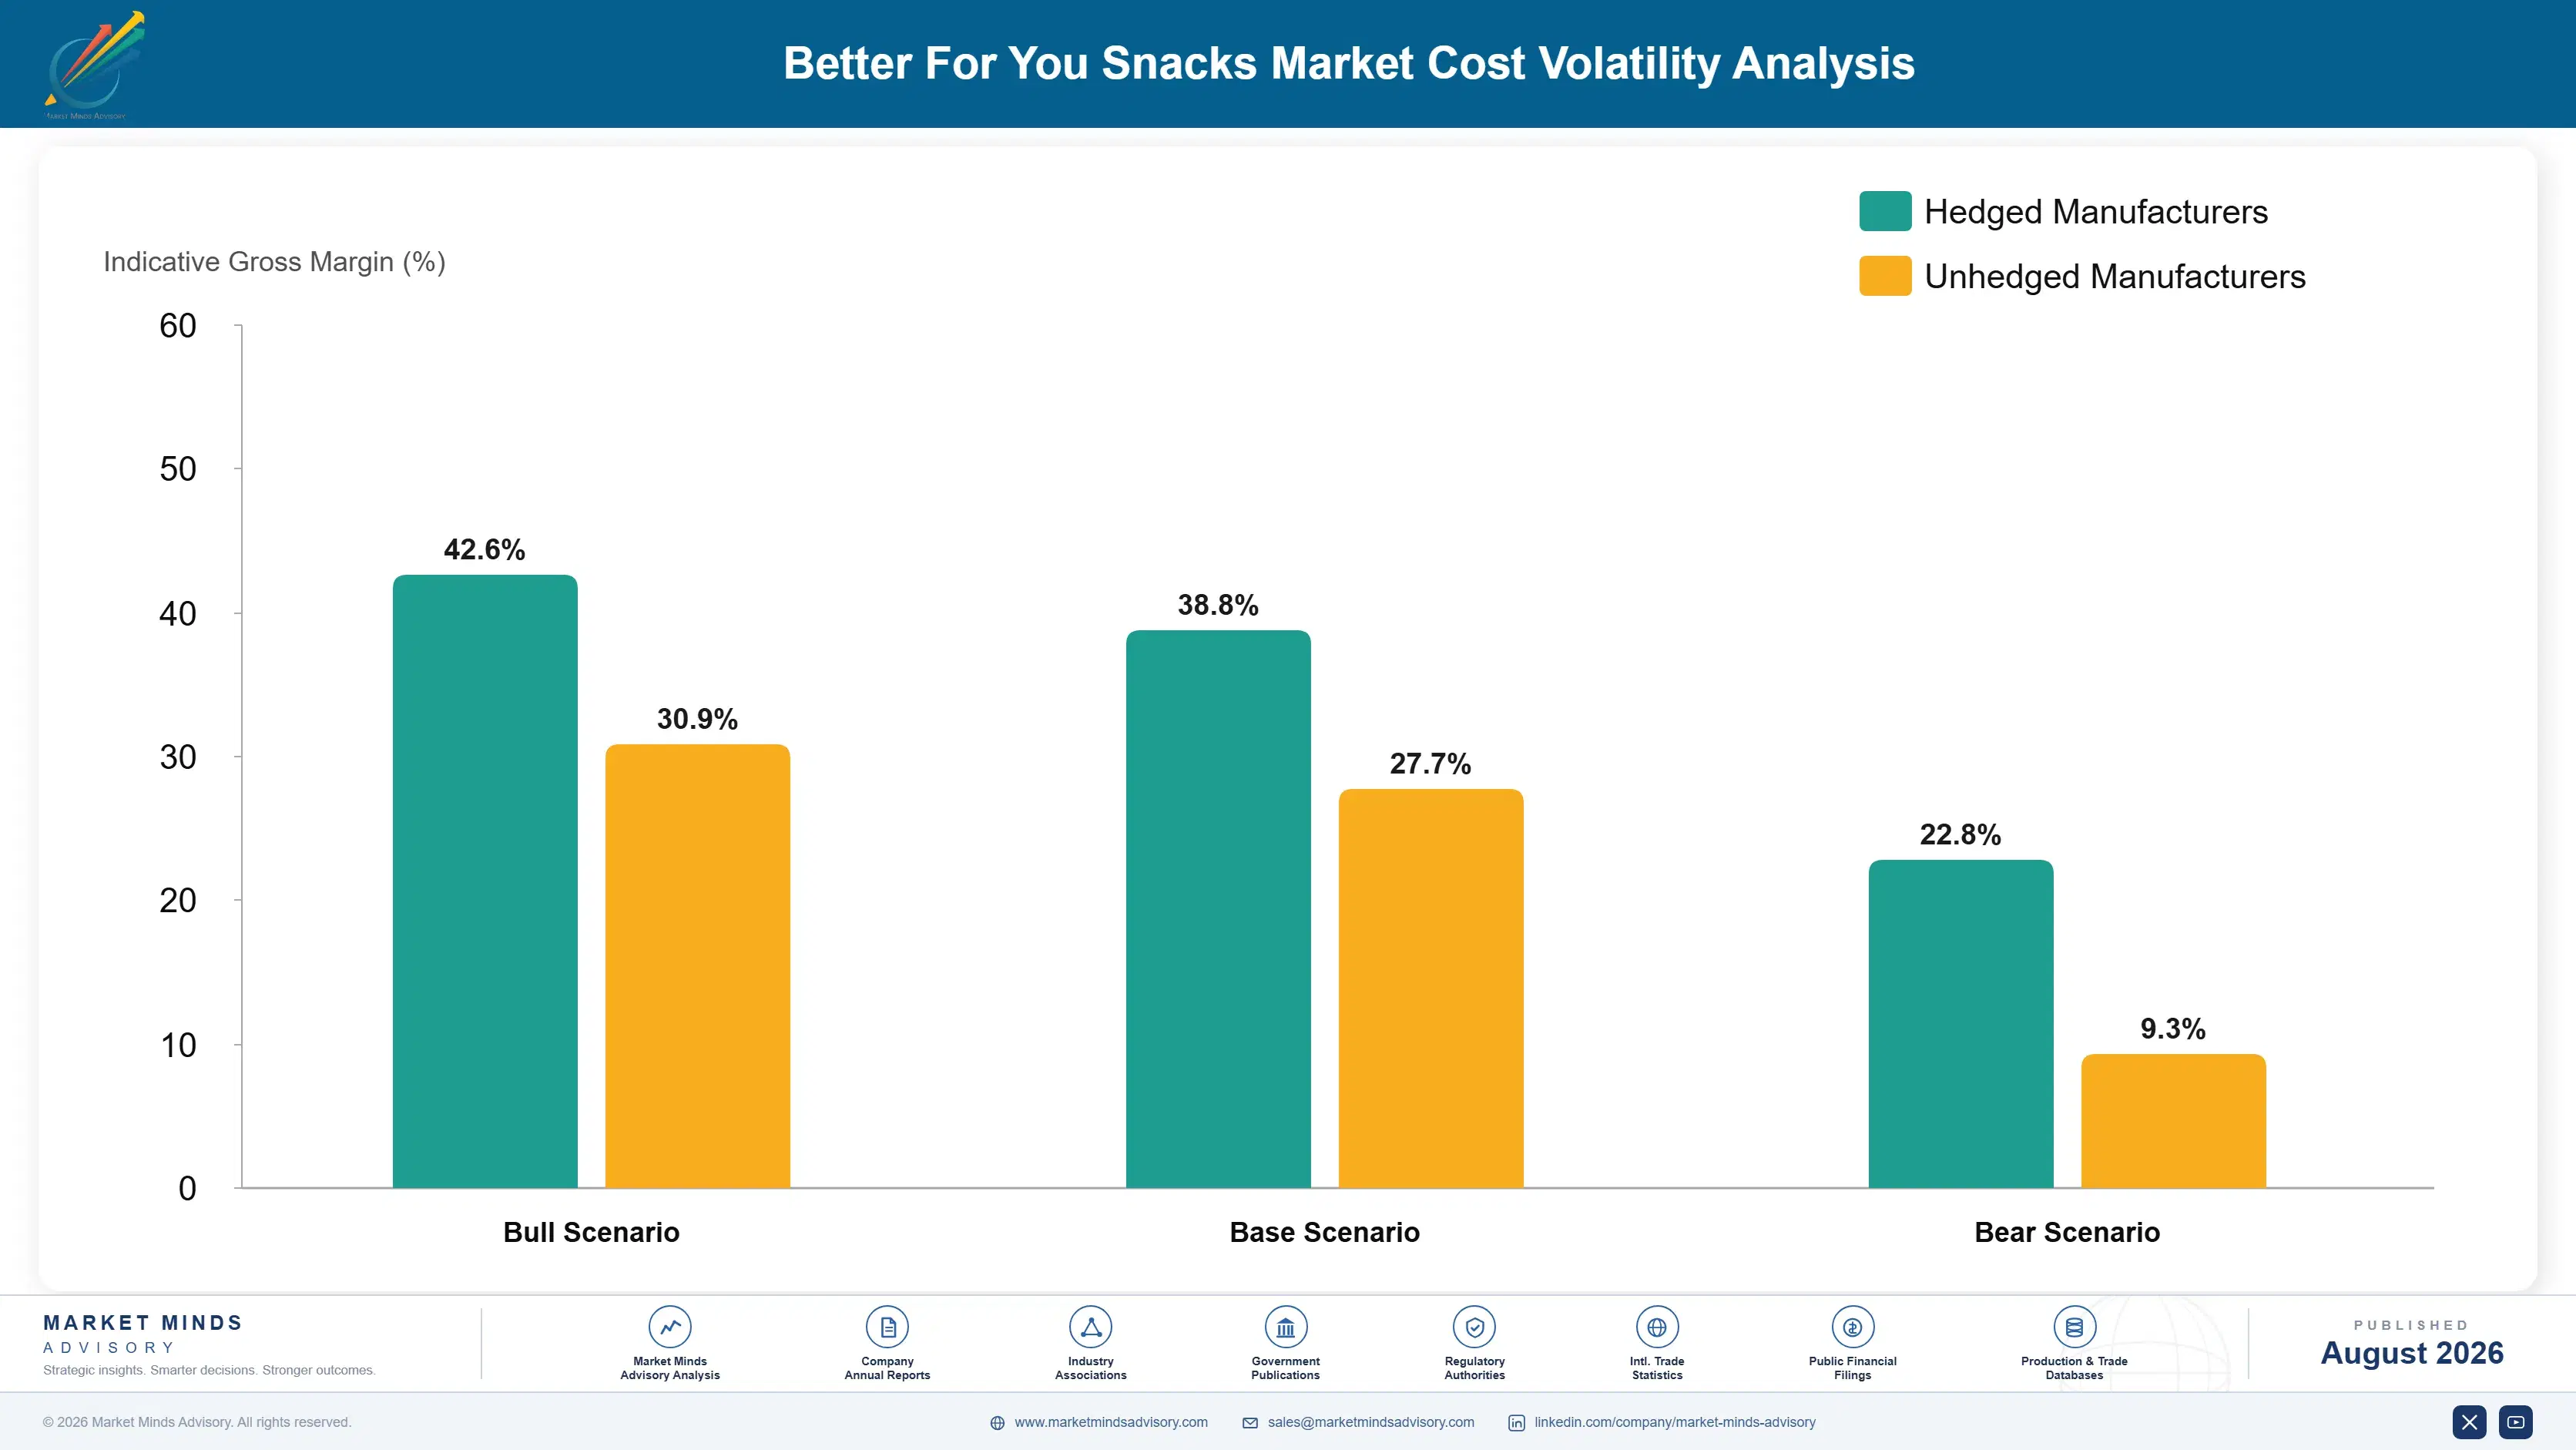
Certified protein isolates and alternative sweeteners together represent roughly 19 percent of cost of goods sold for reformulated snack SKUs, sourced primarily from North American pulse processing plants and allulose production facilities concentrated in the American Midwest, with a smaller share of specialty proteins imported from European and Australian processors, with a smaller residual share sourced from South American growers.
Pea protein prices rose sharply through 2022 and into early 2023 as reformulation demand outpaced processing capacity additions, a volatility event documented in United States Department of Agriculture commodity reporting, compressing gross margins for manufacturers lacking long term supply contracts and forcing several mid sized brands to delay planned reformulation launches by two to three quarters. Several manufacturers reported similar cost pressure again in early 2024 as demand continued outpacing new processing capacity.

Exposure varies considerably by player type: large manufacturers with direct investment in processing joint ventures or multi year offtake agreements have largely insulated themselves from spot market volatility, while smaller brands sourcing through ingredient distributors absorb price spikes directly, creating a meaningful cost disadvantage that is increasingly steering acquisition activity toward brands without secured input contracts.
better-for-you-snacks-market-cost-volatility-analysis-1787463075318

Direct Investment in Protein Processing Joint Ventures

Several large manufacturers have taken minority equity stakes in pea and faba protein processing plants, securing preferential input pricing and volume access ahead of spot market buyers during periods of tight supply, while sharing capital expenditure risk with established ingredient processors rather than building proprietary processing capacity independently. This approach has already secured multi-year input pricing certainty.

Multi Year Fixed Volume Offtake Agreements

Locking in three to five year offtake agreements with allulose and protein processors at fixed or collared pricing protects margin during volatility events, though it requires accurate long term demand forecasting that smaller manufacturers with less established reformulation pipelines often find difficult to commit to confidently. Smaller manufacturers increasingly pool volume through cooperative purchasing groups to qualify.

Staged Reformulation to Manage Ingredient Substitution Risk

Reducing sugar or sodium across two or three formulation cycles rather than one step allows manufacturers to phase ingredient substitution volume gradually, smoothing procurement requirements and reducing exposure to any single input price spike relative to manufacturers attempting a single, complete reformulation. This gradual approach also gives procurement teams more lead time to renegotiate supplier contracts favorably.

Portfolio Architecture for Margin Defence

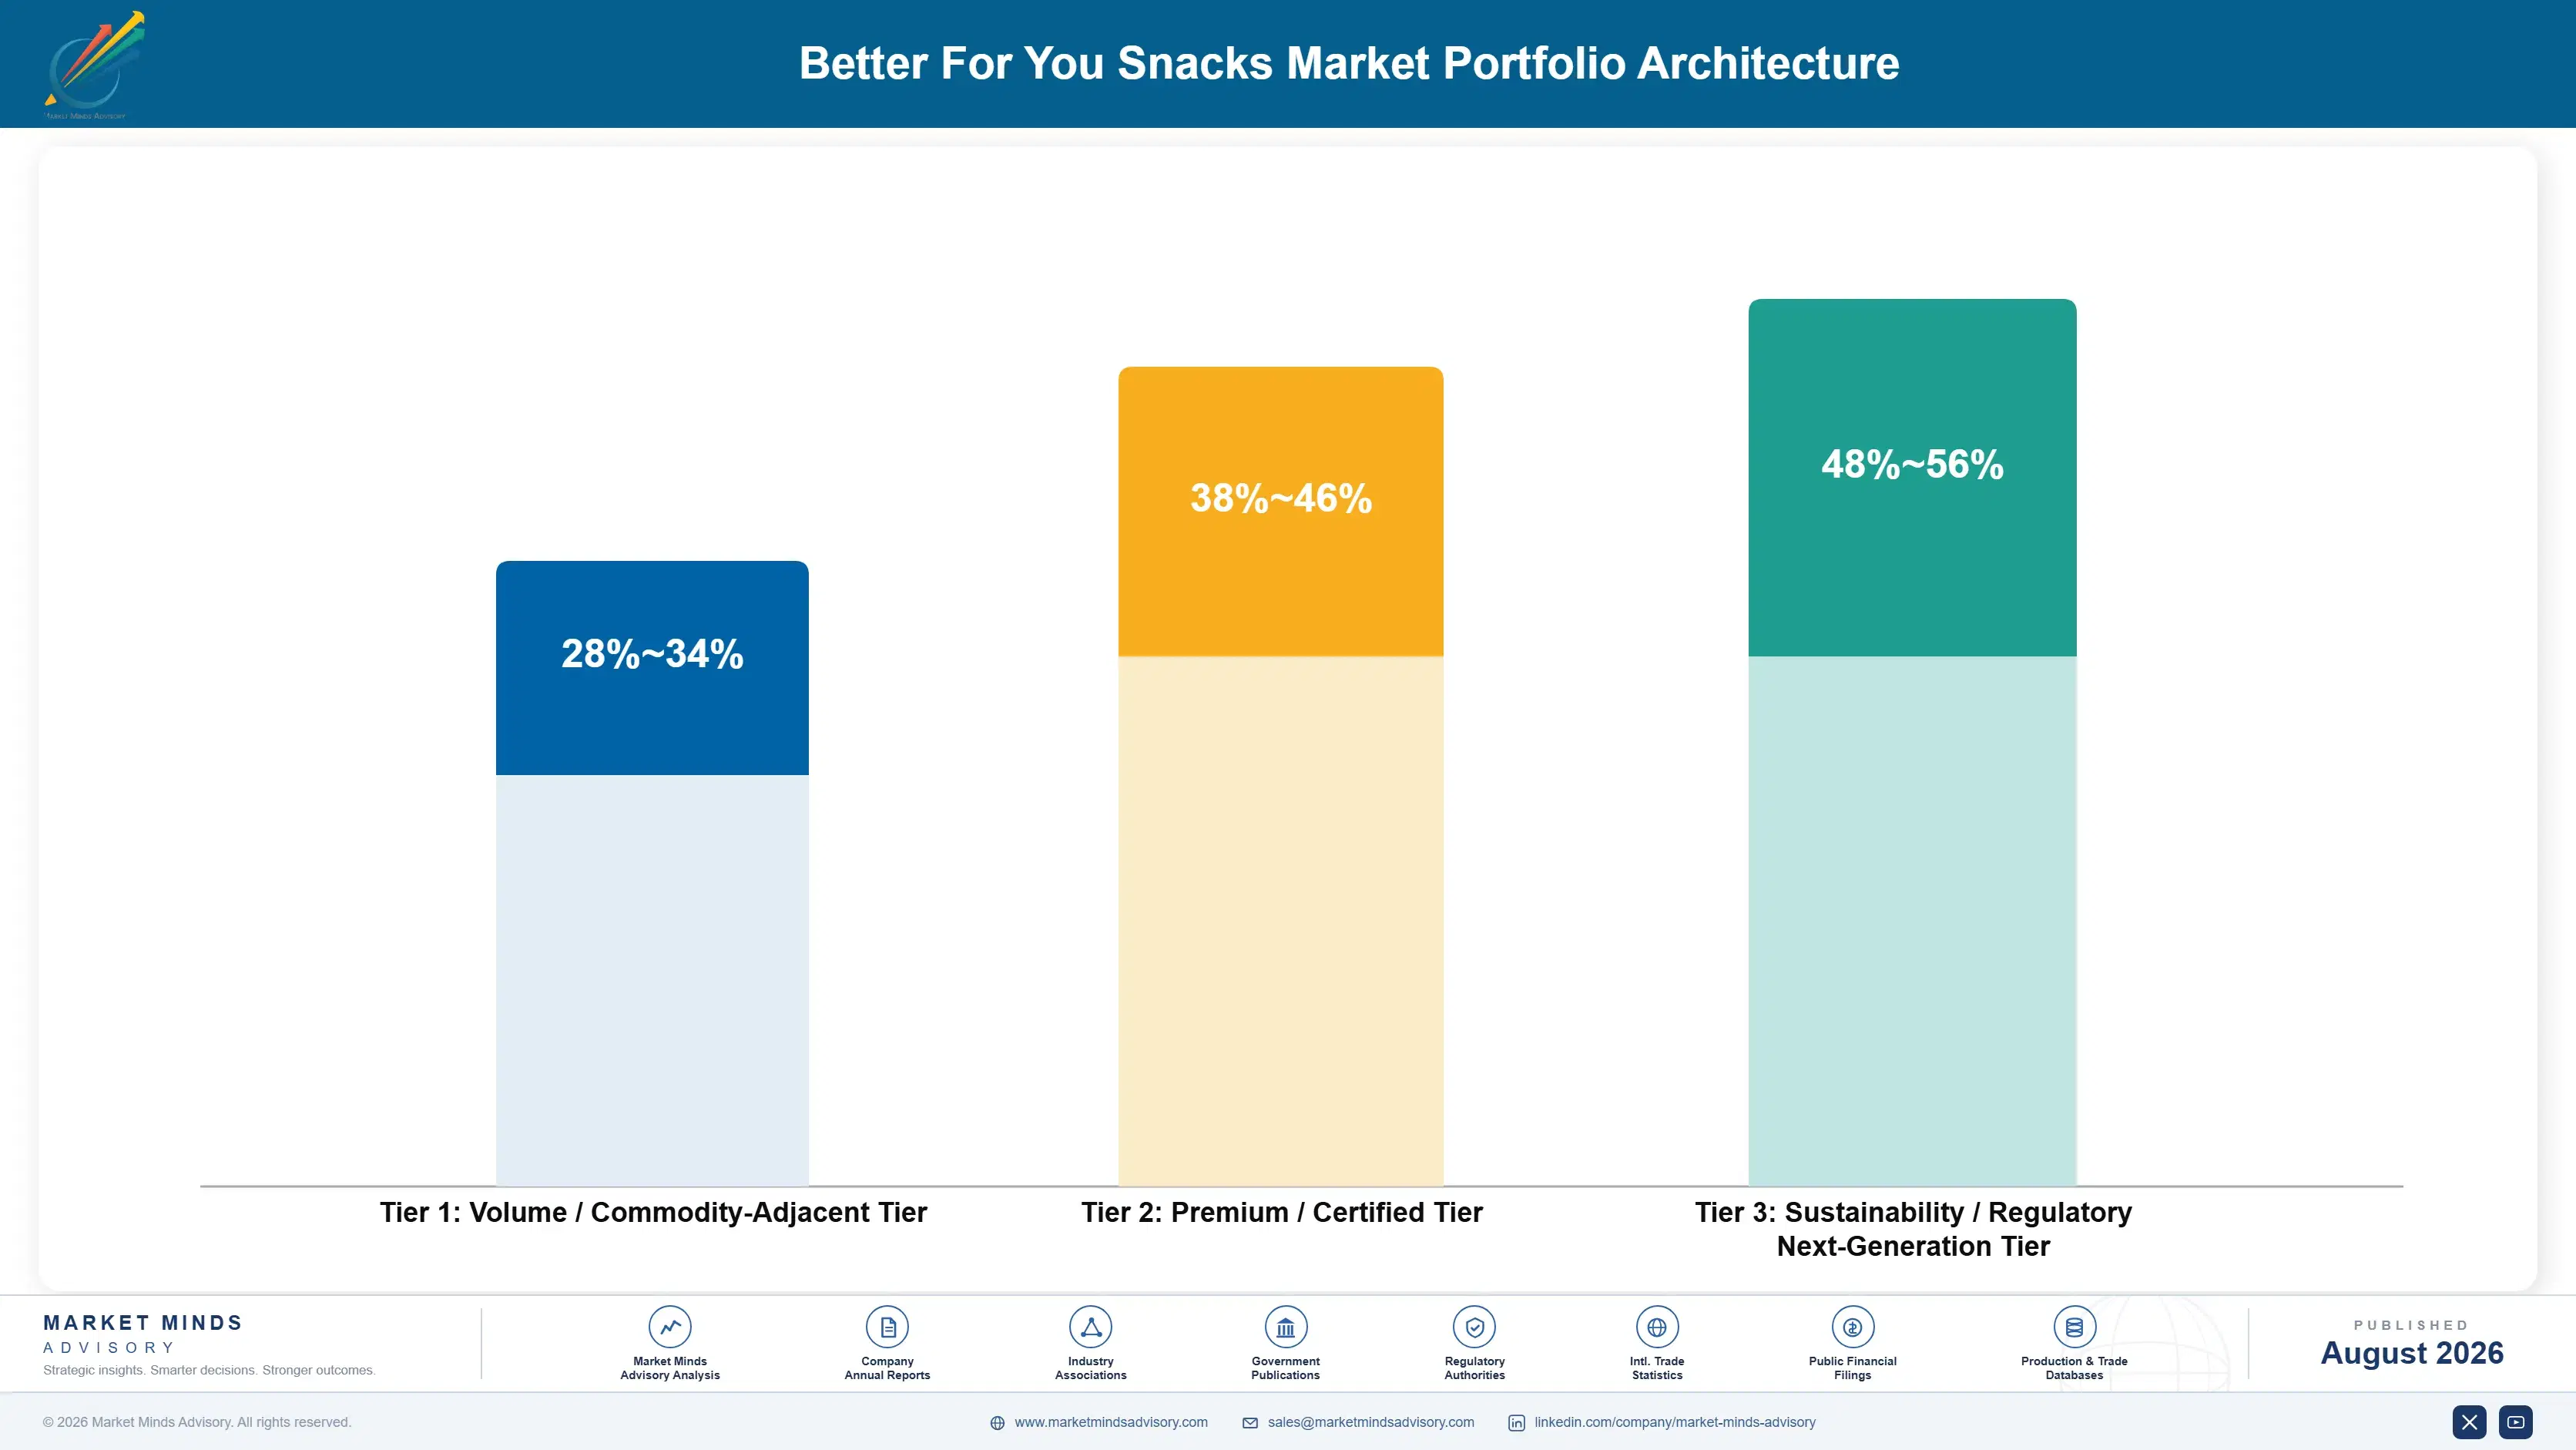
Portfolio economics split cleanly across three tiers: volume oriented reformulated SKUs competing close to conventional snack pricing, certified premium formats carrying verified protein or fiber claims, and next generation formats built around novel ingredients or advanced processing that command the highest margin but remain a small share of total volume. This tier split mirrors patterns seen across other reformulating packaged food categories over the past decade.
The tension between volume and premium positioning is most visible at retailer shelf resets, where private label operators are compressing margin in the volume tier faster than in the premium tier, pushing branded manufacturers to defend volume tier share on cost efficiency while investing disproportionately in premium tier innovation where private label competition remains weaker. Retailers are reinforcing this tension by allocating shelf resets around claim tier rather than legacy brand loyalty.

High value margin pools concentrate in third party certified formats sold through specialty and natural retail channels, where shoppers exhibit lower price sensitivity and higher willingness to pay for verified claims, giving manufacturers with strong certification credibility a durable pricing advantage over competitors relying on self declared claims alone. Manufacturers without certification infrastructure risk being excluded from this margin pool entirely.

Volume / Commodity-Adjacent Tier

Reformulated SKUs priced close to conventional snacks, competing primarily on distribution reach, shelf presence, and manufacturing cost efficiency rather than on certified claims, and increasingly exposed to private label substitution at retail.
Gross Margin: 28-34%

Premium / Certified Tier

Third party certified protein and fiber claims commanding retail price premiums of 8 to 12 percent over standard reformulated SKUs, sold primarily through mainstream grocery and specialty retail channels to claim sensitive shoppers.
Gross Margin: 38-46%

Sustainability / Regulatory / Next-Generation Tier

Novel ingredient platforms and advanced processing formats serving specialty retail and institutional wellness channels, commanding the highest per unit margin though still representing a small share of total category volume.
Gross Margin: 48-56%
better-for-you-snacks-market-portfolio-architecture-1787463075816

High-value Sub-segments and Strategic Watch-out

Legume Flour Based Puffed Snacks

Combining protein and fiber claims with a taste profile closer to conventional puffed snacks than earlier legume formats, this segment is capturing incremental shelf space fastest among reformulated salty snacks, aided by relatively low reformulation cost and strong retailer receptivity to double nutrient claims across most major grocery chains.
Gross Margin: 40-48%

Third Party Certified Protein Bars

Certification addresses shopper skepticism toward self declared claims, supporting durable pricing power in a format where trial to repeat conversion remains strong, though growth has moderated slightly as the format matures relative to newer entrants. Retailers continue to allocate stable shelf space to this proven format.
Gross Margin: 42-50%

Conventional Baked Salty Snacks with Sodium Reduction Only

The largest volume segment by unit count, competing primarily on price and distribution scale rather than premium claims, and increasingly exposed to private label substitution as retailers expand store brand reformulated offerings. Branded manufacturers are defending this segment mainly through cost efficiency rather than through claim based differentiation strategies.
Gross Margin: 26-32%

High Sugar Legacy Confectionery-Adjacent Snacks

Facing accelerating delisting risk as front of pack warning label regimes and retailer scorecards expand geographically, this segment requires urgent reformulation investment or managed volume decline planning across the next several planning cycles. Several major retailers have already signaled intent to delist noncompliant SKUs within the next two shelf resets.
Gross Margin: 30-36%

Reformulation Cycle Economics

Demand in this category behaves less like a one time purchase decision and more like a recurring reformulation obligation, since retailer scorecards reset thresholds periodically, requiring manufacturers to treat compliance engineering as an ongoing operating cost rather than a one time product development expense, creating a form of annuity demand for reformulation ingredients and flexible manufacturing capacity. This dynamic increasingly resembles subscription style demand more than one time product launches.
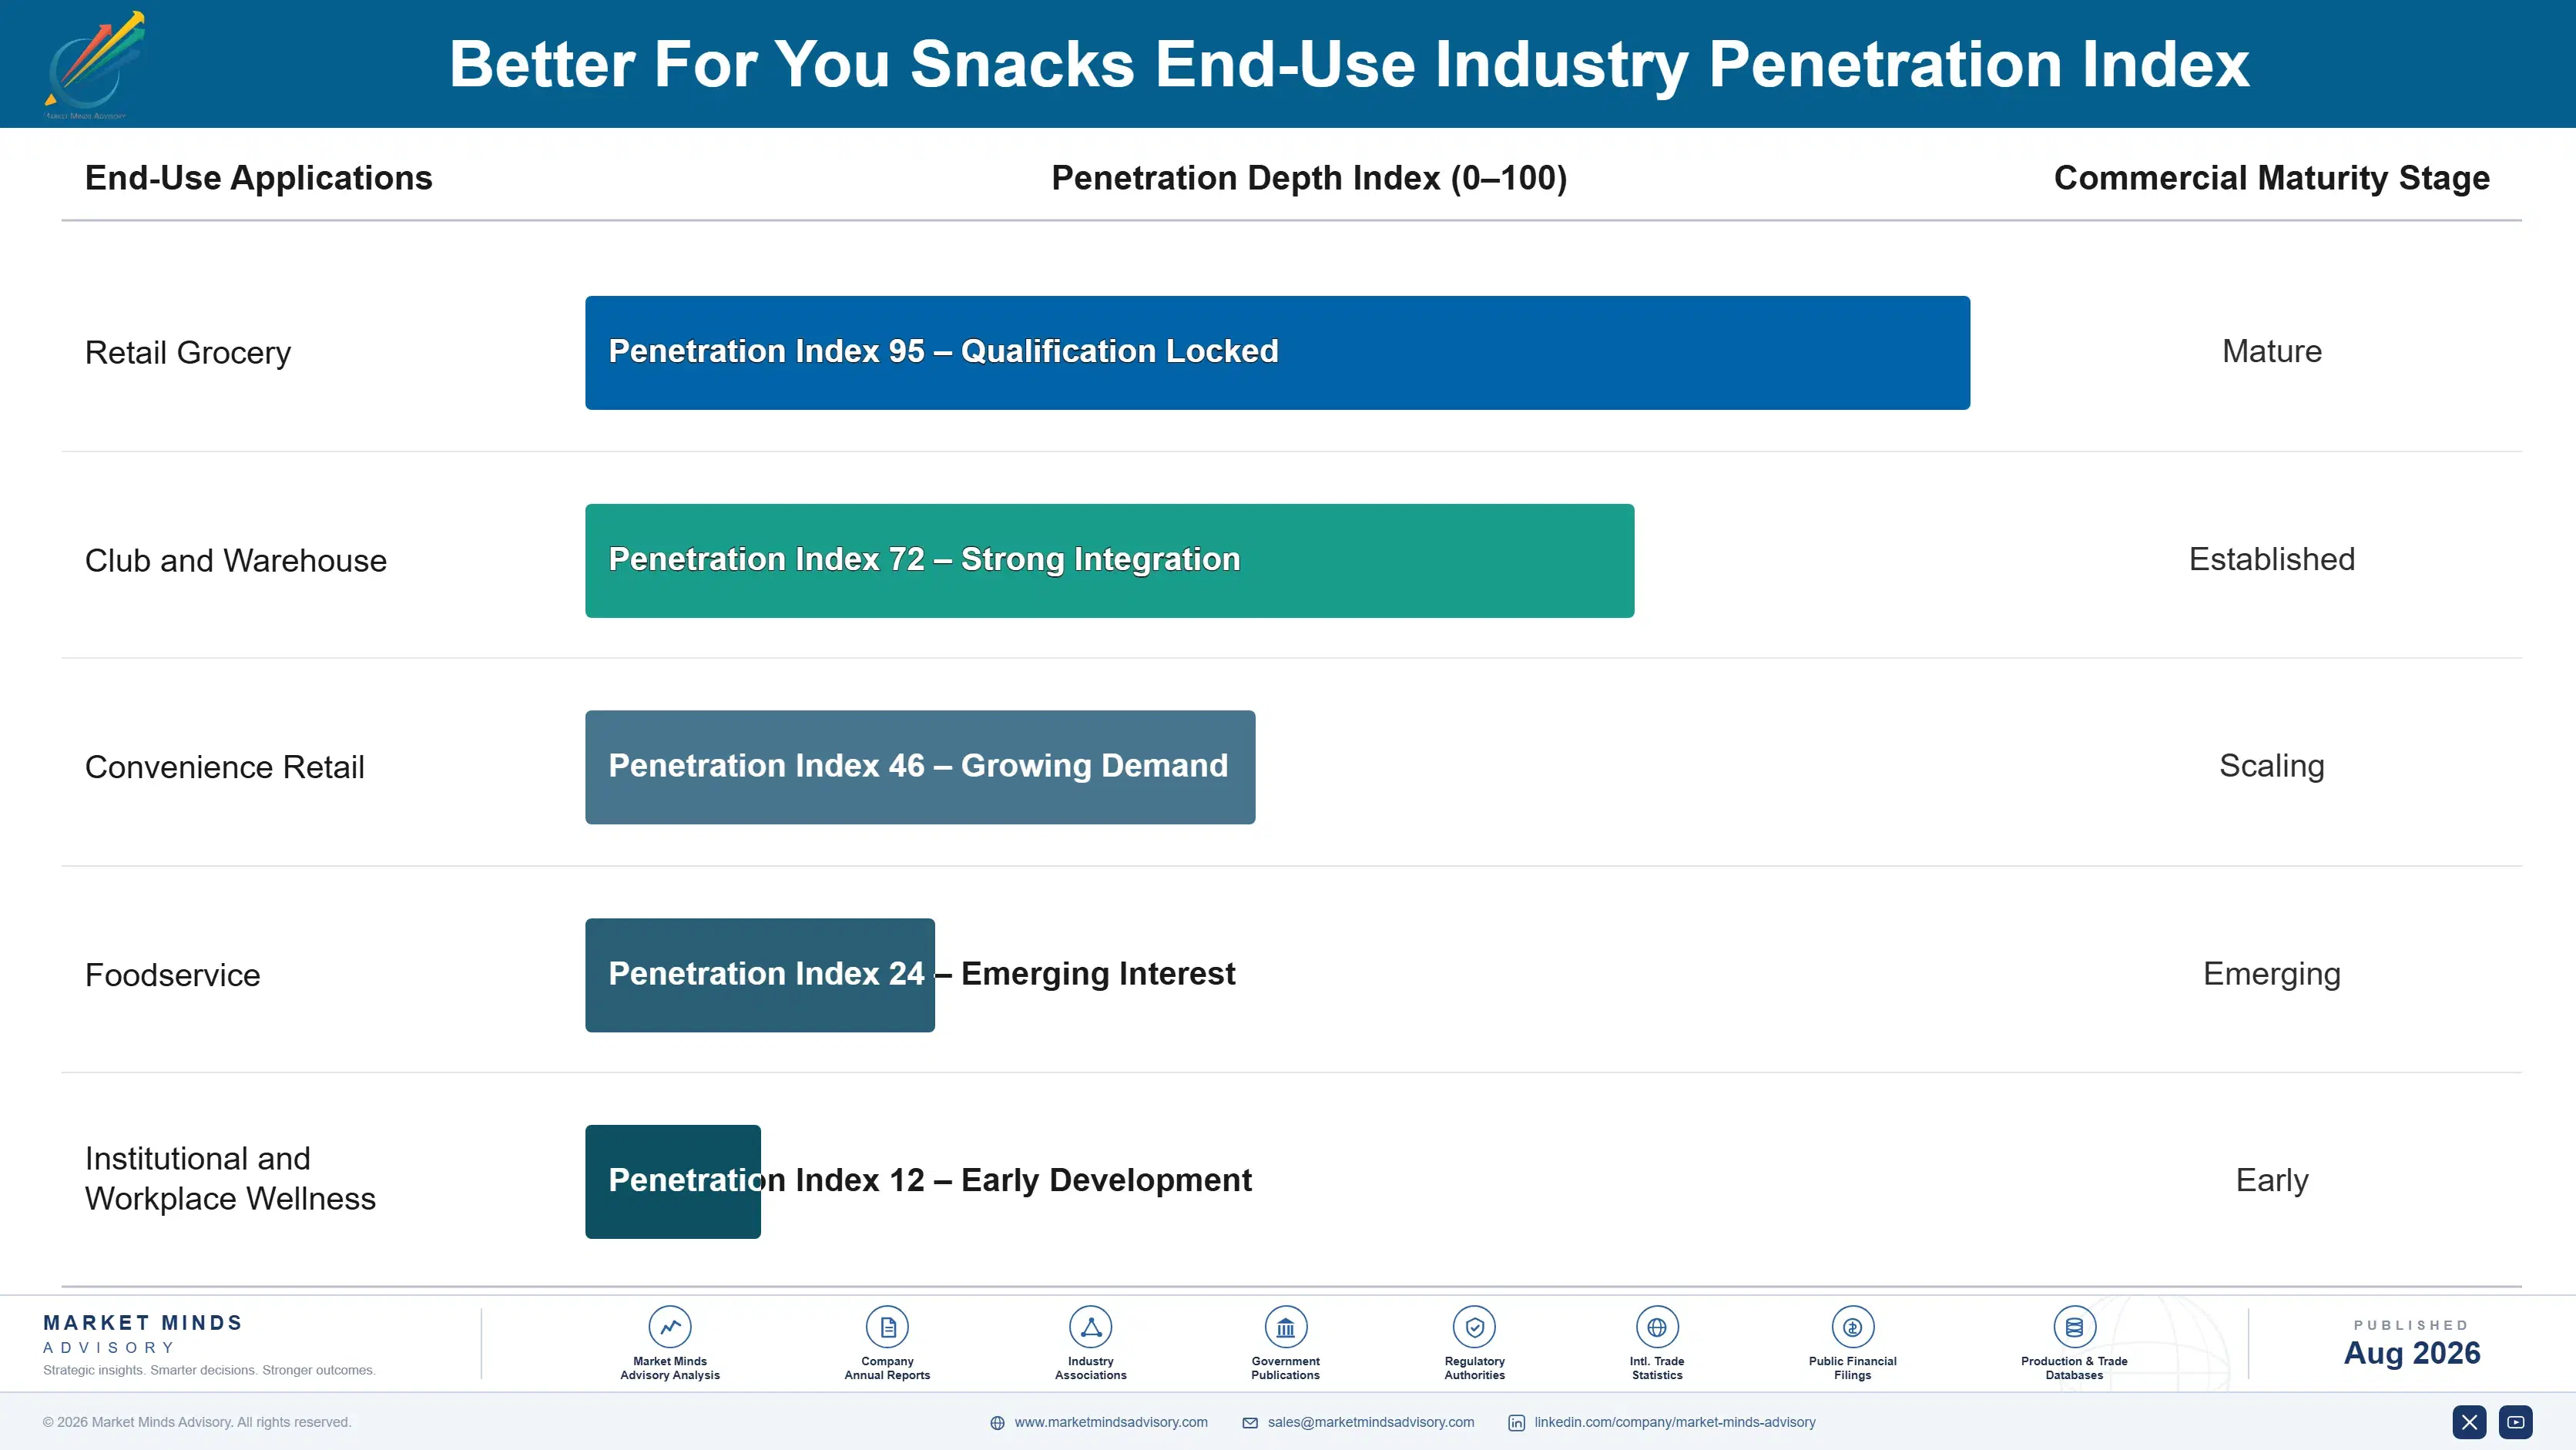
Adoption depth varies considerably by end use vertical: institutional and workplace wellness channels show the deepest and most consistent adoption of certified claims, retail grocery shows moderate but accelerating adoption tied directly to shelf reset cycles, and foodservice remains the shallowest adopter, still treating better for you positioning as an occasional menu feature rather than a core reformulation commitment. Retail grocery adoption is accelerating quickly as more chains adopt formal reformulation scorecards.

Younger buyers entering the category increasingly expect functional claims as a baseline rather than a premium differentiator, a generational shift that is compressing the price premium better for you formats can command over time even as unit volume continues to expand across most retail channels globally. Manufacturers slow to adjust risk losing relevance with future grocery shoppers.
better-for-you-snacks-market-end-use-penetration-index-1787463076319

Where Reformulation Capital Should Concentrate

These are among the four positions where our research anticipates prominent divergence between winners and laggards over the coming forecast period. Each is grounded in the demand model, the regulatory perimeter, and the announced capacity pipeline.
01 / REFORMULATION CAPACITY INVESTMENT

Prioritize flexible co-manufacturing over dedicated single-SKU lines

Retailer shelf reset criteria are changing faster than dedicated production lines can adapt, making flexible, multi SKU co-manufacturing capacity the more defensible capital allocation over the next decade. Manufacturers that invested early in flexible lines have already captured incremental shelf space from slower competitors during recent reset cycles. This advantage compounds each time thresholds tighten, since flexible capacity holders respond within weeks while dedicated line operators require months of retooling across multiple product lines simultaneously, a gap that is unlikely to close given current capital allocation patterns.
02 / THIRD-PARTY CERTIFICATION STRATEGY

Pursue third party verification before expanding self-declared claims

Shopper skepticism toward front of pack claims has grown alongside reformulation marketing volume, making third party certification a more durable pricing advantage than additional self declared claims. Certification costs remain modest relative to the 8 to 12 percent price premium it typically supports at retail. Brands delaying certification investment risk losing planogram placement to certified competitors as retailers formalize certification preferences into supplier scorecards used at every annual shelf reset negotiation, a shift that is already reshaping which brands retain premium shelf placement across major grocery chains.
03 / INSTITUTIONAL CHANNEL DIVERSIFICATION

Build institutional wellness channel relationships now, not later

The institutional and workplace wellness channel remains small but is growing faster than any other single distribution channel in the category, and early relationships with self insured employers and health plans are proving difficult for later entrants to displace once established. Manufacturers with existing quality systems built for retail distribution can enter this channel with minimal incremental investment. Waiting until the channel matures further will mean competing for shelf space against incumbents with established institutional purchasing relationships that took years to build.
04 / INPUT SUPPLY SECURITY

Secure multi-year protein offtake before the next volatility cycle

Pea and faba protein pricing has already demonstrated its volatility potential once this decade, and processing capacity additions continue to lag reformulation demand growth in most years. Manufacturers without secured offtake agreements remain exposed to the next spot market spike, a disadvantage that is increasingly steering acquisition activity toward brands lacking input contracts. Securing multi year agreements now, while capacity additions are underway, costs less than waiting for the next demand surge and risking another round of margin compressing spot purchases.

Engagement Snapshot From the Field

A live engagement with an industry participant carrying material or product regulatory and market exposure ahead of a defining policy shift, showing how our research translates into a defensible multi-year portfolio strategy.
MARKET MINDS ADVISORY · CLIENT ENGAGEMENT SUMMARY
Better For You Snacks Producer Strategic Portfolio Review and Transition Roadmap 2026·Investment Scenario on Better For You Snacks Exposure Evaluation 2025-26
CLIENT PROFILE
The client is a mid sized North American snack manufacturer generating approximately 480 million dollars in annual revenue (client-reported, unverified by MMA), with a portfolio concentrated in conventional baked and fried salty snacks sold primarily through grocery and club retail channels across the United States and Canada, facing increasing pressure from retailer sugar and sodium scorecards.
STRATEGIC CHALLENGE
Facing delisting risk on roughly a third of its SKU portfolio at the next shelf reset cycle, the client needed to prioritize reformulation investment across a large product line without sufficient internal capacity to reformulate every affected SKU simultaneously, while protecting existing retailer relationships and shelf space during the transition period.
MMA APPROACH
MMA conducted a SKU level reformulation feasibility assessment combining retailer scorecard analysis, ingredient substitution cost modeling, and consumer taste panel data to rank affected SKUs by reformulation urgency and commercial viability, then developed a phased three year reformulation roadmap aligned to the client's existing co-manufacturing capacity constraints, and prioritized by projected margin impact and implementation speed.
KEY FINDINGS
  1. Roughly 60 percent of at-risk SKUs could be reformulated using staged sugar reduction without material taste penalty within eighteen months, based on internal taste panel results.
  2. Legume flour puffed formats offered the fastest path to combined protein and fiber claims at the lowest incremental input cost, relative to other reformulation options tested.
  3. Existing co-manufacturing capacity could support flexible reformulation for only 40 percent of the affected portfolio without new capital investment, over the eighteen month planning window.
  4. Institutional wellness channel entry was feasible within twelve months using existing quality certifications already held by the client, without requiring additional regulatory approval steps.
CLIENT PROFILE
The client is a mid sized North American snack manufacturer generating approximately 480 million dollars in annual revenue (client-reported, unverified by MMA), with a portfolio concentrated in conventional baked and fried salty snacks sold primarily through grocery and club retail channels across the United States and Canada, facing increasing pressure from retailer sugar and sodium scorecards.
STRATEGIC CHALLENGE
Facing delisting risk on roughly a third of its SKU portfolio at the next shelf reset cycle, the client needed to prioritize reformulation investment across a large product line without sufficient internal capacity to reformulate every affected SKU simultaneously, while protecting existing retailer relationships and shelf space during the transition period.
MMA APPROACH
MMA conducted a SKU level reformulation feasibility assessment combining retailer scorecard analysis, ingredient substitution cost modeling, and consumer taste panel data to rank affected SKUs by reformulation urgency and commercial viability, then developed a phased three year reformulation roadmap aligned to the client's existing co-manufacturing capacity constraints, and prioritized by projected margin impact and implementation speed.
KEY FINDINGS
  1. Roughly 60 percent of at-risk SKUs could be reformulated using staged sugar reduction without material taste penalty within eighteen months, based on internal taste panel results.
  2. Legume flour puffed formats offered the fastest path to combined protein and fiber claims at the lowest incremental input cost, relative to other reformulation options tested.
  3. Existing co-manufacturing capacity could support flexible reformulation for only 40 percent of the affected portfolio without new capital investment, over the eighteen month planning window.
  4. Institutional wellness channel entry was feasible within twelve months using existing quality certifications already held by the client, without requiring additional regulatory approval steps.
RECOMMENDED STRATEGY
Phase 1: Phase 1 (Months 1 to 6): Reformulate highest-risk, highest-volume SKUs using staged sugar reduction and secure interim protein supply contracts. Phase 2: Phase 2 (Months 7 to 18): Expand flexible co-manufacturing capacity and launch legume-based puffed platform with third-party certification, to defend at-risk shelf placements. Phase 3: Phase 3 (Months 19 to 36): Enter institutional wellness channel and reformulate remaining legacy SKUs or plan managed volume decline.
OUTCOME
Within eighteen months of implementation, the client reported retaining 92 percent of at-risk shelf space through the following retailer reset cycle and achieving a 9 percent increase in blended category margin, driven primarily by certified claim premiums on newly reformulated legume based puffed products (client-reported, unverified by MMA).

Frequently Asked Questions

Foundational context covering the market sizes, CAGR, scope, country, region and competition that inform every finding below. This section is provided to cover basics and most often pre-purchase conversations, answered from the MMA Primary Research Dataset.

What is the current size of the Better For You Snacks Market?

The Better For You Snacks Market is valued at approximately 38.5 billion dollars in 2025, reflecting rapid growth in reformulated bars, chips, and puffed formats across major retail channels worldwide.

How large will the Better For You Snacks Market be by 2036?

The market is projected to reach roughly 86.19 billion dollars by 2036, driven by continued retailer reformulation mandates and expanding certified claim adoption across global retail channels.

What is the CAGR for the Better For You Snacks Market 2026 to 2036?

The market is expected to grow at a compound annual growth rate of approximately 7.6 percent between 2026 and 2036, supported by ongoing reformulation and premiumization trends.

Which segment is growing fastest?

Protein and fiber fortified bars are the fastest growing segment, expanding at roughly 1.5 times the overall market rate as fortification credibility remains strongest in the bar format.

Who are the major companies in the Better For You Snacks Market?

Leading companies include PepsiCo, Mondelez International, General Mills, Kellanova, and Hain Celestial, each expanding reformulated and certified claim portfolios across major retail channels, in both developed and emerging markets.

Which country is growing fastest?

India is the fastest growing single country, as urban middle class income growth and modern trade retail expansion drive rapid adoption of branded, portion controlled better for you snacking.

Report Segmentation Architecture

The full report scope spans multiple orthogonal segmentation dimensions, with cross-tabulated demand data provided for each dimension pair. Coverage extends further to regional breakdowns, trend trajectories, and the competitive detail needed to support segment-level decision-making.

By Product Format

  • Fortified Bars
  • Baked and Puffed Salty Snacks
  • Fried Chips
  • Popped and Extruded Snacks
  • Snack Mixes and Trail Mixes
  • Other Formats

By End-Use Industry

  • Retail Grocery
  • Club and Warehouse
  • Convenience Retail
  • Foodservice
  • Institutional and Workplace Wellness

By Commercial Dimension

  • Branded Manufacturer
  • Private Label
  • Direct-to-Consumer
  • Specialty and Natural Retail

By Region

  • North America
  • Western Europe
  • East Asia
  • South Asia and Pacific
  • Latin America
  • Middle East and Africa
  • Eastern Europe

Scope, Methodology, and Coverage

Every figure in this report is reproducible from documented input assumptions. The scope below maps the historical period, the forecast horizon, the segmentation dimensions, and the countries covered, alongside the underlying primary and qualitative methodology.
Historical Period
2020 to 2025
Forecast Period
2026 to 2036
Base Year
2025 (USD billions; MMA Primary Research Dataset, August 2026)
Market Definition
The better for you snacks market covers packaged savory and sweet snack formats reformulated or engineered around reduced sugar, reduced sodium, added protein, added fiber, or clean label positioning, sold through retail, club, and foodservice channels. It excludes unmodified conventional snack SKUs carrying no functional or reformulation claim and excludes meal replacement shakes and standalone dietary supplement tablets.
Quantitative Units
USD billions (current prices); metric tons for select volume metrics
Segmentation Dimensions
By Product Format; By End-Use Industry; By Commercial Dimension; By Region
Regions Covered
North America, Western Europe, East Asia, South Asia and Pacific, Latin America, Middle East and Africa, Eastern Europe
Countries Covered
USA, China, Germany, France, UK, Japan, South Korea, India, Australia, Canada, Brazil, Mexico, Indonesia, Vietnam, Thailand, Malaysia, UAE, Saudi Arabia, South Africa, Nigeria, Turkey, Poland, Netherlands, Italy, Spain, Sweden, Switzerland, Argentina, Colombia, Singapore, and additional markets relevant to this sector
Key Companies Profiled
PepsiCo, Mondelez International, General Mills, Kellanova, Hain Celestial, Mars Incorporated, Hormel Foods, Simply Good Foods, KIND LLC, Clif Bar and Company, Utz Brands, Conagra Brands, The Kraft Heinz Company, Amy's Kitchen, Beyond Meat, Britannia Industries, Haldiram's, Calbee Inc, Nongshim Co Ltd, Ajinomoto Co Inc
Quantitative Methodology
Primary survey, n=3,800 respondents, Q4 2025, six countries; demand-side model with trade association cross-validation
Qualitative Methodology
47 expert interviews, Q4 2025; applied to validate demand model assumptions, identify emerging dynamics, and assess competitive positioning
Report Format
PDF and XLSX data workbook (Word format preview document)
Publisher
Market Minds Advisory
Report Code
MMA-2026-AGR-201
Published
August 2026
Contact
sales@marketmindsadvisory.com | www.marketmindsadvisory.com

Purchase the full Better For You Snacks Market Report (2026 to 2036).

The full report delivers a complete quantitative and qualitative assessment of the better for you snacks market, including detailed segment level forecasts through 2036, regional analyses across all seven covered geographies, and profiles of twenty leading manufacturers. It incorporates primary survey data from 3,800 respondents and 47 expert interviews conducted in the fourth quarter of 2025. Buyers receive editable data tables, a customizable Excel forecast model, and access to MMA analysts for follow up questions during a defined post purchase support window. The report also includes competitive benchmarking and input cost sensitivity analysis for category planning purposes.
Detailed segment-level forecasts through the year 2036
All seven regional market analyses included
Twenty profiled leading category manufacturers overall
Editable Excel based forecast data model
Primary survey and expert interview data
Extended post-purchase analyst support access included

Built For The People Who Decide

From boardroom strategy to bench-side execution, this report is read cover-to-cover by leaders shaping the next decade of their industry, turning demand scenarios, market dynamics and valuation benchmarks into decisions.
CXOs/ Presidents/ VPs/ Managers
M&A and Corporate Development
Strategy Teams and R&D Heads
Procurement and Product Directors
Regulatory and Compliance Leaders
Investor Relations and Equity Analysts