
Market Minds Advisory
Anhydrous Hydrogen Fluoride Market

Anhydrous Hydrogen Fluoride Market: One Mineral, Two Countries, Everybody Downstream

A commercial reading of the fluorine chain's first link, where every fluoropolymer, battery salt, and etchant traces back to acid grade fluorspar that two countries substantially control, and no substitute route exists.

Lead Analyst

Bilal Shaikh

Published

September 2026

Make Smarter Decisions with Customized Research Insights

Request a free sample report and evaluate market opportunities, growth trends, and competitive dynamics relevant to your business needs.

2025 MARKET VALUE$3.6BMarket Size 2025
2036 FORECAST VALUE$7.6BBase Case , 2026 to 2036
CAGR 2026 TO 20367.0 %Bull 8.2% / Bear 5.8%
INCREMENTAL OPPORTUNITY$3.7BNet 10- year value creation
EXPANSION MULTIPLE1.97x2036 value over 2026 base
Strategic Levers
M&A Pipeline
Regional Outlook
Country Rankings
Competitive Intelligence
Segmental Deep-dive
Call-Us : 91 93563 13602

Executive Snapshot and Market Trajectory

Nothing containing fluorine exists without this molecule. Refrigerants, fluoropolymers, battery electrolyte salts, semiconductor etchants, and uranium enrichment all start here, and the whole chain rests on acid grade fluorspar that China and Mexico substantially control. No substitute route exists for any single part of it.
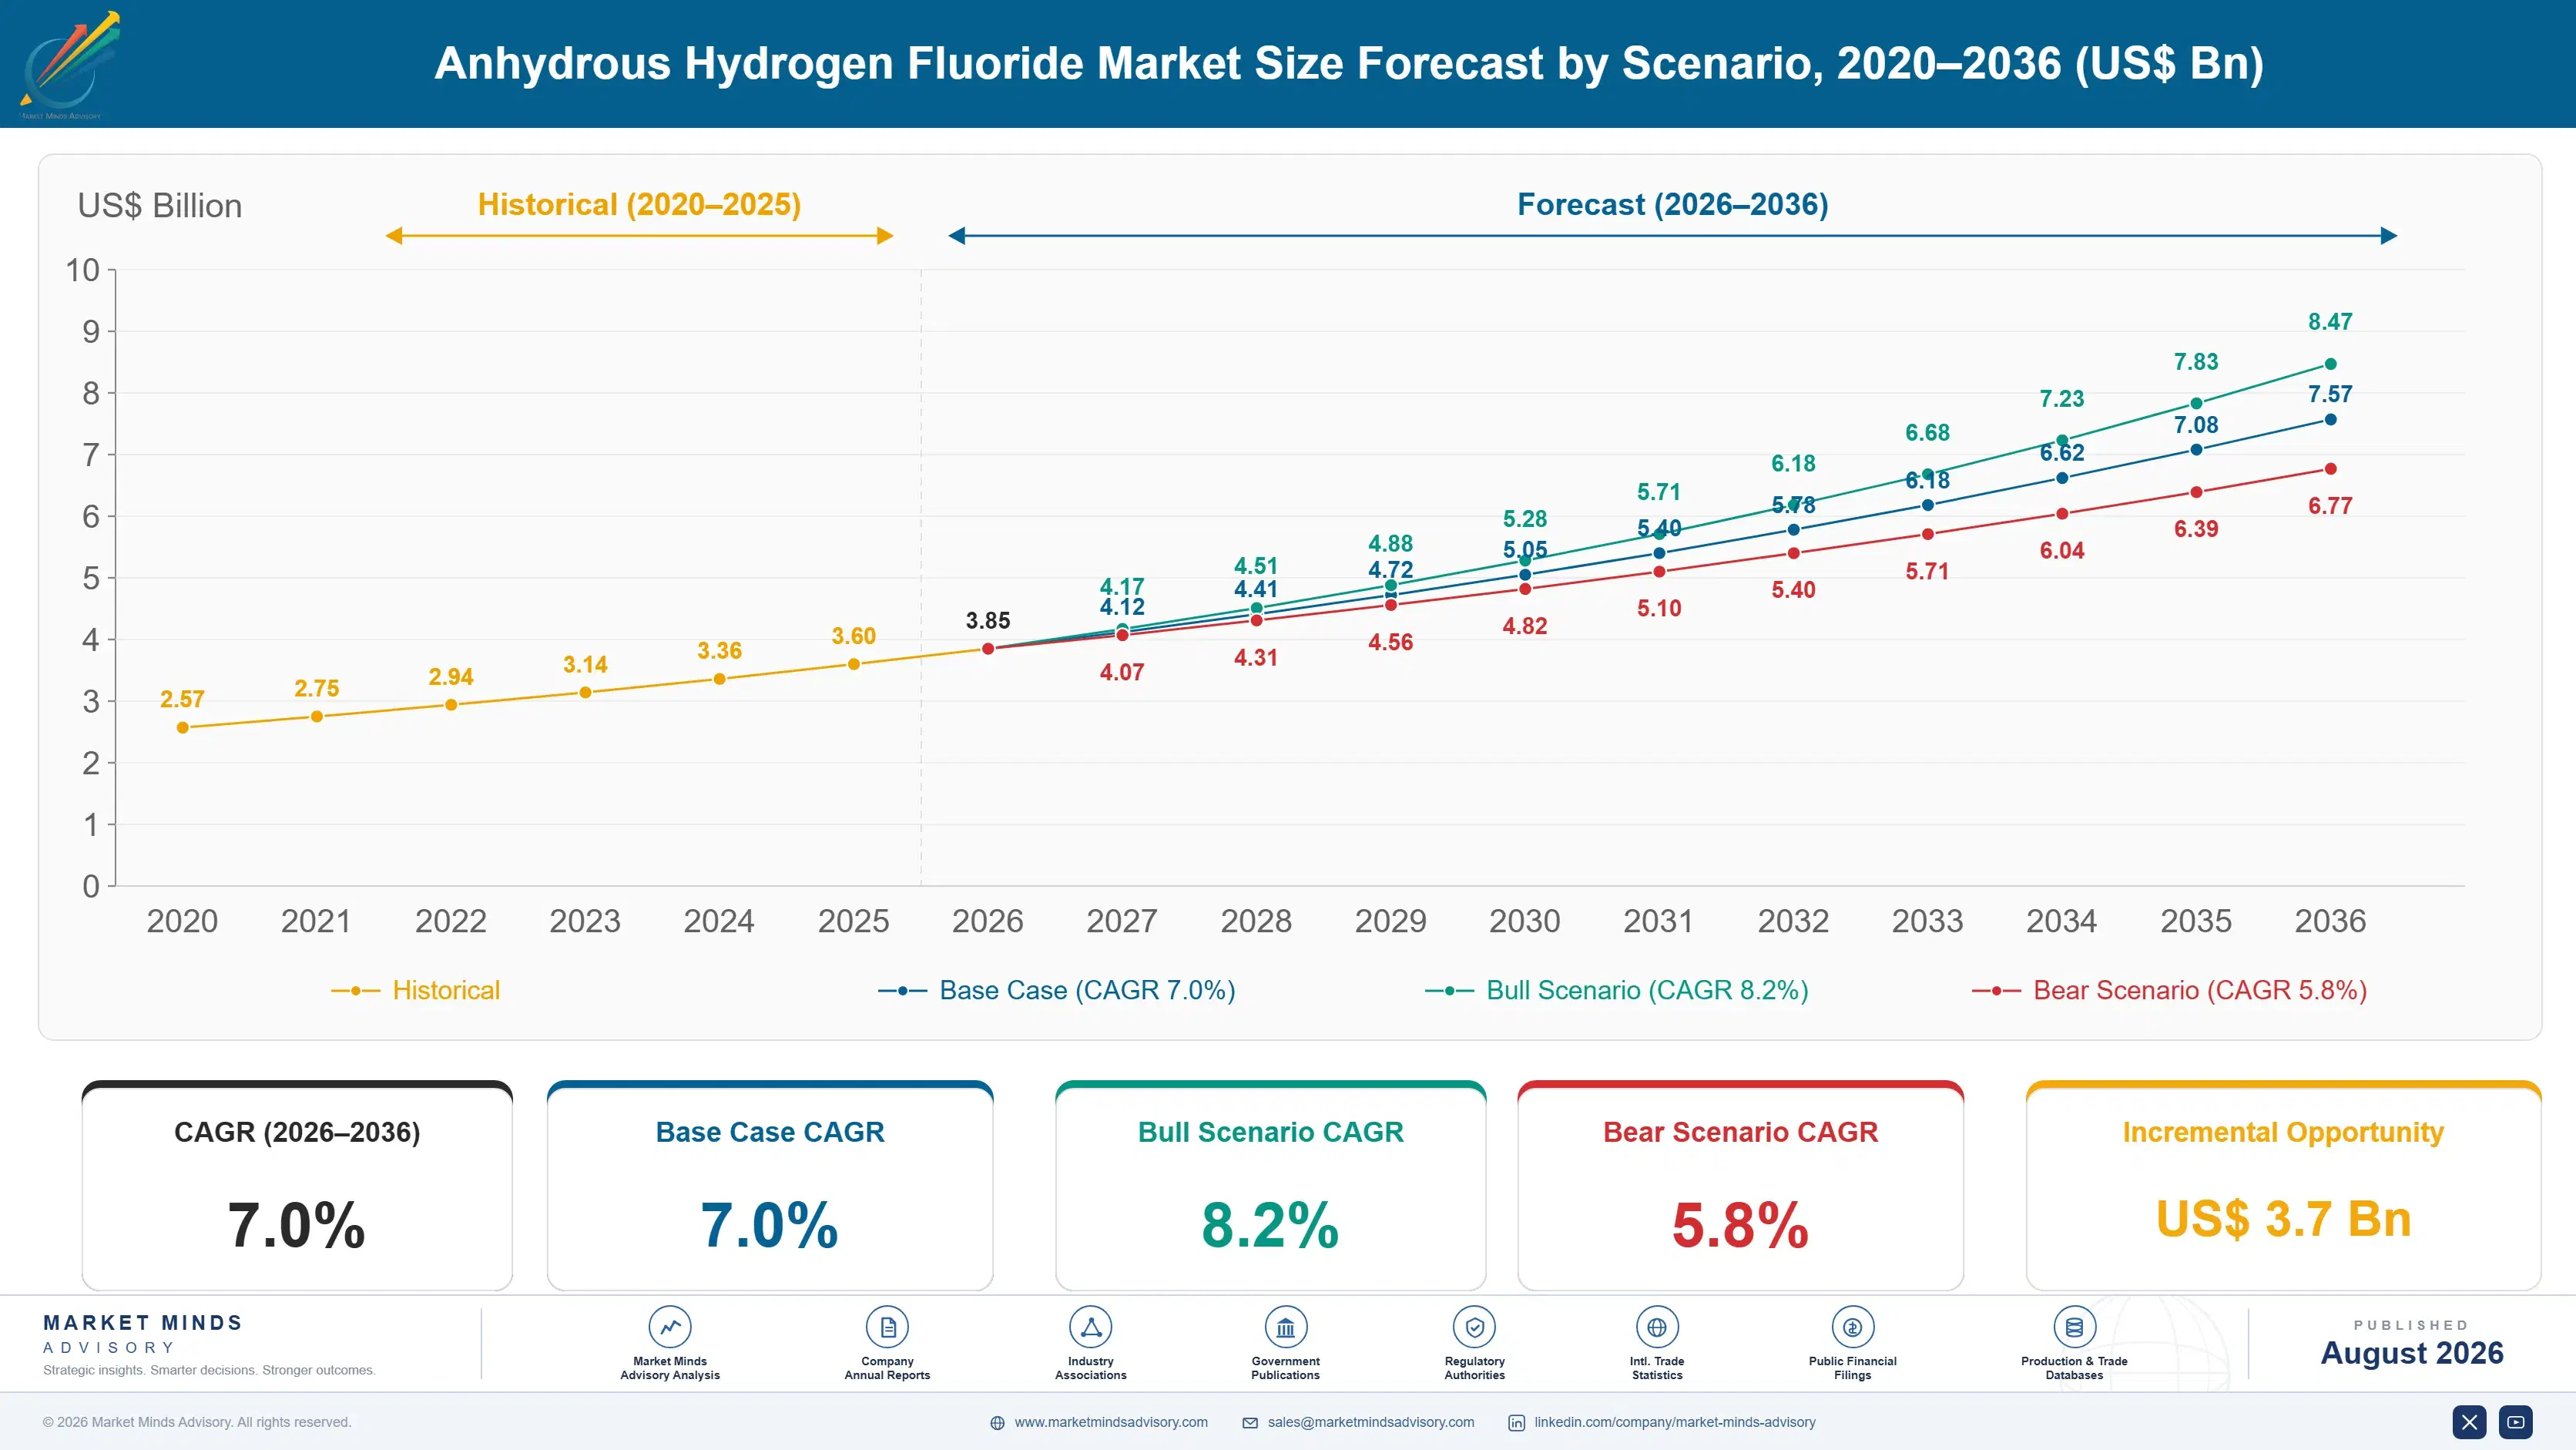
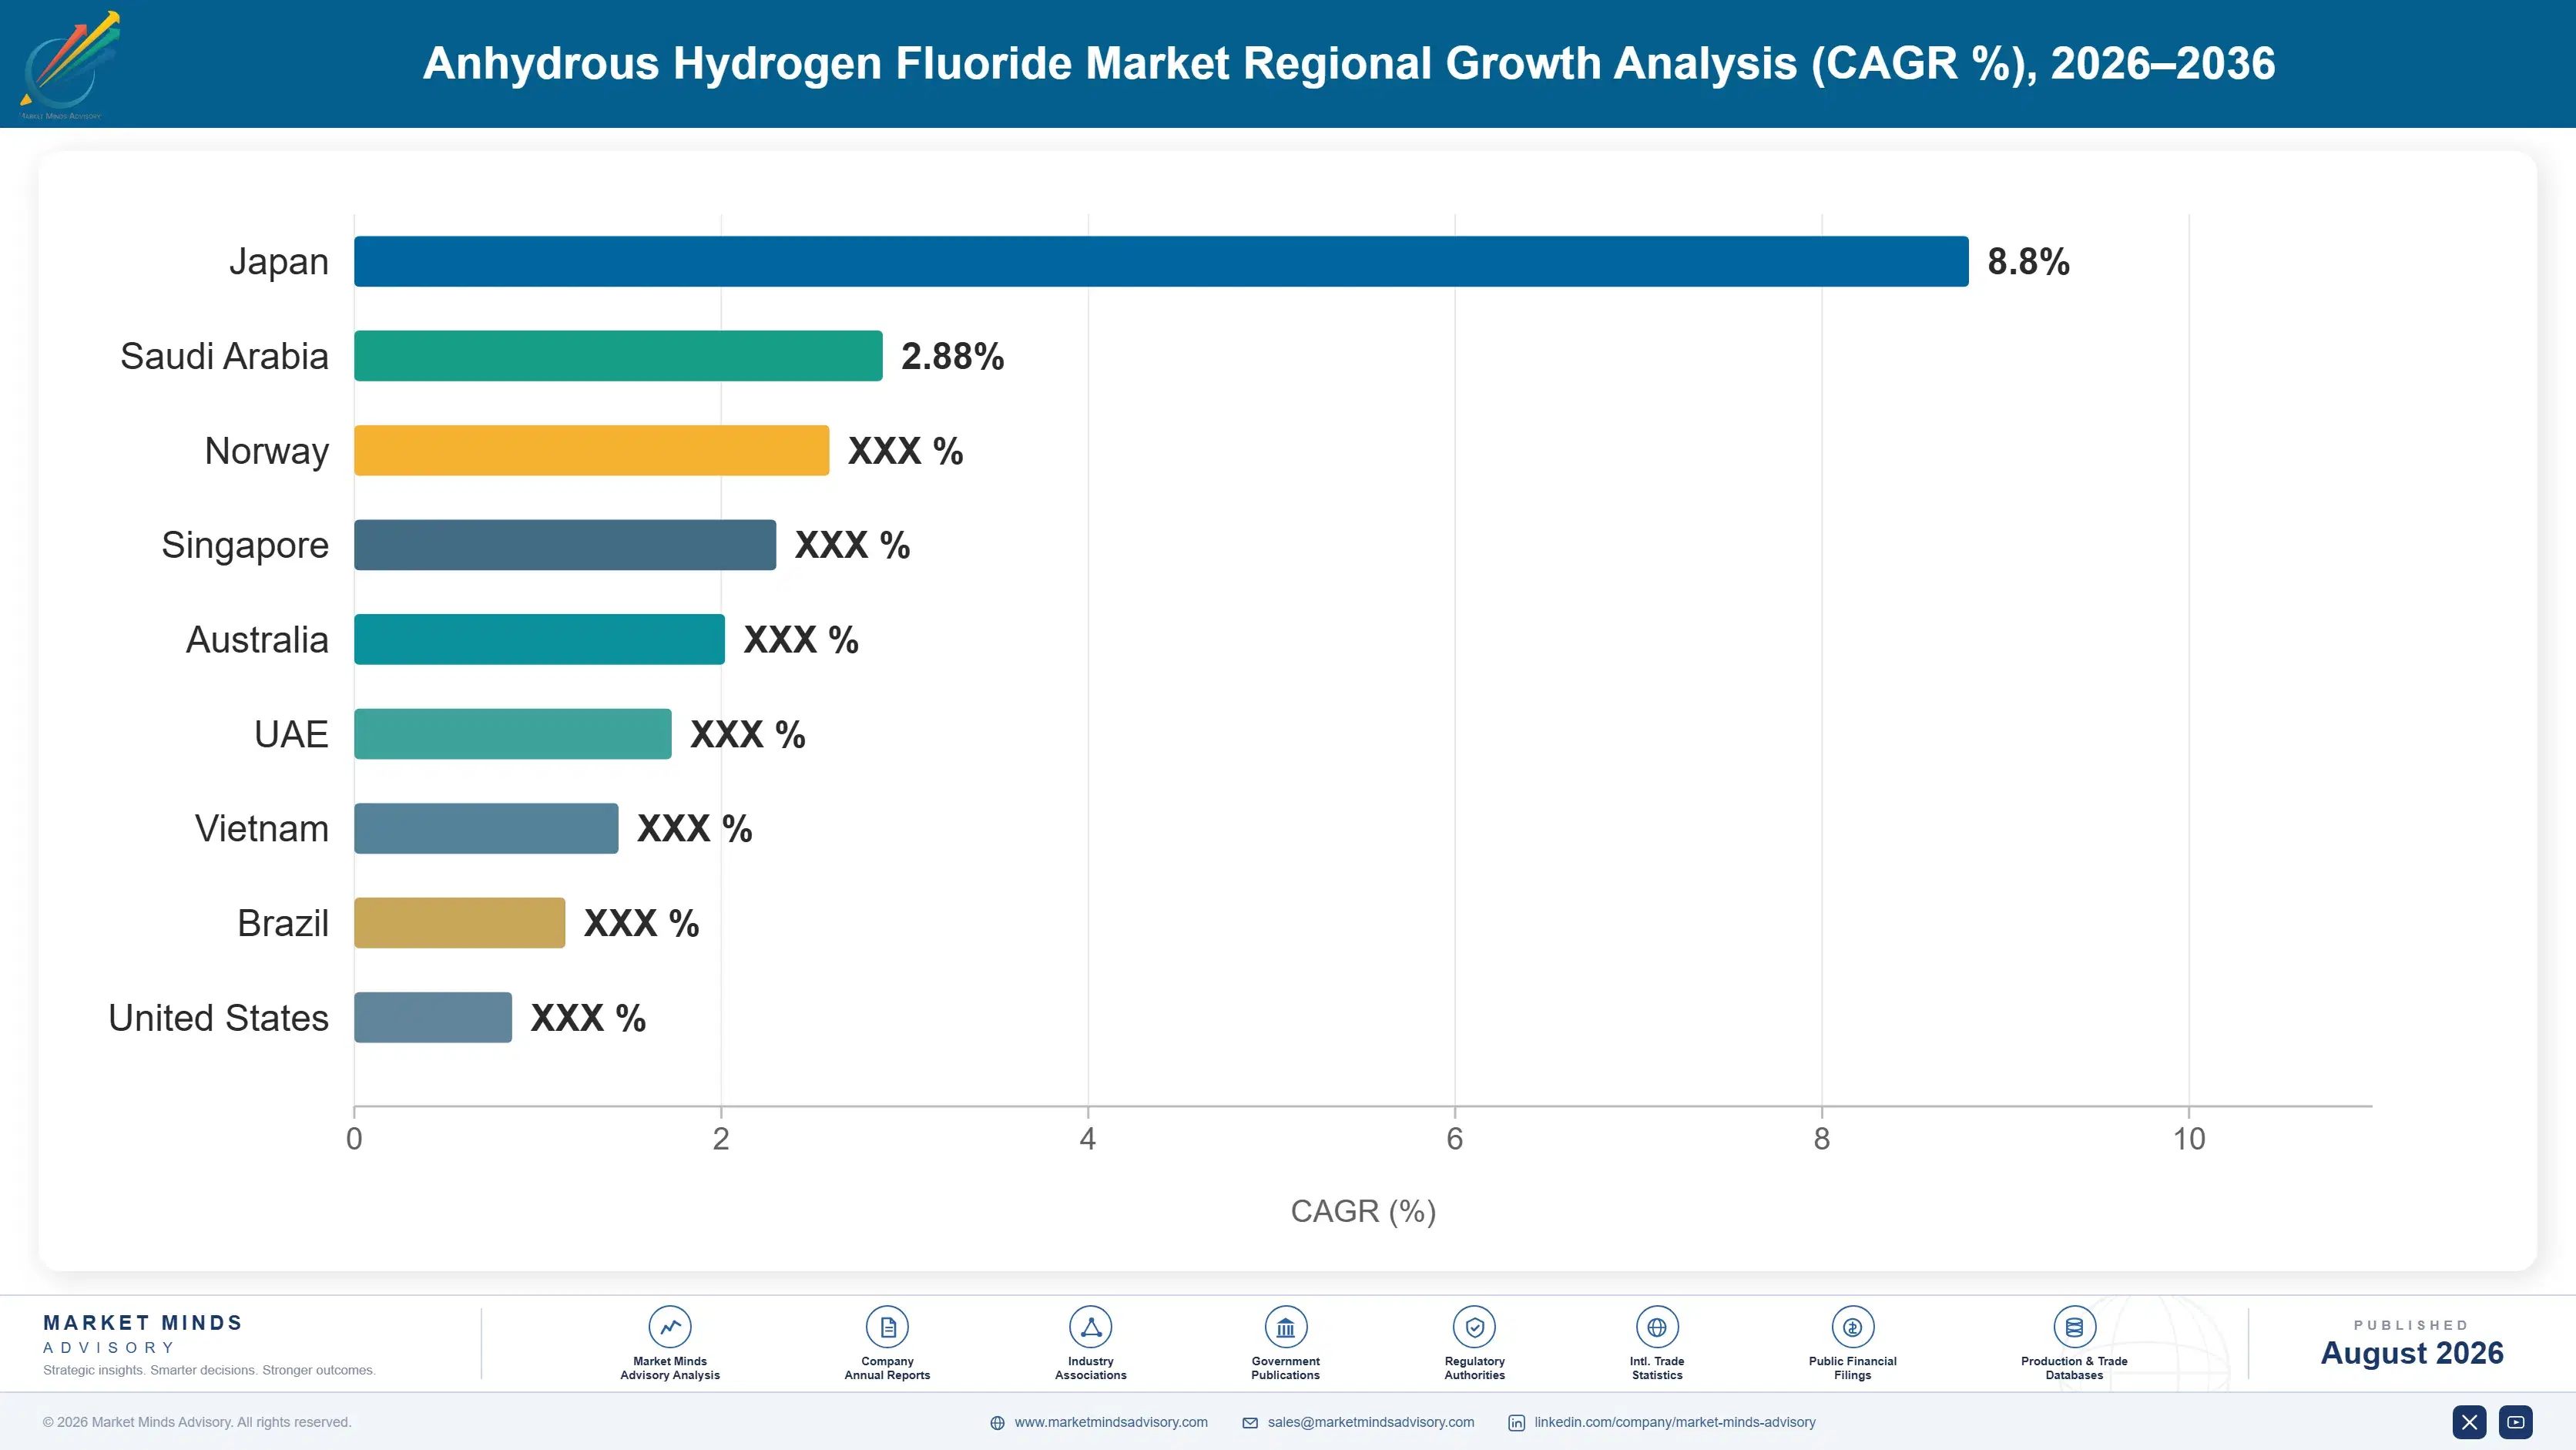
The market stands at USD 3.6 billion in 2025 and reaches USD 7.57 billion by 2036 at a 7.0% CAGR. Electronic grade hydrogen fluoride grows fastest at 12.4%, about 1.77 times the overall rate, as semiconductor fabrication capacity expands and purity requirements tighten toward parts per trillion. East Asia holds 30% of value on fluorochemical and electronics capacity, while India posts the quickest national growth at 10.6%.
Concentration is high, with the top five holding roughly 54% of hydrogen fluoride revenue because the chemistry is hazardous, capital intensive, and permitted with difficulty. Two forces pull against each other. Battery and semiconductor demand keeps pulling volume toward higher purity grades, while fluorspar supply concentration and tightening handling regulation both make capacity harder to add wherever the demand actually is. Capacity cannot follow that demand quickly enough to relieve either of them.
Market Definition
The anhydrous hydrogen fluoride market covers the production and merchant sale of water-free hydrogen fluoride, spanning technical grade for fluorochemical synthesis, electronic grade for semiconductor and display manufacturing, battery grade for electrolyte salt production, aluminium fluoride and metallurgical grade supply, and nuclear grade for uranium conversion. Aqueous hydrofluoric acid solutions, downstream fluorochemical products including refrigerants and fluoropolymers, fluorspar mining and beneficiation, calcium fluoride and other fluoride minerals, and etching, cleaning, and processing services are excluded.
Base Year Value
$3.6B in 2025 (MMA Primary Research Dataset, August 2026)
Forecast Period
2026 to 2036, eleven discrete annual values
CAGR
7.0% base case. Bull 8.2%. Bear 5.8%.
Fastest Growth Segment
Electronic Grade Hydrogen Fluoride: 12.4% CAGR
Fastest Growth Country
India: 10.6% CAGR
Fastest Growth Region
South Asia and Pacific: 9.0% CAGR
Largest Region
East Asia: 30% of 2025 global value
Market Leaders
Honeywell, Solvay, Daikin Industries, Stella Chemifa, Do-Fluoride New Materials. Source: MMA Analysis based on company annual reports.
Primary Survey
n=3,800 procurement and R&D decision-makers, Q4 2025, six countries
Methodology
Demand-side build-up, cross-validated against public data, 47 expert interviews

Anhydrous Hydrogen Fluoride Market Forecast Scenarios

anhydrous-hydrogen-fluoride-market-size-forecast-scenario-1787331964490
Growth from 2020 to 2025 compounded near 5.9%, and one export decision reshaped the whole period. Japanese restrictions on electronic grade supply to Korea in 2019 sent Korean manufacturers into an urgent localisation programme that permanently changed who supplies semiconductor fluorine chemistry. Refrigerant demand meanwhile fell under phase-down schedules while battery electrolyte demand rose from almost nothing. The molecule stayed the same while its end markets rearranged entirely.
Three mechanisms carry the base case to 7.0%. First, semiconductor and display fabrication, which consumes electronic grade material at purity levels that only a handful of producers can reach. Second, lithium battery electrolyte salts, where hexafluorophosphate production draws hydrogen fluoride in volumes that barely existed a decade ago. Third, fluoropolymer demand across chemical processing, wire and cable, and hydrogen equipment, which grows steadily regardless of the refrigerant phase-down running underneath it.
The bull case at 8.2% assumes battery and semiconductor capacity build out on announced timetables and fluoropolymer demand holds through the fluorochemical restrictions being debated. The bear case at 5.8% assumes refrigerant phase-down bites harder than expected, per- and polyfluoroalkyl substance regulation extends to fluoropolymer production in ways that curtail demand, and fluorspar supply constraints cap what anybody can produce.

The Chain Starts With A Mineral Two Countries Hold

Demand rests on three foundations. Fluoropolymer and fluorochemical synthesis provides the base volume, since every fluorine-containing product traces back to this molecule without exception. Electronics and battery purity requirements provide the value, because a grade measured in parts per trillion sells for multiples of technical material. And fluorspar supply sets the ceiling, since roughly 72% of acid grade mineral output comes from two countries and no substitute feedstock exists at scale.
MARKET CONCENTRATIONCR5: 54%Concentrated because hazardous chemistry is permitted only with difficulty
FLUORSPAR SUPPLY CONCENTRATIONAbout 72%Acid grade mineral output from the two leading producing countries
FLUORSPAR COST SHAREAbout 47%Mineral input as a portion of hydrogen fluoride production cost
ELECTRONIC GRADE PURITYParts per trillionMetallic contamination limit for advanced semiconductor node use
PLANT PERMITTING TIMELINE4 to 7 yearsPeriod from investment decision to operating hydrogen fluoride capacity
CAPACITY UTILISATIONAbout 81%Running rate across merchant hydrogen fluoride production assets
Commercially the defining feature is how hard capacity is to add. Permitting a hydrogen fluoride plant takes four to seven years because the material is acutely toxic, corrodes almost everything, and requires containment and emergency planning that communities resist. Utilisation near 81% therefore understates how tight the market feels, since the marginal tonne cannot simply be ordered from somewhere else when a customer needs it.
The next decade turns on purity and policy together. Electronic grade at 12.4% growth is where value concentrates, and the 2019 export restriction taught every semiconductor manufacturer that supply geography is a strategic exposure rather than a procurement detail. Against that, per- and polyfluoroalkyl substance regulation is working its way toward fluoropolymer production, which would remove demand this molecule currently depends on.
"People discuss fluorspar as a critical mineral and then discuss hydrogen fluoride as a commodity chemical, which is incoherent. It is the same supply chain, it has the same two-country problem, and there is no substitute molecule waiting anywhere for anybody who runs short."
Director, Fluorine Chemicals and Specialty Intermediates Practice · MMA Chemical

Market Trends

Semiconductor Localisation Redrew Electronic Grade Supply

Japanese export restrictions on electronic grade material to Korea in 2019 demonstrated in weeks that a purity grade nobody outside the industry had heard of could halt semiconductor production. Korean manufacturers responded with an urgent localisation programme, and the qualification work that followed permanently redistributed who supplies fabrication plants. Every major semiconductor region has since treated fluorine chemistry as a strategic exposure rather than a purchasing line. Electronic grade grows at 12.4% against a market at 7.0%, and geography now matters as much as purity in that qualification. Nobody treats it as a purchasing line any more.
Market Impact: Feedstock for 8 end markets
Battery Electrolyte Salts Create Demand From Nothing

Lithium hexafluorophosphate production consumes hydrogen fluoride in volumes that scarcely existed a decade ago, and battery cell capacity additions have pulled that demand forward faster than any fluorochemical producer planned for. The purity requirement sits between technical and electronic grade, which suits producers who cannot reach semiconductor specification but want out of commodity refrigerant supply. Chinese producers hold most of this capacity because the cell manufacturing sits there. Western battery localisation programmes are now discovering that the electrolyte salt supply chain did not localise with them. Localisation policy has not yet fixed that gap.
Market Impact: Permitting takes 4 to 7 years

Market Opportunities and Growth Drivers

Every Fluorine Product Traces Back Through This Molecule

Refrigerants, fluoropolymers, agrochemical intermediates, pharmaceutical fluorination, aluminium smelting fluxes, battery salts, semiconductor etchants, and uranium conversion all require hydrogen fluoride, and there is no alternative route to any of them. That gives the molecule unusual demand breadth for a single chemical, and it means weakness in one end market is routinely offset by strength in another. Refrigerant phase-down has run alongside battery growth for five years with the total holding up. No other fluorine intermediate has that position. Demand breadth of that kind is genuinely unusual for a single intermediate chemical anywhere.
Market Impact: Two countries hold 72% supply

Permitting Difficulty Keeps New Capacity Genuinely Scarce

Hydrogen fluoride is acutely toxic, attacks glass and most metals, and requires containment, scrubbing, and community emergency planning that make permitting a four to seven year exercise wherever anybody attempts it. That difficulty is why utilisation near 81% feels tighter than the number suggests and why the top five hold roughly 54% of revenue. It also means demand growth converts into pricing rather than into capacity for years at a time, which is unusual in commodity chemistry and comfortable for incumbents. Demand growth therefore becomes pricing rather than tonnage for years at a time.
Market Impact: Proposals cover 10000 substances

Market Restraints and Challenges

Fluorspar Supply Concentrates In Two Producing Countries

Roughly 72% of acid grade fluorspar output comes from China and Mexico, mineral input is about 47% of production cost, and no alternative feedstock exists at commercial scale. The root cause is geology rather than policy: economically workable acid grade deposits are simply not distributed evenly. Commercially this leaves every producer exposed to export policy and mine output they do not influence. Participants mitigate through long-term mineral offtake agreements, fluorosilicic acid recovery from phosphate processing, spar recycling from spent acid, and inventory positions well above working levels. Geology rather than policy created this exposure.
Market Impact: Restrictions hit 3 named chemicals

Fluorochemical Regulation Now Threatens Irreplaceable Downstream Demand

Per- and polyfluoroalkyl substance restrictions have moved from consumer products toward industrial fluoropolymers, and proposals under consideration in Europe would reach production of materials that consume hydrogen fluoride in volume. The root cause is that the carbon-fluorine bond making these materials useful also makes them persistent. Commercially this puts a substantial block of demand under regulatory review rather than competitive pressure. Producers mitigate by shifting mix toward electronics and battery grades, supporting essential-use arguments for fluoropolymers, and reducing emissions from their own operations. Restriction removes this demand rather than redirecting it anywhere else.
Market Impact: Battery grade adds 40 kilotonnes
4 additional market trends, 3 additional growth drivers, and 2 additional restraints and challenges are covered in the full report. Contact sales@marketmindsadvisory.com to access the complete intelligence.

Segment CAGR and Growth Architecture

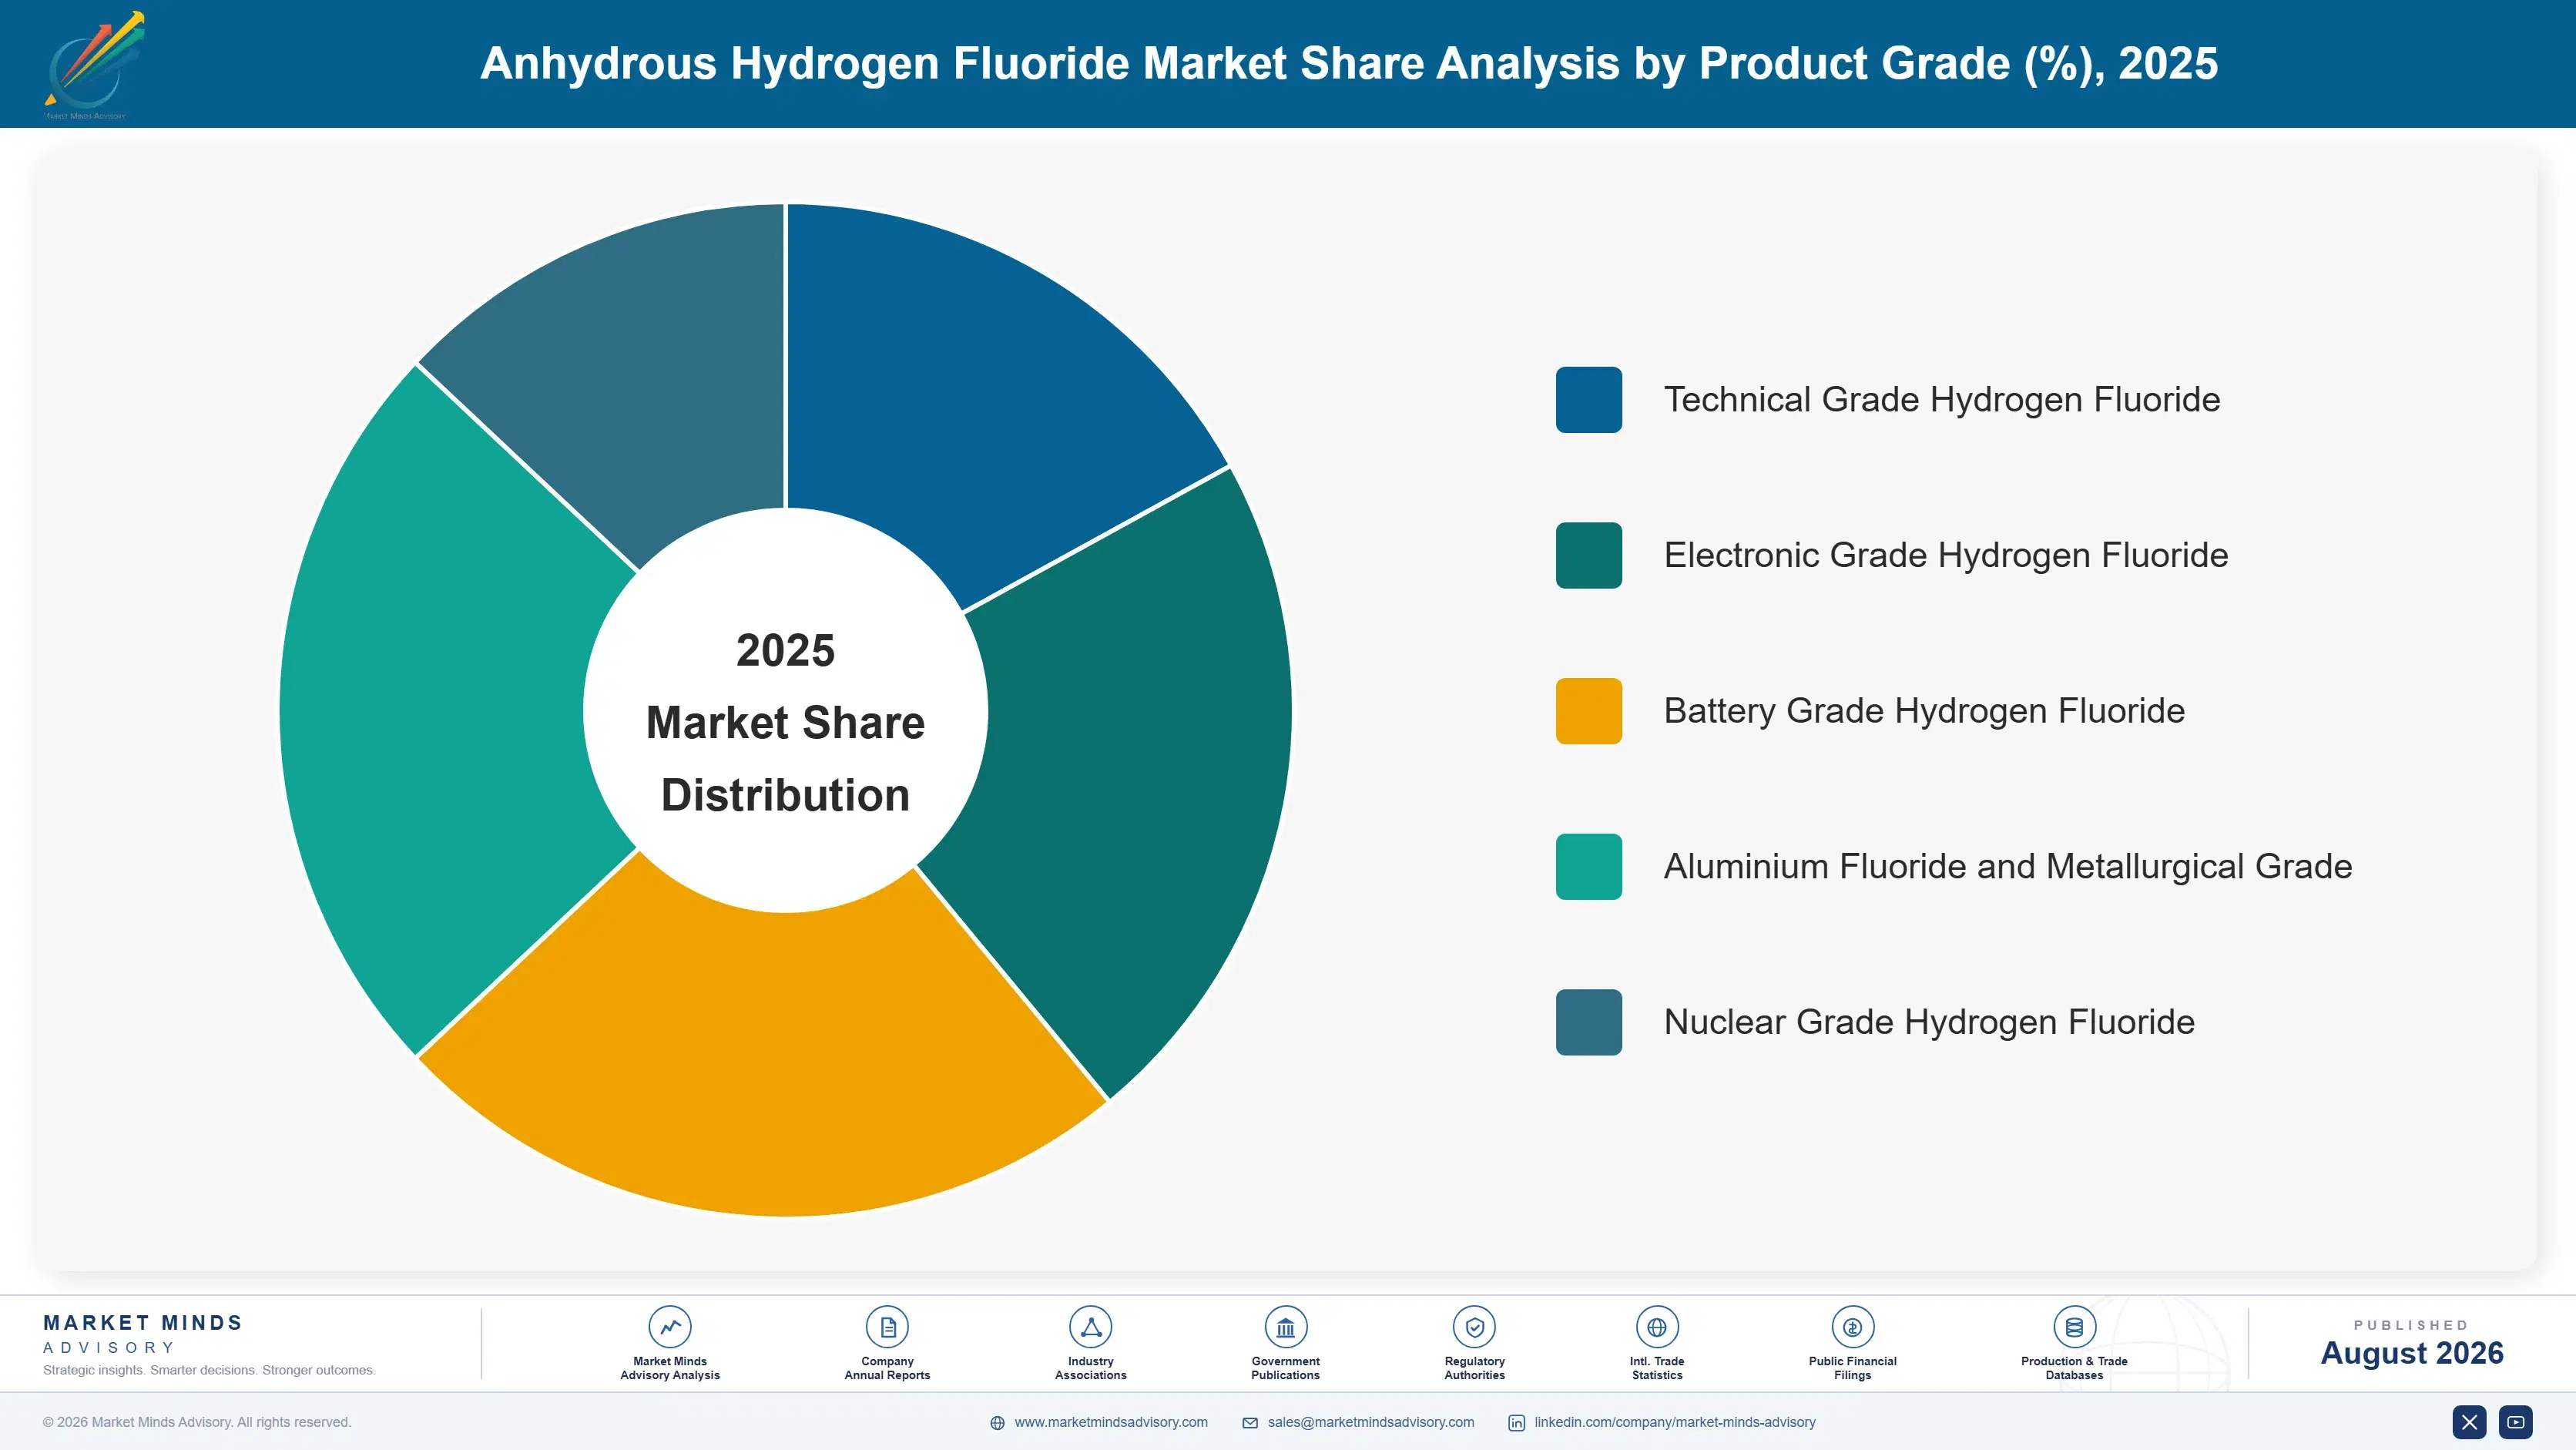
Segmentation follows product grade, a single classification describing the purity specification the material is produced and sold to. Each grade carries its own purification route, handling requirement, qualification burden, and price position, so commercial economics track the specification rather than the industry consuming it. End-use industry and supply arrangement appear separately within the framework as their own distinct dimensions.
anhydrous-hydrogen-fluoride-market-market-share-analysis-1787331965025

Electronic Grade Hydrogen Fluoride

Electronic grade hydrogen fluoride grows fastest at 12.4%, about 1.77 times the overall 7.0% rate, and semiconductor node advancement rather than wafer volume explains most of it. Metallic contamination limits at advanced nodes reach parts per trillion, which requires purification steps, containment materials, and analytical capability that only a handful of producers hold anywhere. The 2019 Korean export restriction proved how narrow that supply base actually is and triggered localisation programmes still running. Qualification with a fabrication plant takes many months and rarely reopens once complete. Pricing reflects scarcity and qualification depth rather than any production cost calculation. Geography has now become part of the qualification specification rather than a commercial preference.
CAGR 12.4%

Battery Grade Hydrogen Fluoride

Battery grade hydrogen fluoride grows at 10.8%, the second-fastest specification, driven entirely by lithium hexafluorophosphate production for cell electrolyte. Purity sits between technical and electronic grade, which makes it reachable for producers wanting to exit commodity refrigerant supply without funding semiconductor-level purification. Chinese producers hold most capacity because cell manufacturing concentrated there and the salt does not travel well. Western battery localisation programmes are discovering that electrolyte salt supply did not move with the cell plants, which is creating qualification urgency rather than new capacity. Demand tracks announced cell capacity closely, which makes it volatile when projects slip. Purification requirements sit well below semiconductor grade, which widens the field considerably.
CAGR 10.8%
Full segment breakdown across 5 segments available in the complete report.

Regional Architecture and Country Demand Map

Fluorochemical and electronics capacity together set this distribution, since the molecule is hazardous to move and production sits near consumption. East Asia leads on both fluoropolymer and semiconductor capacity, while South Asia and Pacific grows quickest as Indian fluorochemical capacity expands. Hazard keeps production near consumption.

North America

North America holds 25% of value, weighted toward fluoropolymer production, uranium conversion, and a semiconductor fabrication build-out that is only now reaching the point of needing local electronic grade supply. Mexican fluorspar output sits inside the region, which gives it a mineral position Europe entirely lacks. Permitting new hydrogen fluoride capacity is difficult and community resistance is genuine, so additions have been slow relative to announced chip investment. Per- and polyfluoroalkyl substance regulation is advancing at state level and threatens downstream demand. Growth of 6.4% reflects electronics and battery pull against refrigerant phase-down and regulatory uncertainty. Mexican mineral output inside the region is the one advantage Europe cannot replicate at all.
Share: 25% | CAGR: 6.4% (2026 to 2036)

Western Europe

Regulation defines the outlook here more than capacity does. Western Europe holds 20% of value, with substantial fluoropolymer and specialty fluorochemical production facing a per- and polyfluoroalkyl substance restriction proposal that would reach the manufacture of materials this molecule feeds. There is no meaningful European fluorspar production, so mineral dependence is total and unmitigated. Energy costs since 2022 have also disadvantaged an electricity-intensive process. Electronic grade capability exists but at smaller scale than Asian equivalents. Growth of 5.4% is the slowest of the seven regions, reflecting genuine regulatory threat to downstream demand. Mineral dependence here is total, and there is nothing locally available with which to mitigate any part of it.
Share: 20% | CAGR: 5.4% (2026 to 2036)
Regional intelligence for 5 additional markets available in the complete report: East Asia, South Asia and Pacific, Latin America, Middle East and Africa, Eastern Europe. Contact sales@marketmindsadvisory.com.
anhydrous-hydrogen-fluoride-market-country-cagr-analysis-1787331965545

Where Fluorine Chain Margin Actually Sits

Selling technical grade against a mineral cost nobody controls is the weakest position in this chain. The four moves below reach ground that scarcity protects: purity qualification, mineral offtake security, recovered fluorine feedstock, and geographic supply that customers now treat as strategic rather than commercial. Each of them takes years, and none is a discount.

Qualify Into Purity Grades Competitors Cannot Reach

Electronic grade at parts per trillion metallic contamination grows at 12.4% against a market at 7.0%, and only a handful of producers worldwide can meet advanced node specification at all. Qualification with a fabrication plant takes many months of analytical work and rarely reopens once complete, which makes each position durable for years. Battery grade sits below that and is reachable without semiconductor-level purification. Producers holding only technical grade compete on a mineral cost they do not control and a price somebody else sets. Battery grade is the practical stepping stone.
Market Impact: Electronic grade grows at 12.4% aga

Secure Fluorspar Offtake Before The Next Export Decision

Roughly 72% of acid grade fluorspar comes from two countries and mineral input is about 47% of production cost, which makes long-term offtake the single most consequential commercial arrangement a producer signs. Agreements covering multiple mines and origins cost commitment and occasionally leave volume unused. They also mean production continues when export policy changes, which has happened often enough in fluorine chemistry that treating it as a tail risk is no longer defensible for anybody. Treating a two-country feedstock base as a tail risk is no longer a defensible position for anybody.
Market Impact: Mineral input is about 47% of produ

Recover Fluorine From Phosphate And Spent Acid

Fluorosilicic acid from phosphate fertiliser processing and fluoride recovery from spent etchant and pickling acid both provide feedstock that bypasses fluorspar entirely. Neither reaches the scale of mined supply, and purification to usable specification is genuinely difficult, but every recovered tonne reduces exposure to a mineral concentrated at 72% in two countries. Regulatory pressure on fluoride discharge is also making recovery attractive to the industries generating those streams, which improves the commercial terms available. Neither route replaces mined supply, but each tonne recovered is a tonne of exposure removed permanently.
Market Impact: Recovery bypasses part of the 47% m

Sell Supply Geography As A Strategic Position

The 2019 export restriction on electronic grade material to Korea taught every semiconductor and battery manufacturer that fluorine supply geography is a strategic exposure rather than a procurement detail. Producers located inside a customer's jurisdiction can price that proximity, particularly where localisation policy or customer risk committees are driving qualification. Permitting takes 4 to 7 years, so the position cannot be replicated quickly by anybody who did not start. Customers are paying for it now in a way they never did before. Nobody starting today arrives before the current cycle ends.
Market Impact: Permitting protects the position fo

Who Controls the Margin Pool

Concentration is high: the top five hold roughly 54% of hydrogen fluoride revenue, because hazardous chemistry is permitted with difficulty and capital intensity keeps entrants out. The gap between leaders and challengers is purity capability and mineral security rather than process technology, which is well understood. All participants here are assessed on one basis, revenue from merchant anhydrous hydrogen fluoride production and sale, excluding aqueous acid solutions, downstream fluorochemica
Competition runs along four lines. First, purity capability, since electronic and battery grades carry the value and the qualification barriers. Second, fluorspar offtake security, because mineral input is nearly half of production cost. Third, geographic position relative to customers who now treat fluorine supply as strategic. Fourth, integration into downstream fluorochemicals, which captures value the merchant molecule alone does not.

Pressure is building from two directions. Per- and polyfluoroalkyl substance regulation threatens fluoropolymer demand that currently consumes substantial volume, and the proposals reach production rather than only use. Meanwhile Chinese producers hold both the mineral and most battery grade capacity. Rankings should favour producers with electronic grade capability and secured mineral supply over those defending technical grade volume on cost.
anhydrous-hydrogen-fluoride-market-company-positioning-matrix-1787331966065

Competitive Moat and Risk Dimensions

HONEYWELL

Moat: Downstream integration and scale

Honeywell operates hydrogen fluoride capacity integrated into its own refrigerant and fluorochemical production, which captures value across the chain rather than selling the merchant molecule alone. That integration also gives it a captive demand base insulated from merchant market swings. Long-established North American positions in uranium conversion and specialty fluorine supply carry qualification depth competitors cannot assemble quickly.
HONEYWELL

Risk: Refrigerant exposure and fluorochemical rules

A substantial share of downstream demand sits in refrigerants under phase-down schedules that shrink the addressable volume year after year. Per- and polyfluoroalkyl substance regulation is advancing toward the fluorochemical production this integration depends on. Electronic grade capability is also thinner than Japanese specialists hold, which leaves the fastest-growing grade largely to competitors.
STELLA CHEMIFA

Moat: Electronic grade purity leadership

Stella Chemifa holds the highest electronic grade purity capability in the industry, reaching the parts per trillion metallic contamination limits advanced semiconductor nodes require, which very few producers anywhere can match. Qualification positions with leading fabrication plants took years to establish and rarely reopen. Analytical capability underpinning that purity claim is itself a genuine barrier competitors underestimate consistently.
STELLA CHEMIFA

Risk: Customer concentration and localisation

Revenue concentrates in a small number of semiconductor customers whose capital cycles move together, which makes demand lumpier than the growth rate suggests. The 2019 export restriction accelerated Korean and Chinese localisation programmes aimed directly at replacing Japanese supply. Fluorspar dependence is also total, since Japan has no domestic mineral resource of any commercial significance.

Players Tracked

Prominent Players

Honeywell
Solvay
Daikin Industries
Stella Chemifa
Do-Fluoride New Materials

Other Key Players

Arkema
Chemours
Gujarat Fluorochemicals
Navin Fluorine International
SRF Limited
Morita Chemical Industries
Zhejiang Sanmei Chemical
Juhua Group
Sinochem Lantian
Yingpeng Chemical
Fubao Group
Buss ChemTech
Fluorsid
Mexichem Fluor
Central Glass

Recent Developments

MARCH 2025

European fluorochemical restriction proposal advances through assessment

The per- and polyfluoroalkyl substance restriction proposal progressed through European scientific assessment, with scope questions covering fluoropolymer manufacture rather than only consumer applications. This was regulatory process rather than any commercial transaction, and it kept a substantial block of downstream hydrogen fluoride demand under review rather than under competition.
Signal: Regulation reaching production rather than
OCTOBER 2024

Battery grade capacity expansions concentrate in Chinese production

Additional lithium hexafluorophosphate and battery grade hydrogen fluoride capacity advanced in China, extending an already dominant position as Western cell plants came online without matching local salt supply. These were capacity expansions rather than acquisitions, and they widened the gap between where cells are made and where their fluorine originates.
Signal: Cell plants localised while their electrol
JUNE 2024

Semiconductor fluorine localisation programmes reach qualification

Korean and Chinese electronic grade hydrogen fluoride produced under post-2019 localisation programmes completed qualification at additional fabrication plants, displacing volumes previously supplied from Japan. These were qualification milestones rather than corporate transactions, and they reflect a supply base permanently redistributed by a single export decision.
Signal: One export restriction rebuilt a supply ba

Acid Grade Fluorspar, Sulphuric Acid, Energy

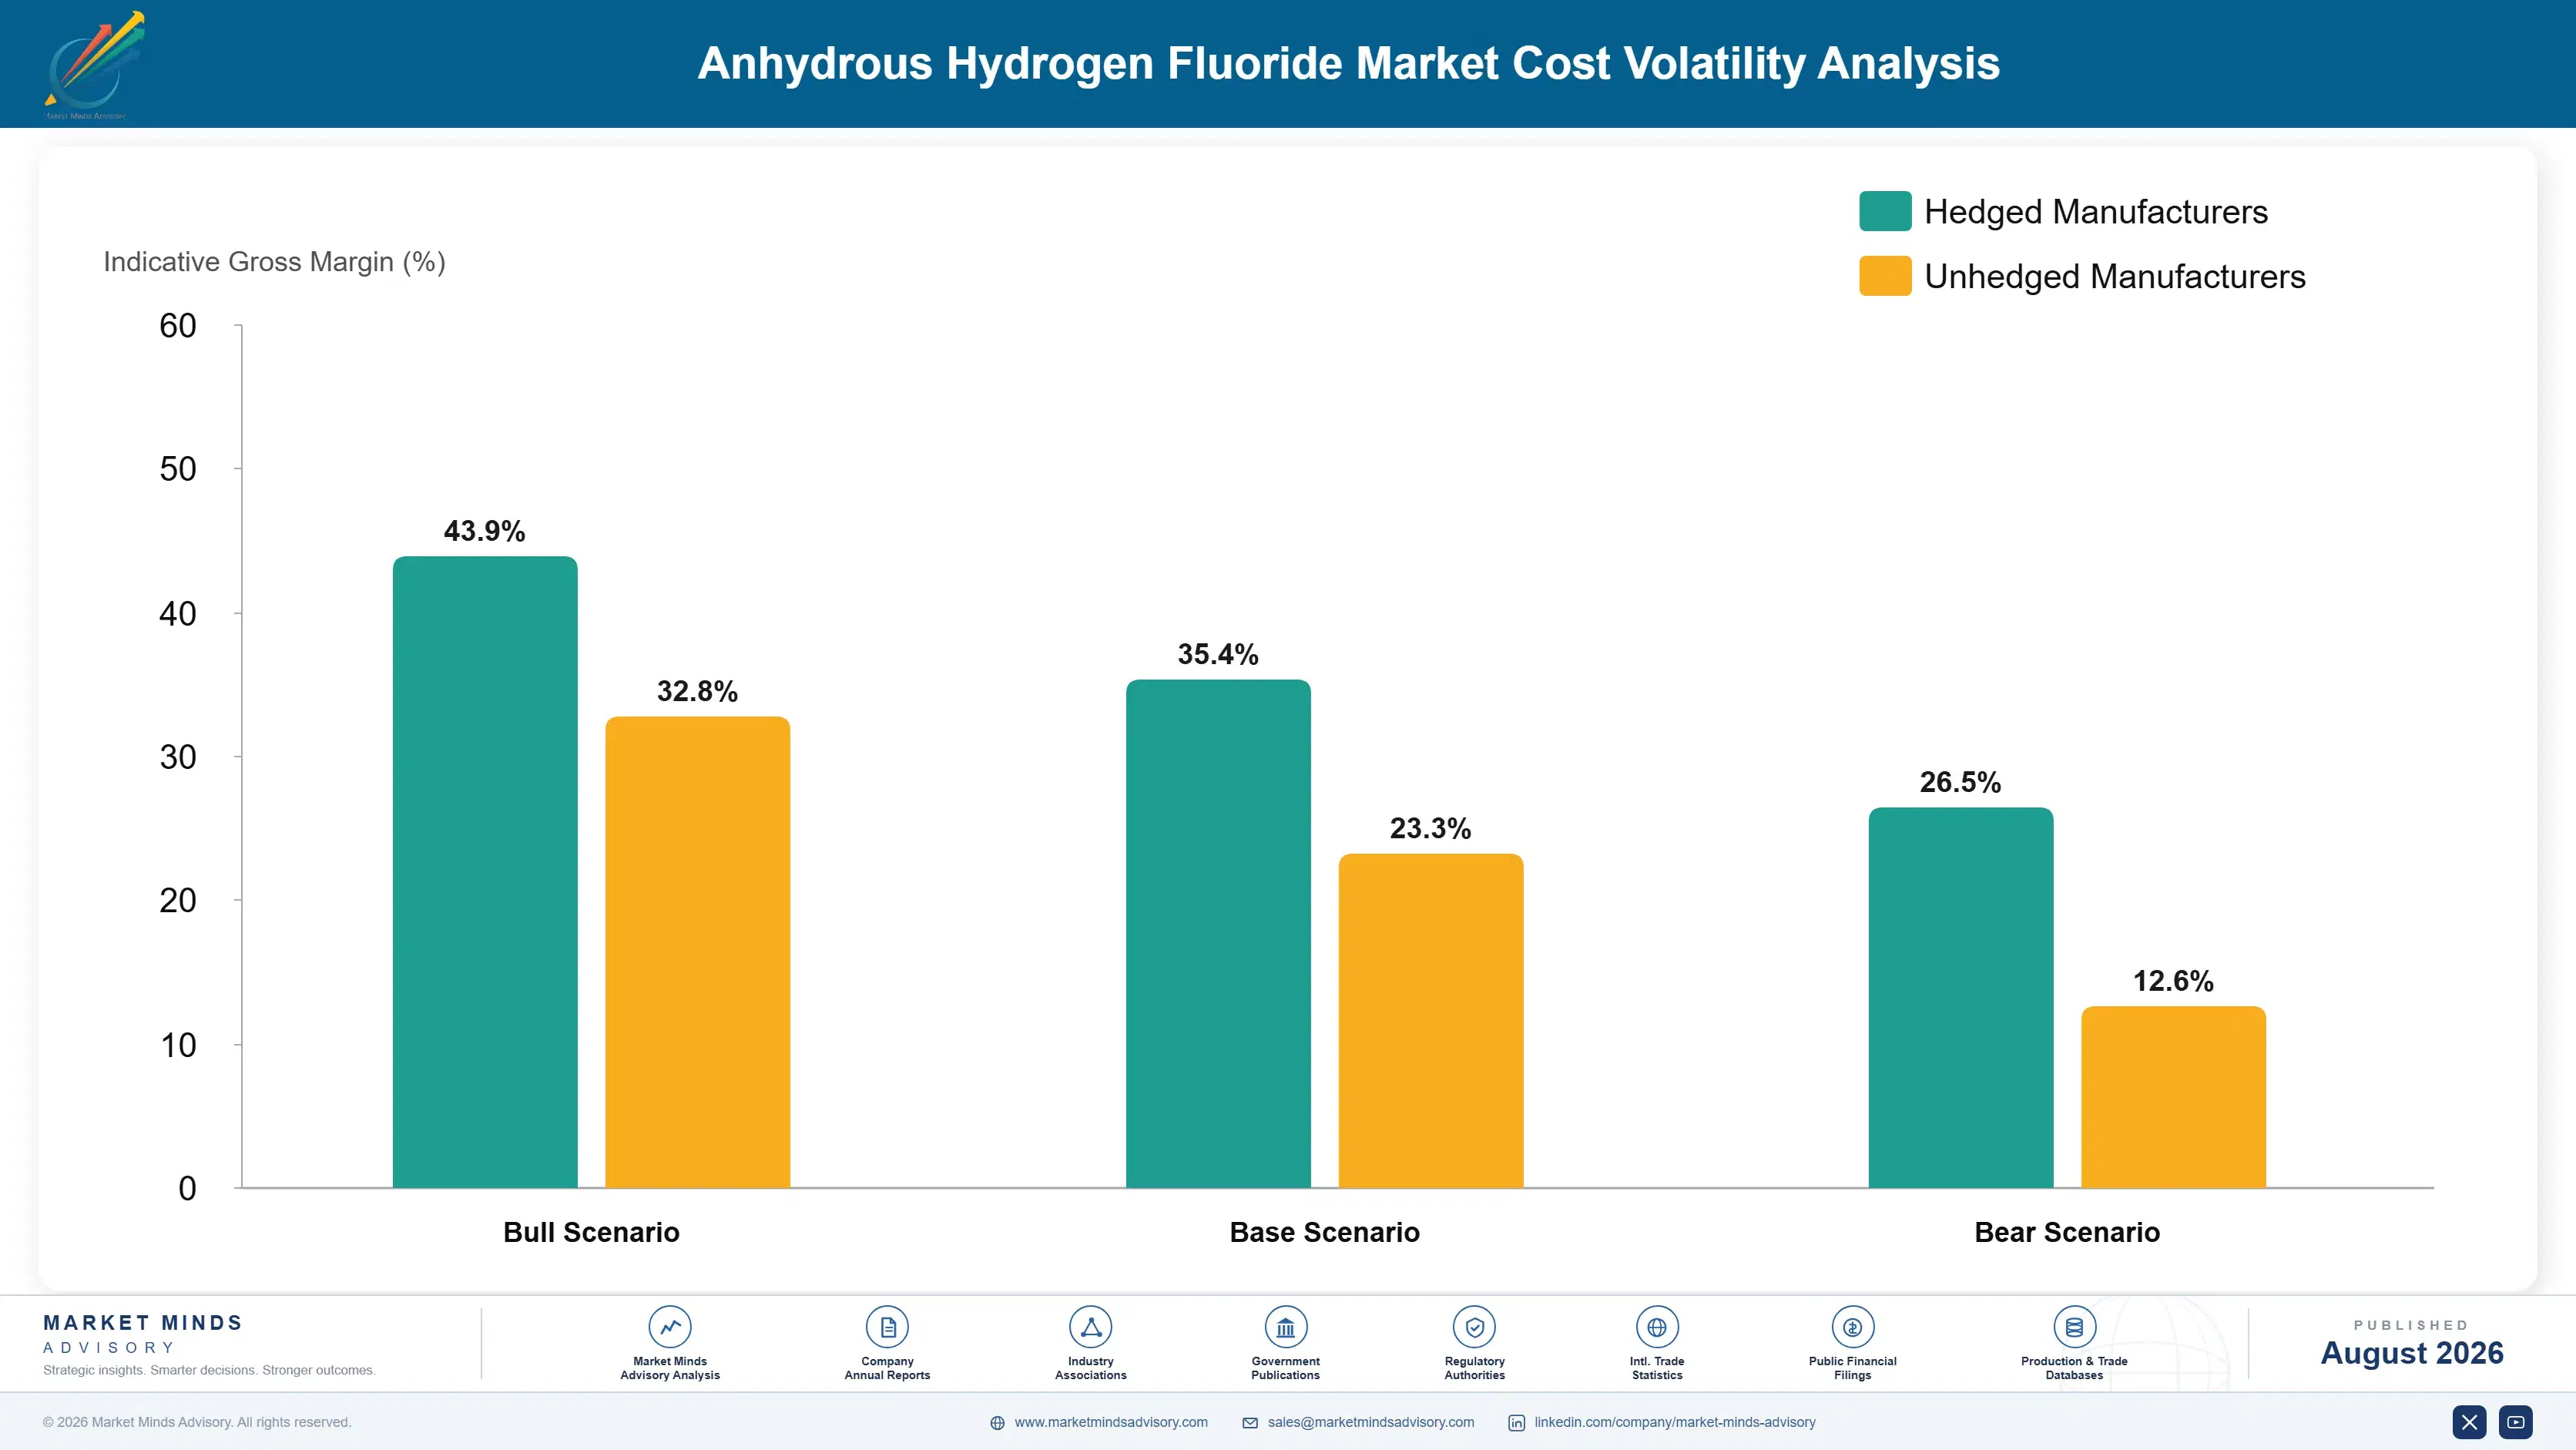
One mineral dominates this cost sheet and there is no alternative to it. Acid grade fluorspar runs roughly 47% of production cost, sourced overwhelmingly from Chinese and Mexican mines that together supply about 72% of world output. Sulphuric acid adds 12% to 18%, energy for the reaction and distillation 14% to 22%, and specialised containment materials, maintenance, and emissions abatement a further 10% to 16%.
Chinese fluorspar export policy and mine consolidation tightened acid grade availability through 2021 and 2022, and pricing rose steeply while buyers had no alternative source to approach. Solvay and Gujarat Fluorochemicals both disclosed raw material cost pressure across those reporting periods. European energy costs then compounded it, with IEA analysis recording industrial gas at several times prior-year levels on a process that is genuinely energy intensive throughout.

Exposure separates by mineral security rather than by scale. A producer holding long-term offtake across multiple mines and origins continues operating when export policy shifts, while one buying spot fluorspar carries whatever the two-country supply base charges and occasionally cannot buy at all. Geography compounds it, since Chinese producers sit on domestic mineral supply while European producers have no local resource of any commercial significance whatsoever.
anhydrous-hydrogen-fluoride-market-cost-volatility-analysis-1787331966261

Contract fluorspar offtake across multiple mines and countries

Mineral input is nearly half of cost and comes overwhelmingly from two countries, which makes offtake the most consequential agreement a producer signs. Contracting across several mines and origins costs commitment and occasionally leaves volume unused. It also means production continues when export policy shifts, which has happened often enough in fluorine chemistry that treating it as remote is indefensible.

Develop recovered fluorine feedstock from industrial streams

Fluorosilicic acid from phosphate fertiliser processing and fluoride recovery from spent etchant and pickling acid both bypass mined fluorspar entirely. Neither reaches mined scale and purification to usable specification is difficult, but each recovered tonne reduces mineral exposure directly. Discharge regulation is also pushing those industries to seek offtake, which improves the terms available to whoever moves first.

Recover heat and hydrogen fluoride from process vents

The reaction runs hot and distillation is energy intensive, with energy at 14% to 22% of cost, so heat integration recovers real money on an asset already built. Vent scrubbing that recovers product rather than neutralising it improves yield and cuts abatement load. Retrofit on old plants is awkward and expensive, which is why many operators have deferred it.

Portfolio Architecture for Margin Defence

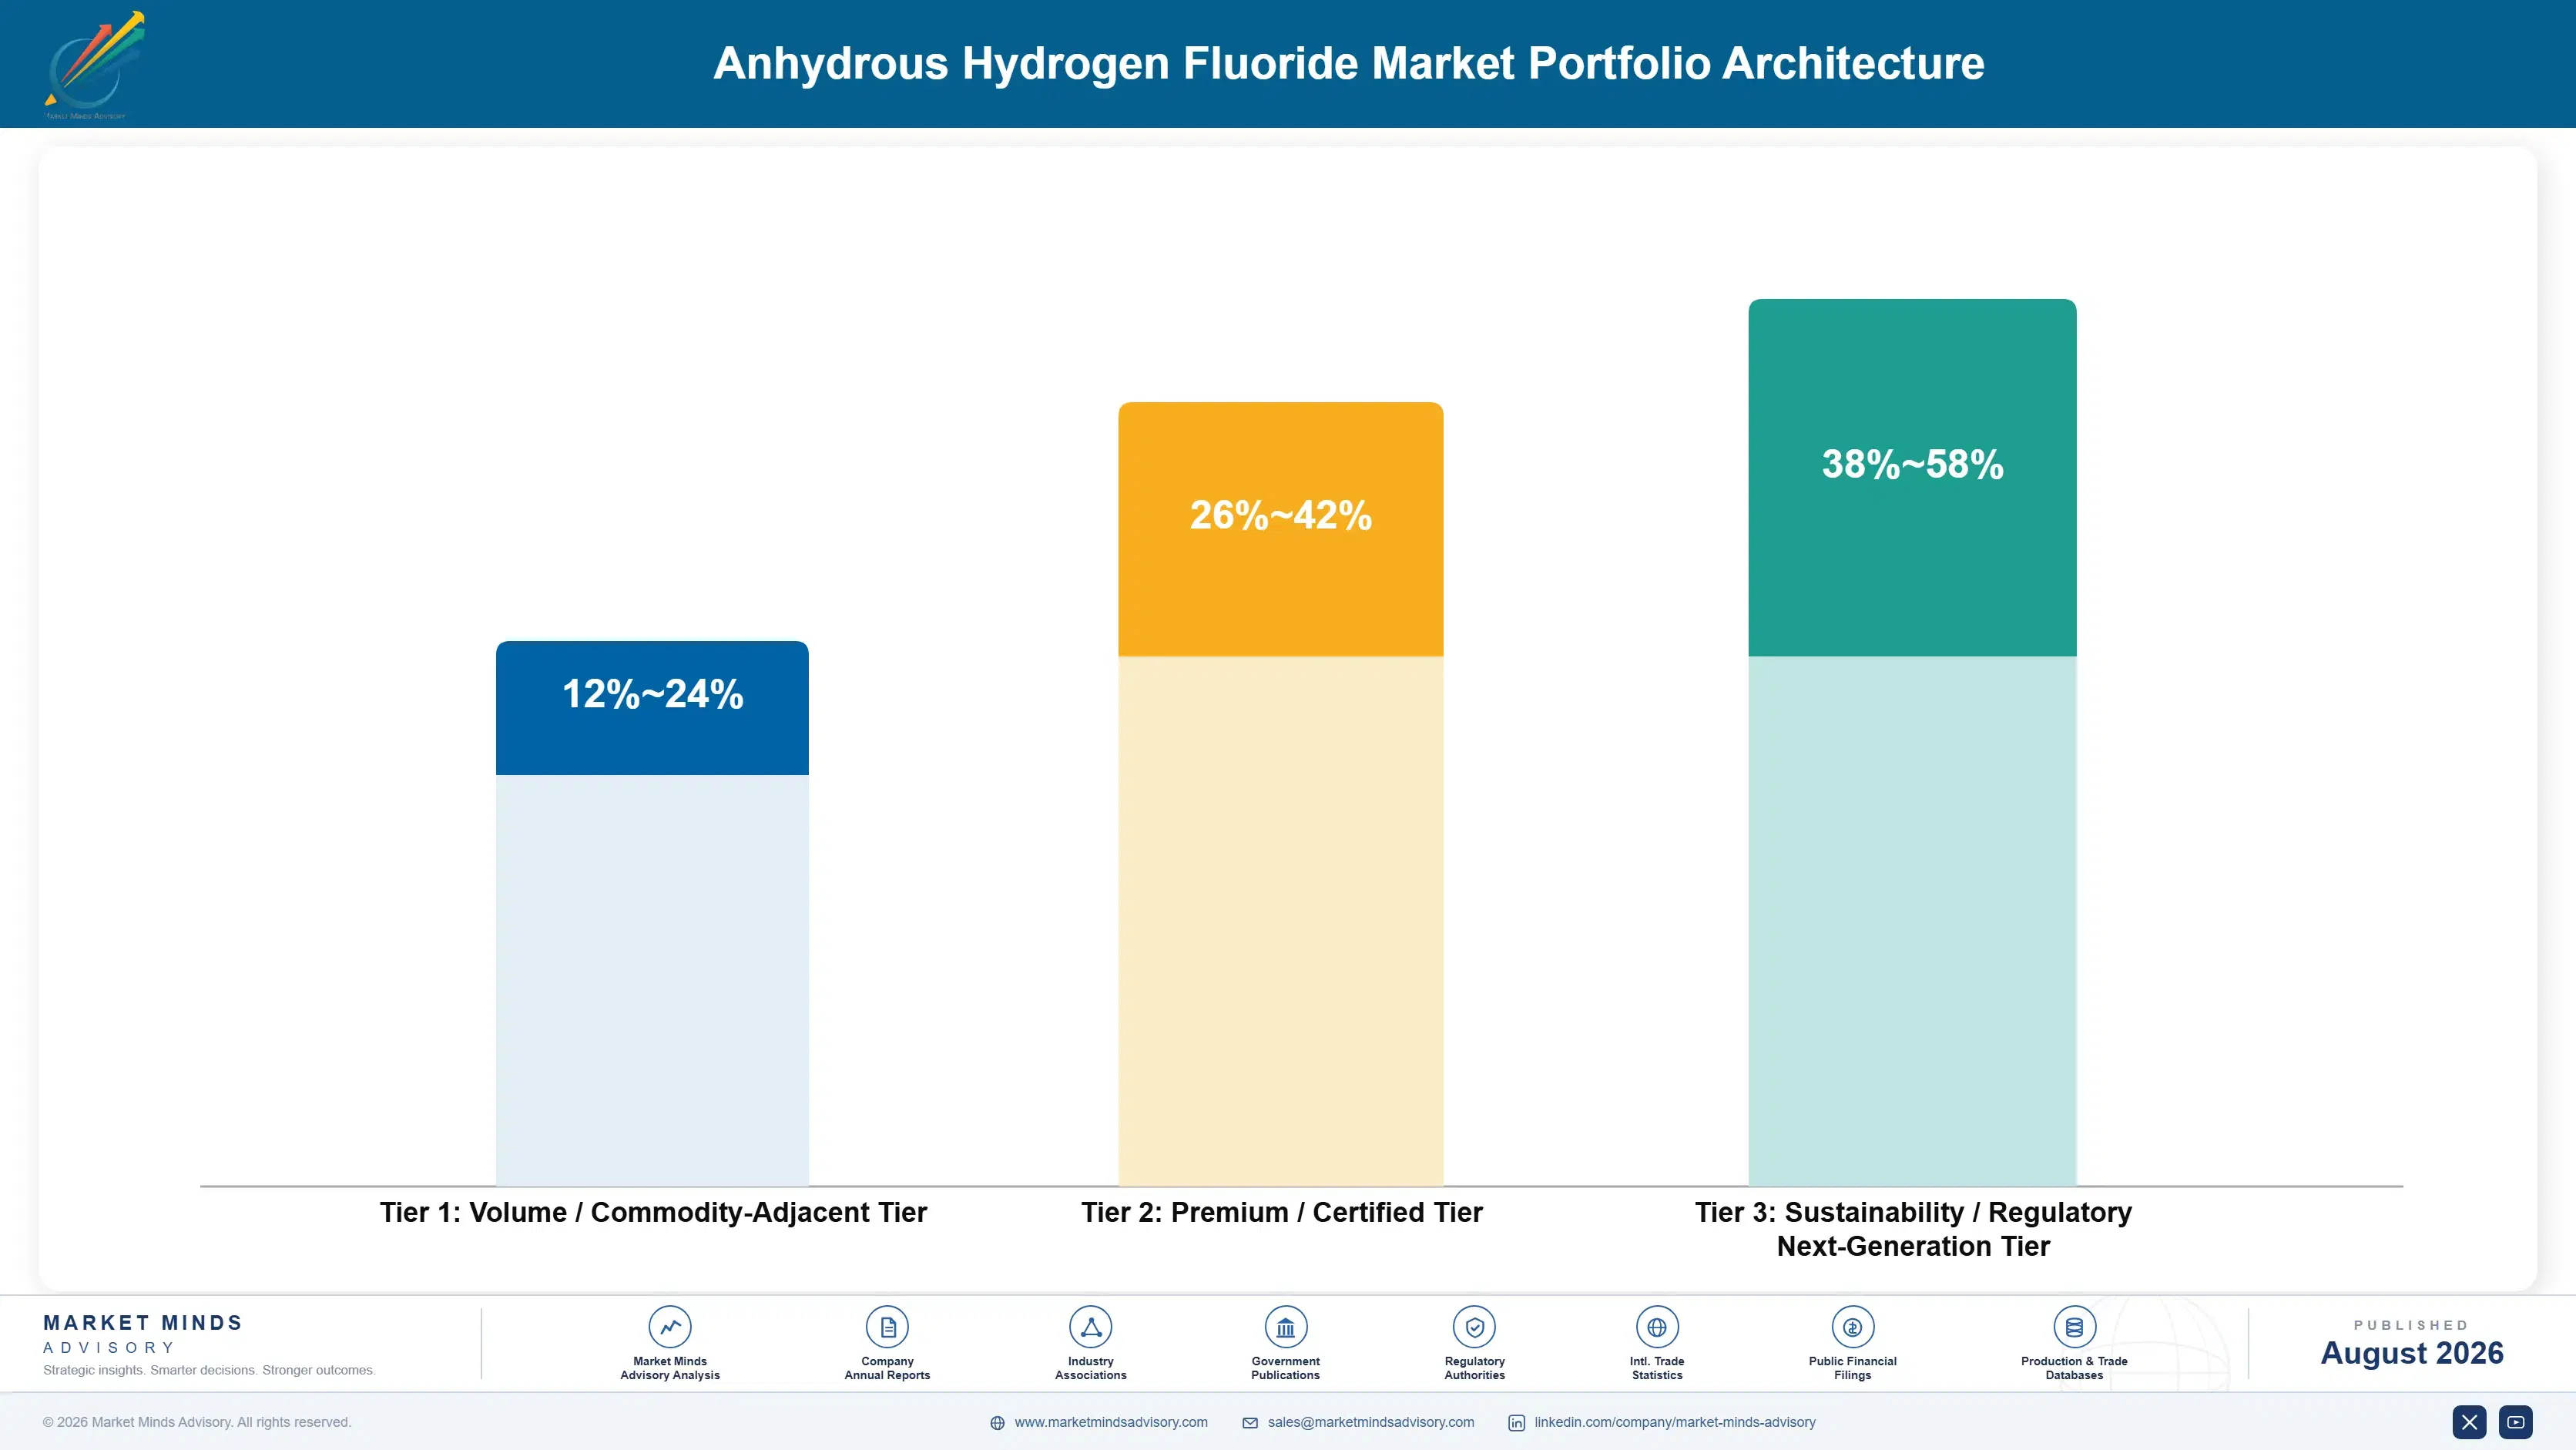
The portfolio splits into three tiers with sharply different economics. Technical grade for fluorochemical synthesis forms the volume tier, where mineral cost sets the floor and the producer controls almost nothing above it. Aluminium fluoride and metallurgical supply earn slightly more through logistics position and contract structure. Electronic, battery, and nuclear grades price against qualification scarcity rather than against any production cost calculation at all.
The tension runs between technical volume that fills the plant and high-purity grades that earn the return. Technical grade keeps reactor and distillation capacity loaded, absorbs committed fluorspar offtake, and supports the downstream integration many producers depend on. Yet it competes on a mineral cost nobody controls. Producers handling this well accept thin technical margin for utilisation while directing capital toward purification capability for electronics and battery grades.

High-value pools concentrate where qualification or capability limits competition: electronic grade at parts per trillion purity, battery grade qualified into electrolyte salt production, nuclear grade under long-term conversion contracts, and any grade supplied from inside a customer's jurisdiction where localisation policy applies. All four escape mineral cost comparison. Technical grade for refrigerant synthesis sits at the other end, facing mineral exposure and a phase-down schedule.

Volume / Commodity-Adjacent Tier

Technical grade hydrogen fluoride for fluorochemical synthesis and aluminium fluoride supply. The range is wide because fluorspar offtake position and regional energy cost separate producers enormously at identical selling prices.
Gross Margin: 12-24%

Premium / Certified Tier

Battery grade material for electrolyte salt production and nuclear grade under long-term conversion contracts. The range is wide because qualification depth varies and Chinese battery grade capacity competes hard on cost against everybody else.
Gross Margin: 26-42%

Sustainability / Regulatory / Next-Generation Tier

Electronic grade at advanced node purity, recovered-fluorine feedstock routes, and material supplied under localisation programmes. The range is wide because purity scarcity supports pricing while recovery routes still carry unrecovered development cost.
Gross Margin: 38-58%
anhydrous-hydrogen-fluoride-market-portfolio-architecture-1787331966758

High-value Sub-segments and Strategic Watch-out

Electronic Grade Hydrogen Fluoride

High value and high growth at 12.4%, the fastest grade, because advanced node contamination limits reach parts per trillion and very few producers can meet them. Qualification takes months and rarely reopens, and the 2019 export restriction made geography part of the specification. Very few producers can reach it.
Gross Margin: 38-58%

Battery Grade Hydrogen Fluoride

High value with strong growth at 10.8%, driven entirely by lithium hexafluorophosphate production for cell electrolyte. Chinese producers hold most capacity because cells are made there, and Western localisation has not yet brought the salt supply chain with it. Qualification urgency is running ahead of capacity.
Gross Margin: 26-42%

Technical Grade Hydrogen Fluoride

The volume core by a wide margin, growing at 5.2% across fluoropolymer, refrigerant, and agrochemical synthesis. Mineral cost sets the floor, refrigerant phase-down removes demand steadily, and fluorochemical regulation now threatens the fluoropolymer volume underneath it. Nothing sold into this tier is genuinely differentiated at all.
Gross Margin: 12-24%

Aluminium Fluoride and Metallurgical Grade

The strategic watch-out, growing at 4.8% with primary aluminium output that is itself constrained by power availability and carbon policy. Volume is steady and geographically fixed to smelters, with logistics position mattering more than any product differentiation. Smelter location fixes this demand geographically, and permanently so.
Gross Margin: 14-26%

How Fluorine Supply Positions Hold

Demand commits at grade qualification and repeats as contracted tonnage. A producer qualified into a fabrication plant or electrolyte salt process has passed analytical verification, handling validation, and often a plant trial, and requalifying an alternative on acutely hazardous chemistry is not something any process engineer initiates casually. That protects incumbents strongly. The genuine competitive moments are a new fabrication plant, a localisation programme, and any export decision remo
Stickiness varies by purity and hazard consequence. Electronic grade sticks hardest, since contamination at parts per trillion is traced to source and a qualification failure costs wafer starts. Nuclear grade sticks through long-term conversion contracts and security requirements. Battery grade sticks through electrolyte process qualification. Technical grade sticks least, moving on delivered cost because the specification is broad and mineral cost dominates pricing.

Buyer profiles have moved from procurement buying a commodity chemical toward risk committees, government programmes, and technology functions treating fluorine as strategic. The 2019 export restriction caused that shift more than any commercial argument ever did. That change rewards producers demonstrating mineral security and jurisdictional position alongside specification, and penalises those still competing on delivered cost against a mineral price they cannot influence.
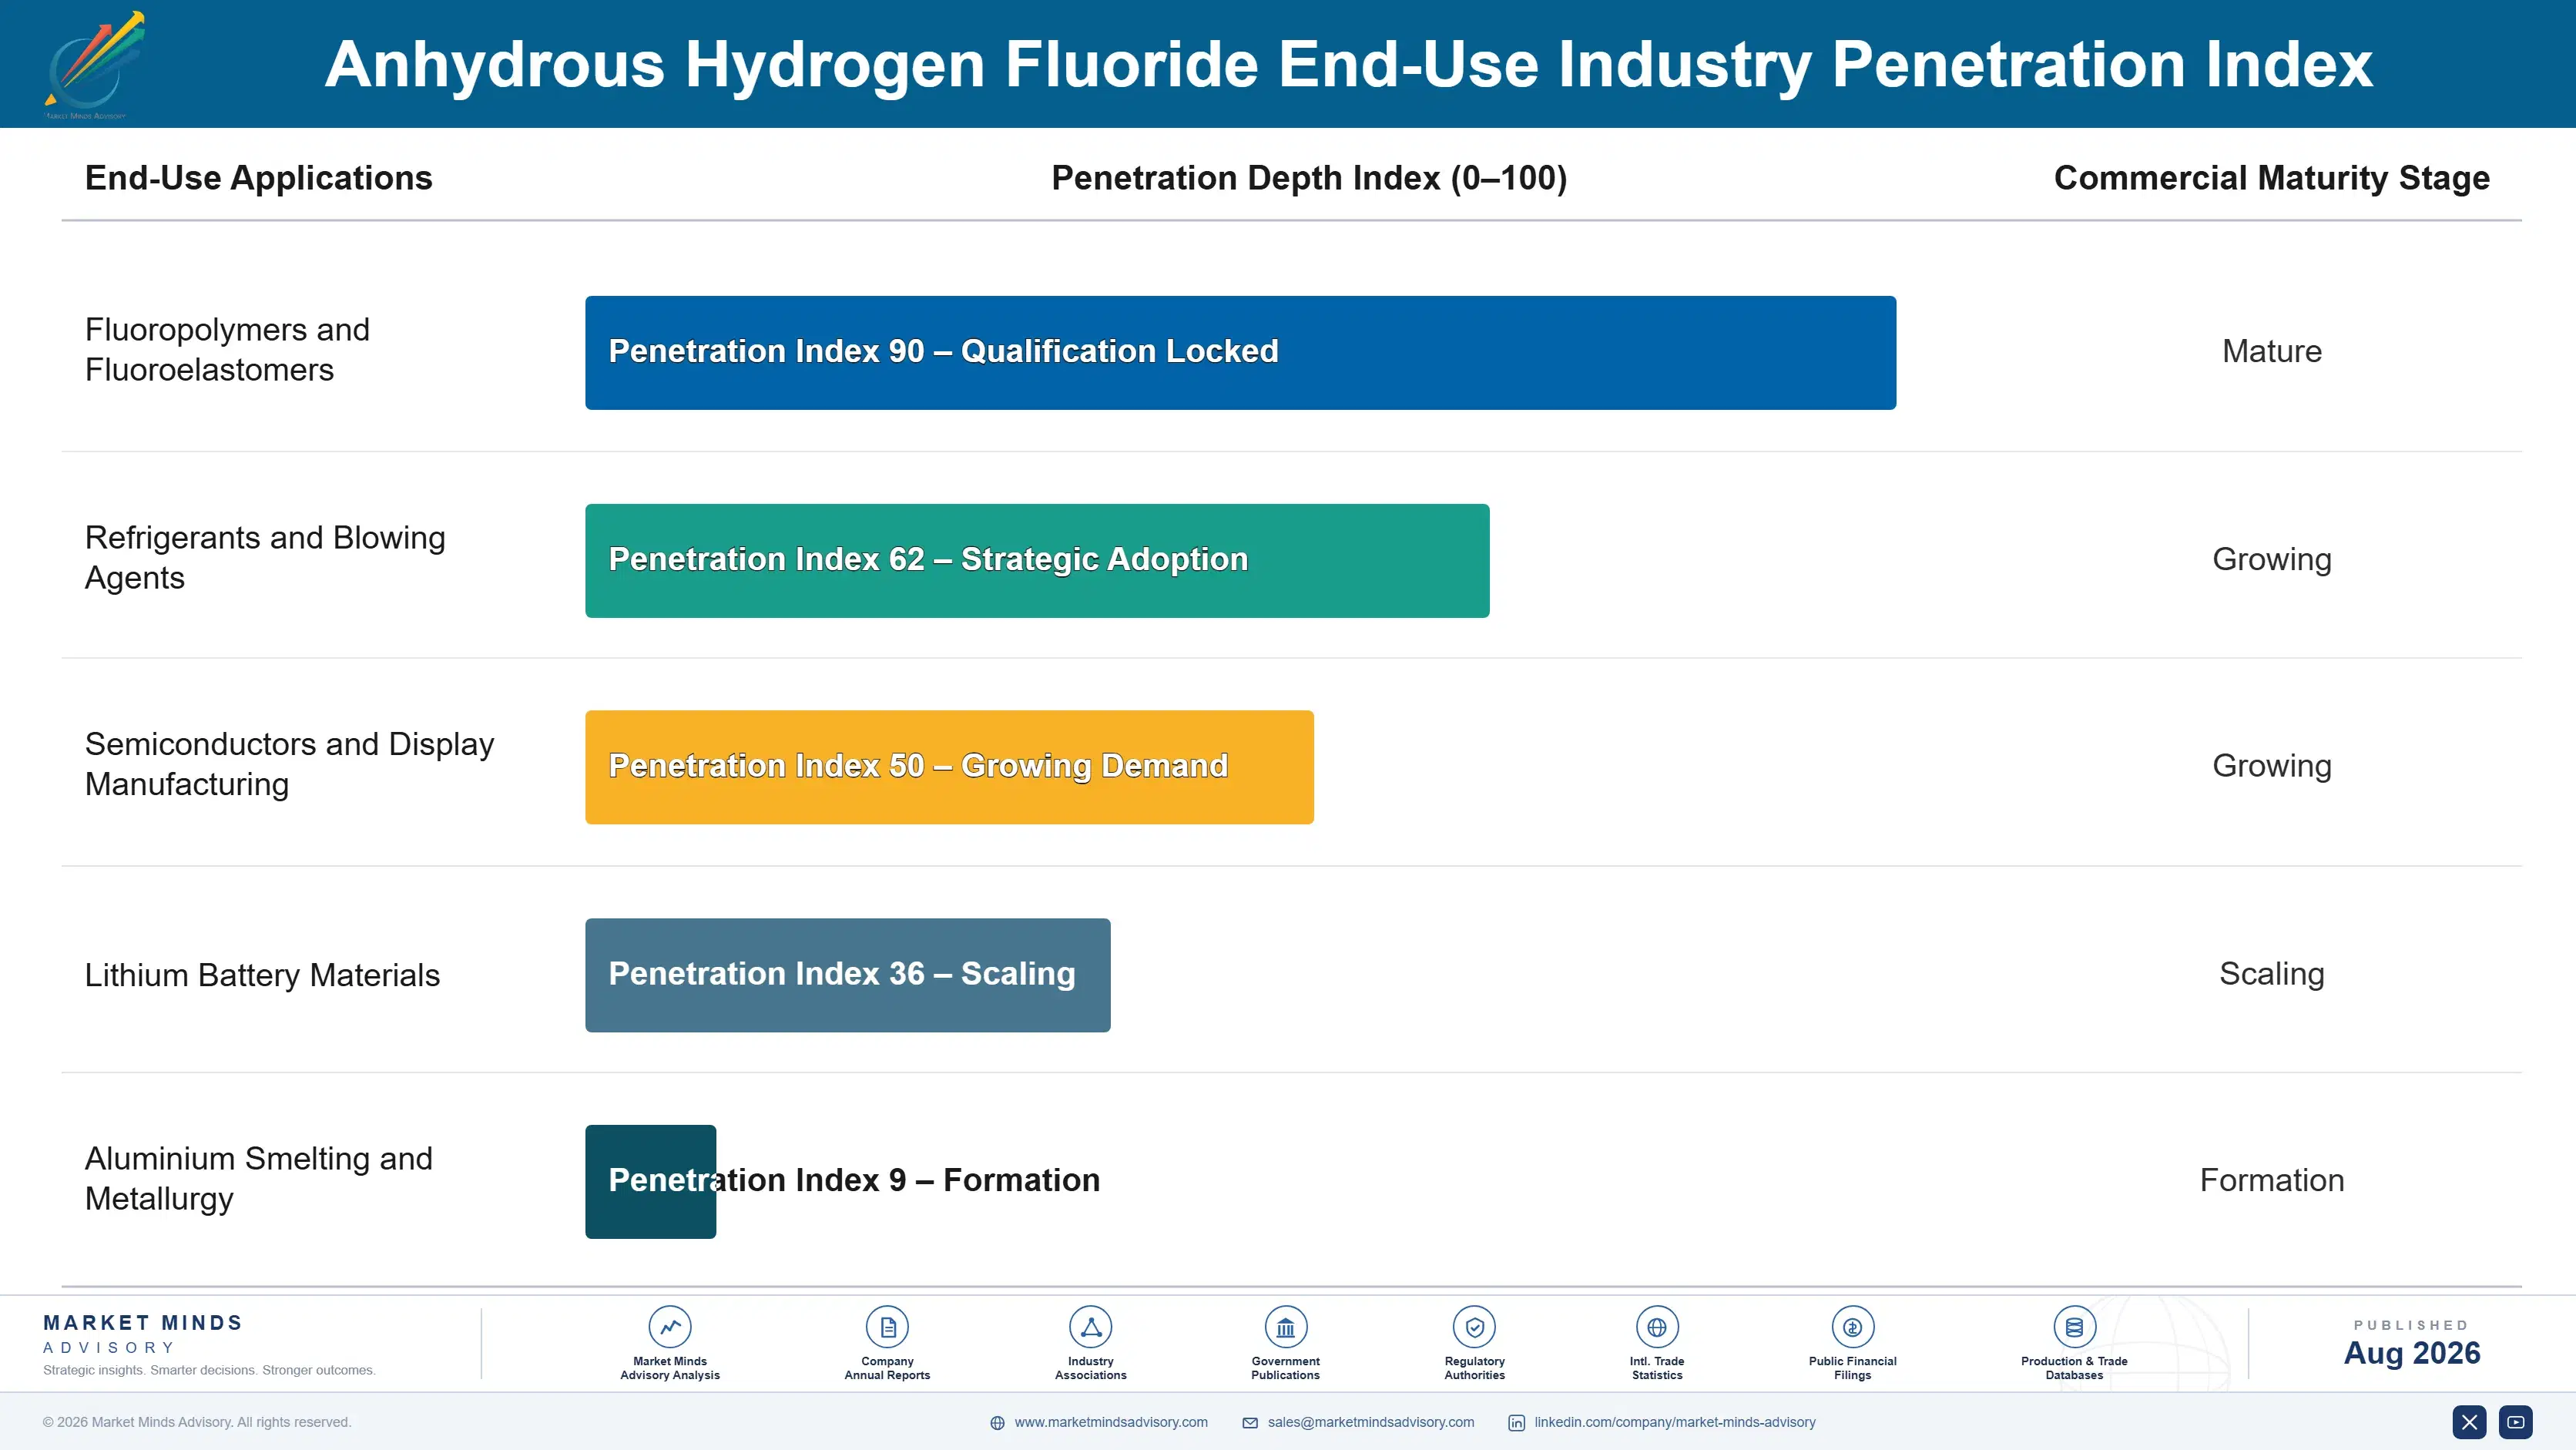
anhydrous-hydrogen-fluoride-market-end-use-penetration-index-1787331967250

Our Call On Hydrogen Fluoride

These are among the four positions where our research anticipates prominent divergence between winners and laggards over the coming forecast period. Each is grounded in the demand model, the regulatory perimeter, and the announced capacity pipeline.
01 / PURITY GRADE MIGRATION

Technical grade is a mineral cost with a plant attached

Electronic grade at parts per trillion contamination grows at 12.4% against a market at 7.0%, and only a handful of producers worldwide can meet advanced node specification at all. Qualification takes months of analytical work and rarely reopens once complete, which makes each of those positions durable for years rather than quarters. Producers holding only technical grade are competing on a fluorspar cost they do not control and a price that downstream fluorochemical economics set for them entirely, year after year.
02 / MINERAL OFFTAKE SECURITY

Two countries hold the feedstock and no substitute exists

Roughly 72% of acid grade fluorspar comes from China and Mexico while mineral input is about 47% of production cost, which makes offtake the single most consequential commercial agreement any producer ever signs. Contracting across several mines and multiple origins costs commitment and occasionally leaves volume unused in a weak year. It also means production continues when export policy shifts, and fluorine chemistry has seen that happen often enough that treating it as a remote possibility is no longer defensible for anybody.
03 / JURISDICTION AS PRODUCT

Customers now pay for where the plant sits

The 2019 restriction on electronic grade supply to Korea taught every semiconductor and battery manufacturer that fluorine supply geography is a strategic exposure rather than merely a procurement footnote. Producers inside a customer's jurisdiction can now price that proximity, particularly where localisation policy or a risk committee is driving the qualification decision. Permitting takes 4 to 7 years, so nobody who did not start already can replicate the position, which is precisely what makes the position saleable at a premium today.
04 / DOWNSTREAM REGULATORY EXPOSURE

Fluoropolymer rules would remove irreplaceable demand

Per- and polyfluoroalkyl substance restrictions have already moved from consumer products toward industrial fluoropolymer manufacture, and the European proposals under assessment would reach the production of materials consuming this molecule in genuinely large volume. No substitute chemistry exists at all for those applications, so any restriction removes that demand outright rather than redirecting it somewhere else. Producers concentrated in technical grade for fluoropolymer synthesis are simply carrying that exposure with very little visible hedge against it anywhere in their portfolios at all.

Engagement Snapshot From the Field

A live engagement with an industry participant carrying material or product regulatory and market exposure ahead of a defining policy shift, showing how our research translates into a defensible multi-year portfolio strategy.
MARKET MINDS ADVISORY · CLIENT ENGAGEMENT SUMMARY
Anhydrous Hydrogen Fluoride Producer Strategic Portfolio Review and Transition Roadmap 2026·Investment Scenario on Anhydrous Hydrogen Fluoride Exposure Evaluation 2025-26
CLIENT PROFILE
A battery cell manufacturer building capacity in two Western markets engaged MMA after discovering its electrolyte salt supply traced entirely to Chinese hydrogen fluoride. The client reported four qualified electrolyte suppliers, all sourcing hexafluorophosphate from the same region, and no visibility beyond the first tier of that chain (client-reported, unverified by MMA). Localisation funding required provenance it could not produce.
STRATEGIC CHALLENGE
Localisation funding required demonstrable supply chain provenance the client could not produce, while requalifying electrolyte on a different salt source would take months of cell testing. No Western battery grade hydrogen fluoride capacity of adequate scale existed to qualify against. The board needed a position before the next funding milestone, not after it.
MMA APPROACH
MMA traced the chain from cell back through electrolyte and salt to hydrogen fluoride and then to fluorspar origin, which the client had never mapped past its direct suppliers. We assessed which Western producers could reach battery grade specification and on what timeline. We then modelled what qualification would cost in cell testing time rather than in material price, since that was the binding constraint.
KEY FINDINGS
  1. All four qualified electrolyte suppliers traced to hydrogen fluoride from the same two provinces, so apparent supplier diversity provided no actual supply security (client-reported, unverified by MMA).
  2. Only two Western producers could reach battery grade specification, and neither held capacity uncommitted inside the client's funding timeline on any realistic schedule.
  3. Requalifying cells on an alternative salt source would take roughly nine months of testing, which exceeded the funding milestone by a wide margin.
  4. Fluorspar origin was untraceable beyond the province level for three of the four suppliers, which no localisation programme would accept as provenance evidence.
CLIENT PROFILE
A battery cell manufacturer building capacity in two Western markets engaged MMA after discovering its electrolyte salt supply traced entirely to Chinese hydrogen fluoride. The client reported four qualified electrolyte suppliers, all sourcing hexafluorophosphate from the same region, and no visibility beyond the first tier of that chain (client-reported, unverified by MMA). Localisation funding required provenance it could not produce.
STRATEGIC CHALLENGE
Localisation funding required demonstrable supply chain provenance the client could not produce, while requalifying electrolyte on a different salt source would take months of cell testing. No Western battery grade hydrogen fluoride capacity of adequate scale existed to qualify against. The board needed a position before the next funding milestone, not after it.
MMA APPROACH
MMA traced the chain from cell back through electrolyte and salt to hydrogen fluoride and then to fluorspar origin, which the client had never mapped past its direct suppliers. We assessed which Western producers could reach battery grade specification and on what timeline. We then modelled what qualification would cost in cell testing time rather than in material price, since that was the binding constraint.
KEY FINDINGS
  1. All four qualified electrolyte suppliers traced to hydrogen fluoride from the same two provinces, so apparent supplier diversity provided no actual supply security (client-reported, unverified by MMA).
  2. Only two Western producers could reach battery grade specification, and neither held capacity uncommitted inside the client's funding timeline on any realistic schedule.
  3. Requalifying cells on an alternative salt source would take roughly nine months of testing, which exceeded the funding milestone by a wide margin.
  4. Fluorspar origin was untraceable beyond the province level for three of the four suppliers, which no localisation programme would accept as provenance evidence.
RECOMMENDED STRATEGY
Phase 1: Phase 1 (0 to 5 months): Map fluorspar origin to mine level with existing suppliers and present the gap honestly to the funding body. Phase 2: Phase 2 (5 to 18 months): Commit volume to one Western battery grade producer to underwrite the capacity qualification neither could fund alone. Phase 3: Phase 3 (18 to 32 months): Requalify one cell platform on the Western salt chain while retaining existing supply on the remainder.
OUTCOME
The client secured a funding extension by presenting a mapped chain and a committed remediation plan rather than a claim it could not support. Underwriting a Western producer's battery grade qualification created a second source that did not previously exist, and one cell platform completed requalification within thirty months (client-reported, unverified by MMA).

Frequently Asked Questions

Foundational context covering the market sizes, CAGR, scope, country, region and competition that inform every finding below. This section is provided to cover basics and most often pre-purchase conversations, answered from the MMA Primary Research Dataset.

What is the current size of the Anhydrous Hydrogen Fluoride Market?

The global anhydrous hydrogen fluoride market is valued at USD 3.6 billion in 2025, covering technical, electronic, battery, metallurgical, and nuclear grades. Aqueous acid solutions, downstream fluorochemicals, and fluorspar mining are excluded.

How large will the Anhydrous Hydrogen Fluoride Market be by 2036?

The market is forecast to reach USD 7.57 billion by 2036 in the base case, about 1.97 times the 2026 level. That represents incremental value of roughly USD 3.72 billion across the decade.

What is the CAGR for the Anhydrous Hydrogen Fluoride Market 2026 to 2036?

The market grows at a 7.0% CAGR in the base case, with bull and bear scenarios at 8.2% and 5.8%. The spread turns mainly on fluorochemical regulation and battery capacity build-out.

Which segment is growing fastest?

Electronic grade hydrogen fluoride grows fastest at 12.4%, about 1.77 times the overall rate, on semiconductor purity requirements. Battery grade follows at 10.8% on electrolyte salt production.

Who are the major companies in the Anhydrous Hydrogen Fluoride Market?

Leading producers include Honeywell, Solvay, Daikin Industries, Stella Chemifa, and Do-Fluoride New Materials. Concentration is high, with the top five holding roughly 54% of hydrogen fluoride revenue.

Which country is growing fastest?

India grows fastest at a 10.6% CAGR, as domestic fluorochemical and battery material capacity expands under incentive support. China and South Korea follow on electronics and battery demand.

Report Segmentation Architecture

The full report scope spans multiple orthogonal segmentation dimensions, with cross-tabulated demand data provided for each dimension pair. Coverage extends further to regional breakdowns, trend trajectories, and the competitive detail needed to support segment-level decision-making.

By Product Grade

  • Technical Grade Hydrogen Fluoride
  • Electronic Grade Hydrogen Fluoride
  • Battery Grade Hydrogen Fluoride
  • Aluminium Fluoride and Metallurgical Grade
  • Nuclear Grade Hydrogen Fluoride

By End-Use Industry

  • Fluoropolymers and Fluoroelastomers
  • Refrigerants and Blowing Agents
  • Semiconductors and Display Manufacturing
  • Lithium Battery Materials
  • Aluminium Smelting and Metallurgy

By Supply Arrangement

  • Long-Term Contract To Downstream Producer
  • Merchant Spot And Short-Term Sale
  • Captive Internal Transfer
  • Distributor And Trader Supply

By Region

  • North America
  • Western Europe
  • East Asia
  • South Asia and Pacific
  • Latin America
  • Middle East and Africa
  • Eastern Europe

Scope, Methodology, and Coverage

Every figure in this report is reproducible from documented input assumptions. The scope below maps the historical period, the forecast horizon, the segmentation dimensions, and the countries covered, alongside the underlying primary and qualitative methodology.
Historical Period
2020 to 2025
Forecast Period
2026 to 2036
Base Year
2025 (USD billions; MMA Primary Research Dataset, August 2026)
Market Definition
The anhydrous hydrogen fluoride market comprises the production and merchant sale of water-free hydrogen fluoride, valued at producer selling prices to fluorochemical manufacturers, electronics and battery material producers, aluminium smelters, and nuclear fuel converters, and including transfer value of captive internal production. It spans technical grade for general fluorochemical synthesis, electronic grade for semiconductor and display manufacturing, battery grade for lithium electrolyte salt production, aluminium fluoride and metallurgical grade supply, and nuclear grade for uranium conversion, together with the purification, containment, and handling documentation supplied with them. Aqueous hydrofluoric acid solutions of any concentration, downstream fluorochemical products including refrigerants, fluoropolymers, fluoroelastomers, and electrolyte salts themselves, fluorspar mining, beneficiation and trading, calcium fluoride and other fluoride minerals, sulphur hexafluoride and fluorinated gases, and etching, cleaning, pickling, and waste treatment services are excluded.
Quantitative Units
USD billions (current prices); production volume in thousand tonnes and installed capacity
Segmentation Dimensions
By Product Grade; By End-Use Industry; By Supply Arrangement; By Region
Regions Covered
North America, Western Europe, East Asia, South Asia and Pacific, Latin America, Middle East and Africa, Eastern Europe
Countries Covered
China, Mexico, USA, Japan, South Korea, Taiwan, Germany, France, Italy, Netherlands, Spain, UK, India, Australia, Brazil, Argentina, Canada, UAE, Saudi Arabia, Bahrain, South Africa, Kenya, Poland, Czech Republic, Bulgaria, Romania, Turkey, Indonesia, Vietnam, Thailand, and additional markets relevant to this sector
Key Companies Profiled
Honeywell, Solvay, Daikin Industries, Stella Chemifa, Do-Fluoride New Materials, Arkema, Chemours, Gujarat Fluorochemicals, Navin Fluorine International, SRF Limited, Morita Chemical Industries, Zhejiang Sanmei Chemical, Juhua Group, Sinochem Lantian, Yingpeng Chemical, Fubao Group, Buss ChemTech, Fluorsid, Mexichem Fluor, Central Glass
Quantitative Methodology
Primary survey, n=3,800 respondents, Q4 2025, six countries; demand-side model with trade association cross-validation
Qualitative Methodology
47 expert interviews, Q4 2025; applied to validate demand model assumptions, identify emerging dynamics, and assess competitive positioning
Report Format
PDF and XLSX data workbook (Word format preview document)
Publisher
Market Minds Advisory
Report Code
MMA-2026-CHM-344
Published
August 2026
Contact
sales@marketmindsadvisory.com | www.marketmindsadvisory.com

Purchase the full Anhydrous Hydrogen Fluoride Market Report (2026 to 2036).

The full MMA Anhydrous Hydrogen Fluoride report sizes the market across five product grades, five end-use industries, four supply arrangements, and seven regions through 2036. It profiles 20 producers on a consistent basis of merchant hydrogen fluoride production and sale revenue, scoring each on purity capability, fluorspar offtake security, geographic position, and downstream integration. Scenario models quantify how fluorochemical regulation, battery capacity build-out, and mineral supply concentration move both volume and achievable margin by grade. The report also includes fluorspar origin concentration analysis, purity capability mapping by producer, qualification timeline benchmarking for electronic and battery grades, and downstream demand exposure assessment against regulatory proposals.
Five-grade and four-arrangement market sizing to 2036
Twenty-producer benchmark on merchant hydrogen fluoride revenue
Fluorspar origin concentration analysis by mine and country
Purity capability mapping across producers and grade specifications
Qualification timeline benchmarking for electronic and battery grades
Downstream demand exposure assessment against regulatory proposals

Built For The People Who Decide

From boardroom strategy to bench-side execution, this report is read cover-to-cover by leaders shaping the next decade of their industry, turning demand scenarios, market dynamics and valuation benchmarks into decisions.
CXOs/ Presidents/ VPs/ Managers
M&A and Corporate Development
Strategy Teams and R&D Heads
Procurement and Product Directors
Regulatory and Compliance Leaders
Investor Relations and Equity Analysts