
Market Minds Advisory
Acrylamide Market

Acrylamide Market: A Carcinogenic Monomer Nobody Has Replaced

A commercial reading of the polyacrylamide chain's first link, where a monomer classified as probably carcinogenic remains essential to municipal water treatment because nothing available flocculates as effectively at the dose required.

Lead Analyst

Bilal Shaikh

Published

September 2026

Make Smarter Decisions with Customized Research Insights

Request a free sample report and evaluate market opportunities, growth trends, and competitive dynamics relevant to your business needs.

2025 MARKET VALUE$4.1BMarket Size 2025
2036 FORECAST VALUE$7.3BBase Case , 2026 to 2036
CAGR 2026 TO 20365.4 %Bull 6.6% / Bear 4.2%
INCREMENTAL OPPORTUNITY$3.0BNet 10- year value creation
EXPANSION MULTIPLE1.69x2036 value over 2026 base
Strategic Levers
M&A Pipeline
Regional Outlook
Country Rankings
Competitive Intelligence
Segmental Deep-dive
Call-Us : 91 93563 13602

Executive Snapshot and Market Trajectory

Acrylamide is classified as probably carcinogenic to humans and remains essential to treating drinking water for hundreds of millions of people. Nothing available flocculates as effectively at the dose, and the residual monomer limits in treated water are the reason the whole chain is regulated the way it is.
The market stands at USD 4.1 billion in 2025 and reaches USD 7.31 billion by 2036 at a 5.4% CAGR. Water treatment grade acrylamide grows fastest at 7.8%, about 1.44 times the overall rate, as municipal treatment capacity expands and sludge dewatering requirements tighten. East Asia holds 30% of value on Chinese production capacity, while India posts the quickest national growth at 9.2%. Nothing else works at that dose.
Concentration is high, with the top five holding roughly 57% of acrylamide revenue because handling a hazardous monomer requires permits and containment that few producers hold. Two forces pull against each other. Municipal water treatment and sludge volumes keep rising with population and regulation, while enhanced oil recovery demand that once looked like the growth story has become the most cyclical part of the market. The water business is the one that pays every year.
Market Definition
The acrylamide market covers the production and sale of acrylamide monomer, spanning water treatment grade, oilfield and enhanced oil recovery grade, paper and pulp processing grade, mining and mineral processing grade, and electrophoresis and laboratory grade. Polyacrylamide polymers and copolymers, other acrylic monomers including acrylic acid and acrylonitrile, acrylamide formed during food cooking, flocculant formulation and blending services, and water treatment plant equipment and operation are excluded.
Base Year Value
$4.1B in 2025 (MMA Primary Research Dataset, August 2026)
Forecast Period
2026 to 2036, eleven discrete annual values
CAGR
5.4% base case. Bull 6.6%. Bear 4.2%.
Fastest Growth Segment
Water Treatment Grade Acrylamide: 7.8% CAGR
Fastest Growth Country
India: 9.2% CAGR
Fastest Growth Region
South Asia and Pacific: 7.4% CAGR
Largest Region
East Asia: 30% of 2025 global value
Market Leaders
BASF, SNF Group, Mitsubishi Chemical, Kemira, Ecolab. Source: MMA Analysis based on company annual reports.
Primary Survey
n=3,800 procurement and R&D decision-makers, Q4 2025, six countries
Methodology
Demand-side build-up, cross-validated against public data, 47 expert interviews

Acrylamide Market Forecast Scenarios

acrylamide-market-size-forecast-scenario-1787331941946
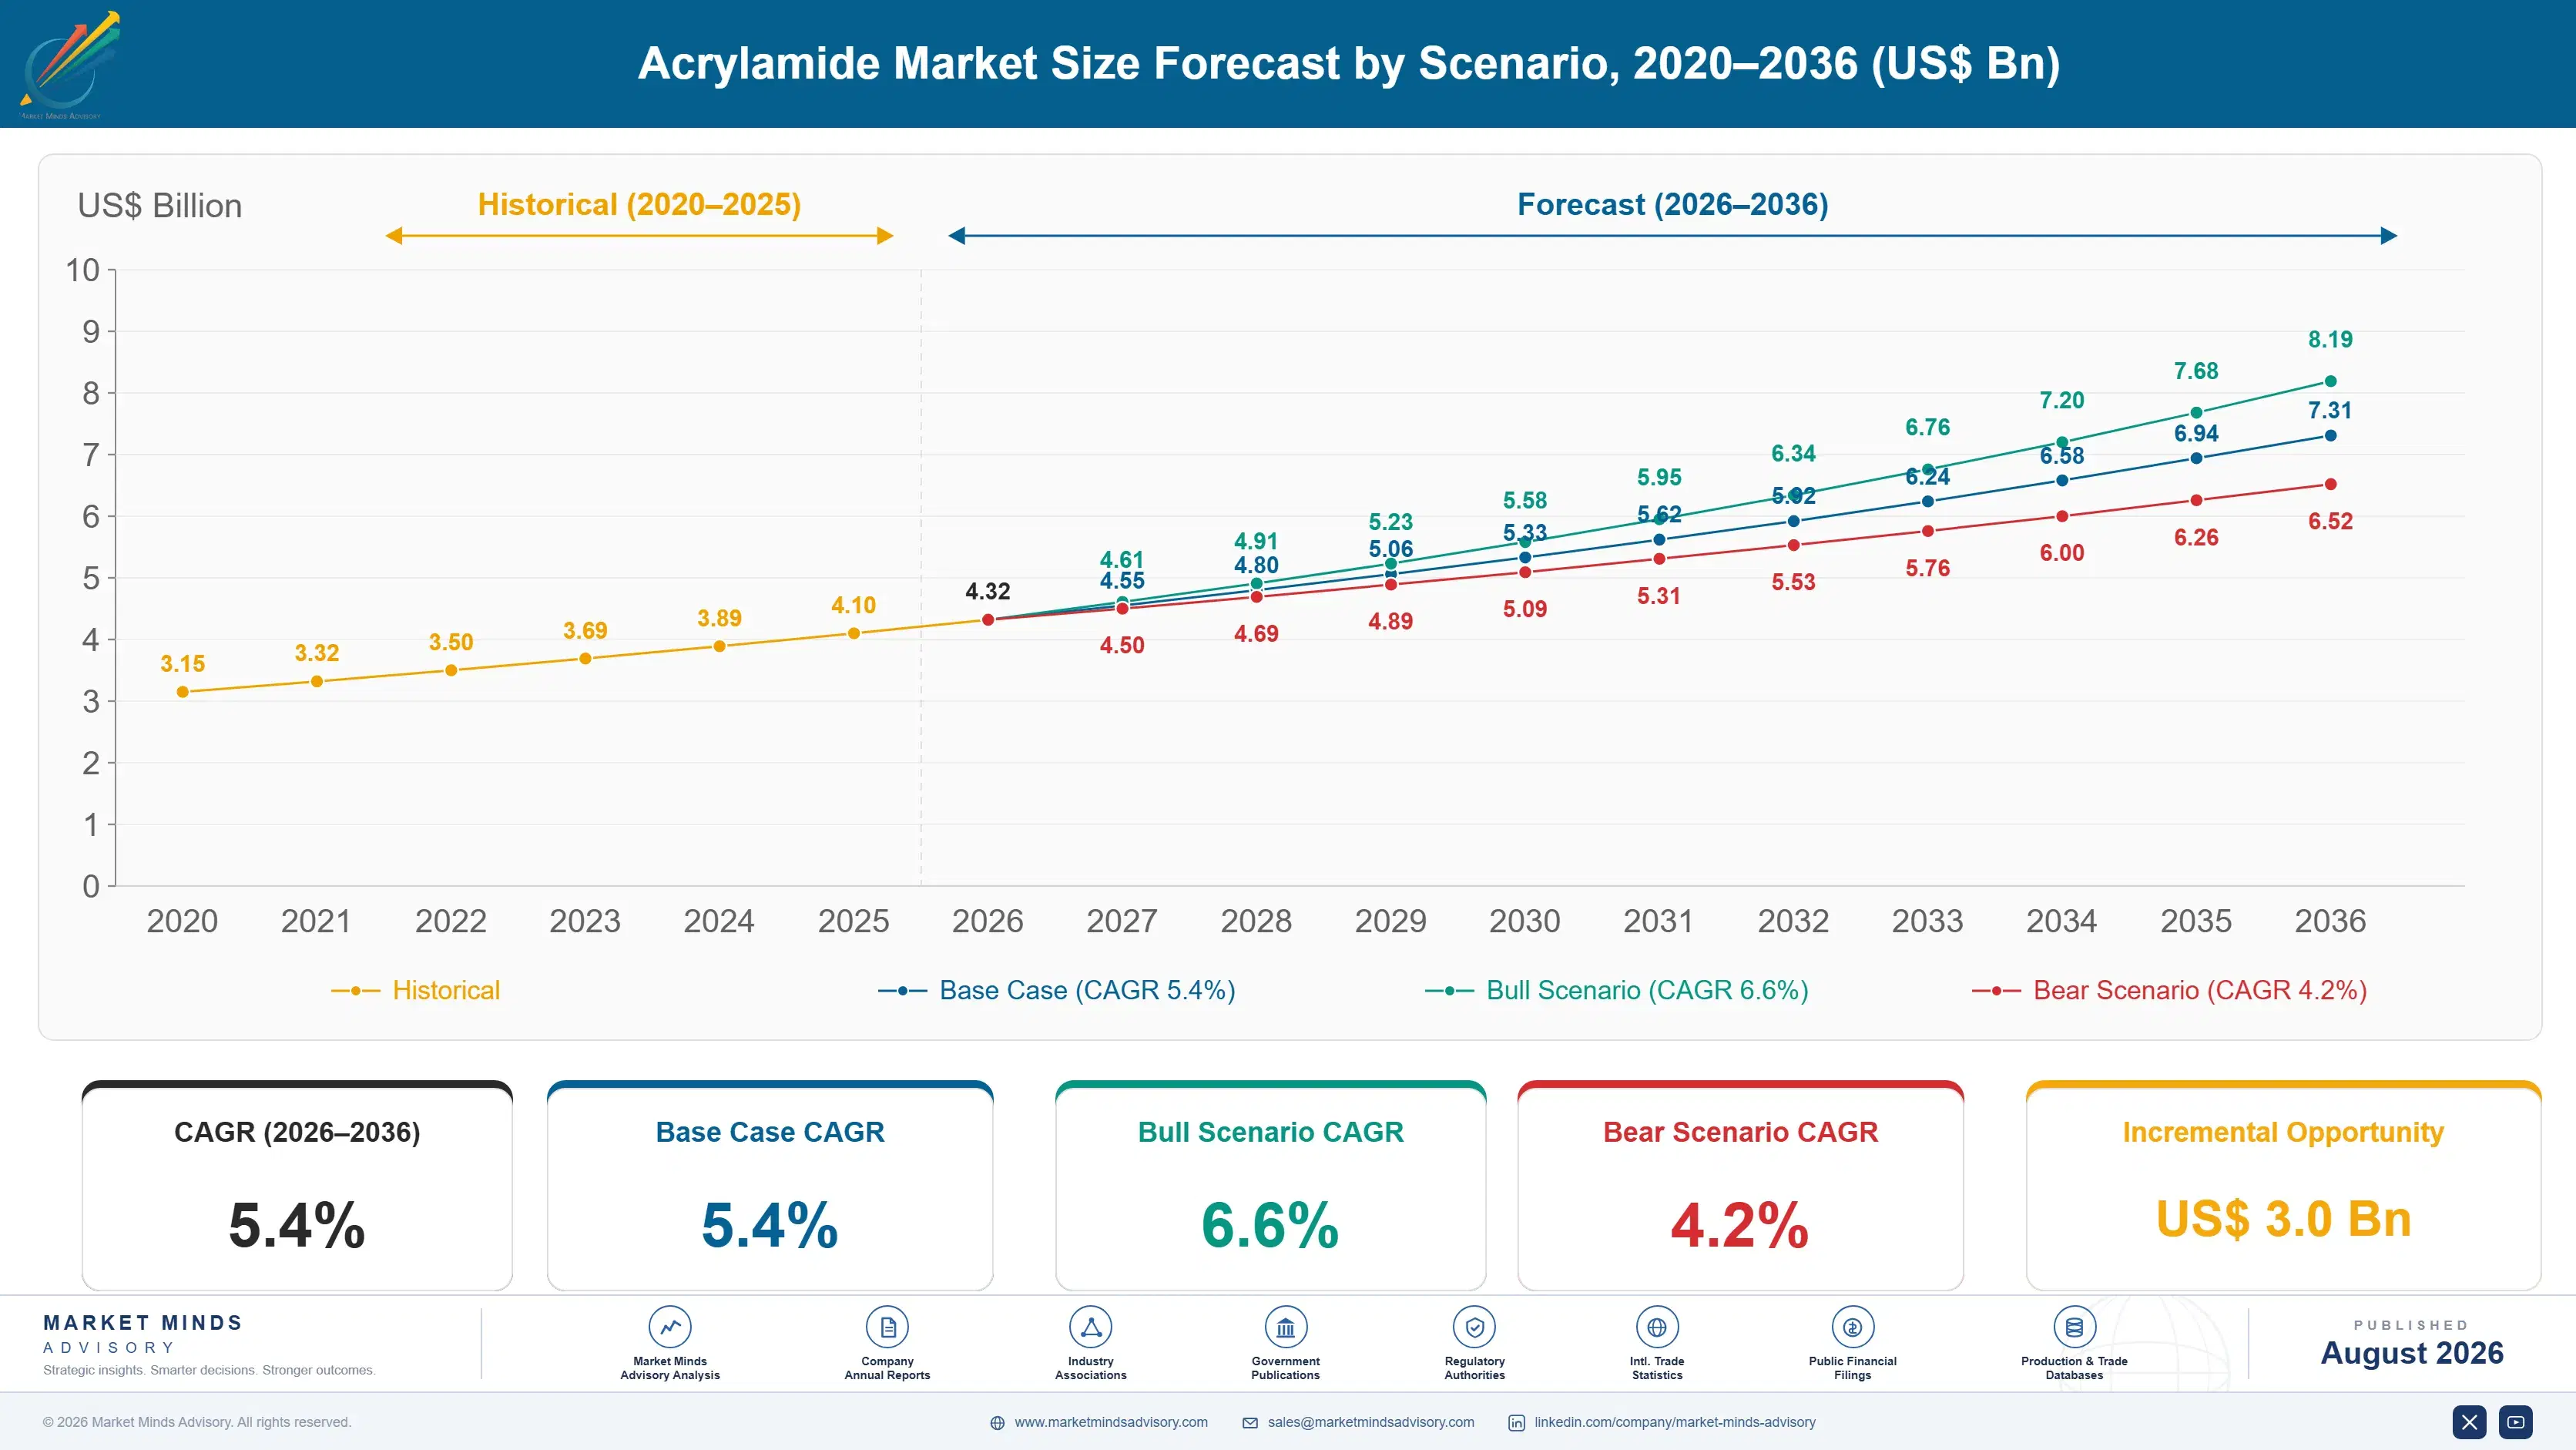
Growth from 2020 to 2025 compounded near 4.4%, and oil price rather than water demand explained the volatility. Enhanced oil recovery consumption collapsed with the 2020 price crash and recovered unevenly, while municipal water treatment volume continued regardless because nobody stops treating drinking water. Chinese capacity additions continued throughout. Residual monomer limits tightened in several jurisdictions without changing demand for the monomer itself.
Three mechanisms carry the base case to 5.4%. First, municipal water and wastewater treatment capacity, where population growth and tightening discharge standards both increase flocculant consumption in ways that do not reverse. Second, sludge dewatering requirements, since disposal cost rises with water content and polyacrylamide is the practical means of reducing it. Third, mining and mineral processing, where tailings management regulation has tightened considerably following several high-profile dam failures. None of the three reverses.
The bull case at 6.6% assumes enhanced oil recovery activity recovers on sustained oil prices and municipal treatment investment proceeds on funded timetables. The bear case at 4.2% assumes oil recovery demand stays weak, Chinese overcapacity drives pricing down across every grade, and residual monomer scrutiny pushes utilities toward alternative flocculants despite inferior performance and higher dose.

Essential, Hazardous, And Very Hard To Replace

Demand rests on three foundations. Municipal water treatment provides the base, since consumption tracks treated volume and nobody stops treating drinking water when economies weaken. Dose efficiency provides the defensibility, because polyacrylamide works at three to ten times lower dose than inorganic alternatives, and nobody has beaten that. And regulation provides the frame, since residual monomer limits govern how the polymer is used rather than whether it is used.
MARKET CONCENTRATIONCR5: 57%Concentrated because hazardous monomer handling requires permits few hold
RESIDUAL MONOMER LIMIT0.025% by weightFree monomer permitted in flocculant dosed to drinking water
ACRYLONITRILE COST SHAREAbout 52%Feedstock as a portion of acrylamide production cost
DOSE EFFICIENCY ADVANTAGE3 to 10 timesLower dose than inorganic coagulant alternatives for equivalent result
PLANT PERMITTING TIMELINE4 to 6 yearsPeriod from investment decision to operating monomer capacity
CAPACITY UTILISATIONAbout 78%Running rate across merchant acrylamide production assets today
Commercially the striking feature is a product that is simultaneously hazardous and irreplaceable. Acrylamide is classified as probably carcinogenic and handled under strict containment, yet free monomer limits in drinking water flocculants sit at 0.025% by weight rather than at zero, because the alternative is worse water. Acrylonitrile feedstock is roughly 52% of production cost and moves on petrochemical markets no producer influences.
The next decade turns on where the growth actually comes from. Enhanced oil recovery was the story for a decade and is now the most cyclical part of the market, tracking oil price rather than technical trend. Municipal water at 7.8% growth is duller and considerably more reliable. Mining tailings regulation has tightened after dam failures, which adds volume policy rather than commodity cycles drives.
"Nobody wants to defend a probably carcinogenic monomer in public, so almost nobody does, and the result is a market that grows quietly on municipal water contracts while everyone talks about enhanced oil recovery. The water business is the one that pays every year."
Director, Water Treatment Chemicals and Specialty Monomers Practice · MMA Chemic

Market Trends

Residual Monomer Scrutiny Tightens Without Removing Demand

Free acrylamide monomer permitted in flocculant dosed to drinking water sits at 0.025% by weight in most regulated markets, and testing regimes have tightened rather than the limit itself moving. That pushes cost onto producers through polymerisation control, monomer scavenging, and batch testing rather than reducing consumption of the monomer at all. Utilities cannot switch away without accepting three to ten times the dose of an inorganic coagulant and worse water quality. Regulation here shapes how the product is made rather than whether it is used. Consumption is unaffected by any of it.
Market Impact: Treated volume grows 3% yearly
Mining Tailings Regulation Adds Policy-Driven Volume

Several catastrophic tailings dam failures prompted regulators and lenders across mining jurisdictions to tighten requirements on dewatering, thickening, and dry stacking, all of which consume polyacrylamide in quantity. That demand is driven by policy and insurance rather than by metal prices, which makes it considerably steadier than the mining capital cycle behind it. Copper, iron ore, and gold processing carry most of the volume. It is also demand nobody in the water treatment business was forecasting five years ago. Insurance and lender conditions rather than metal prices are what drive this volume.
Market Impact: Dose runs 3 to 10 times

Market Opportunities and Growth Drivers

Municipal Water Treatment Consumption Never Falls

Flocculant demand tracks treated water volume, which follows population and urbanisation rather than economic conditions, and no utility stops treating drinking water when budgets tighten. Discharge standards on treated wastewater have also tightened across most regulated markets, which raises dose rather than lowering it. Sludge dewatering adds a second requirement, since disposal cost rises directly with water content and polyacrylamide is the practical means of reducing it. This is the most reliable demand in specialty chemicals and it grows every single year. No competing demand in specialty chemicals is this dependable.
Market Impact: Permitting runs 4 to 6 years

Dose Efficiency Has Never Been Beaten Commercially

Polyacrylamide flocculates at three to ten times lower dose than inorganic coagulants for an equivalent result, which means less chemical handling, less sludge generated, and lower total treatment cost even at a higher unit price. That arithmetic is why a monomer classified as probably carcinogenic remains in municipal drinking water treatment worldwide. Alternatives including chitosan, starch derivatives, and inorganic blends all work and all require considerably more of them. Nobody has closed that performance gap in four decades of trying. That performance gap is why the hazard is tolerated at all.
Market Impact: Demand fell 30% in 2020

Market Restraints and Challenges

Hazard Classification Constrains Permitting And Public Position

Acrylamide is classified as probably carcinogenic to humans and a suspected reproductive toxicant, which means containment, monitoring, worker exposure control, and community consultation that make new capacity a four to six year permitting exercise wherever it is attempted. The root cause is the hazard profile itself rather than any policy choice. Commercially this restricts supply growth and makes the product genuinely difficult to defend publicly. Producers mitigate through closed handling systems, on-site monomer conversion to polymer, and supplying solution rather than crystalline monomer. Public defence of the product is close to impossible.
Market Impact: Limits sit at 0.025% by weight

Enhanced Oil Recovery Demand Tracks Oil Price Alone

Polymer flooding consumption rises and falls with oil price rather than with any technical or regulatory trend, and the 2020 collapse demonstrated how quickly a segment that looked like the growth story can disappear. The root cause is that enhanced recovery is a marginal-barrel economics decision reviewed continuously. Commercially this makes a substantial share of demand genuinely unforecastable. Producers mitigate by weighting capacity toward municipal water and mining, contracting oilfield volume rather than selling spot, and treating recovery demand as upside rather than baseline. Nobody should build capacity against that story.
Market Impact: Failures prompted 3 regulatory revi
4 additional market trends, 3 additional growth drivers, and 2 additional restraints and challenges are covered in the full report. Contact sales@marketmindsadvisory.com to access the complete intelligence.

Segment CAGR and Growth Architecture

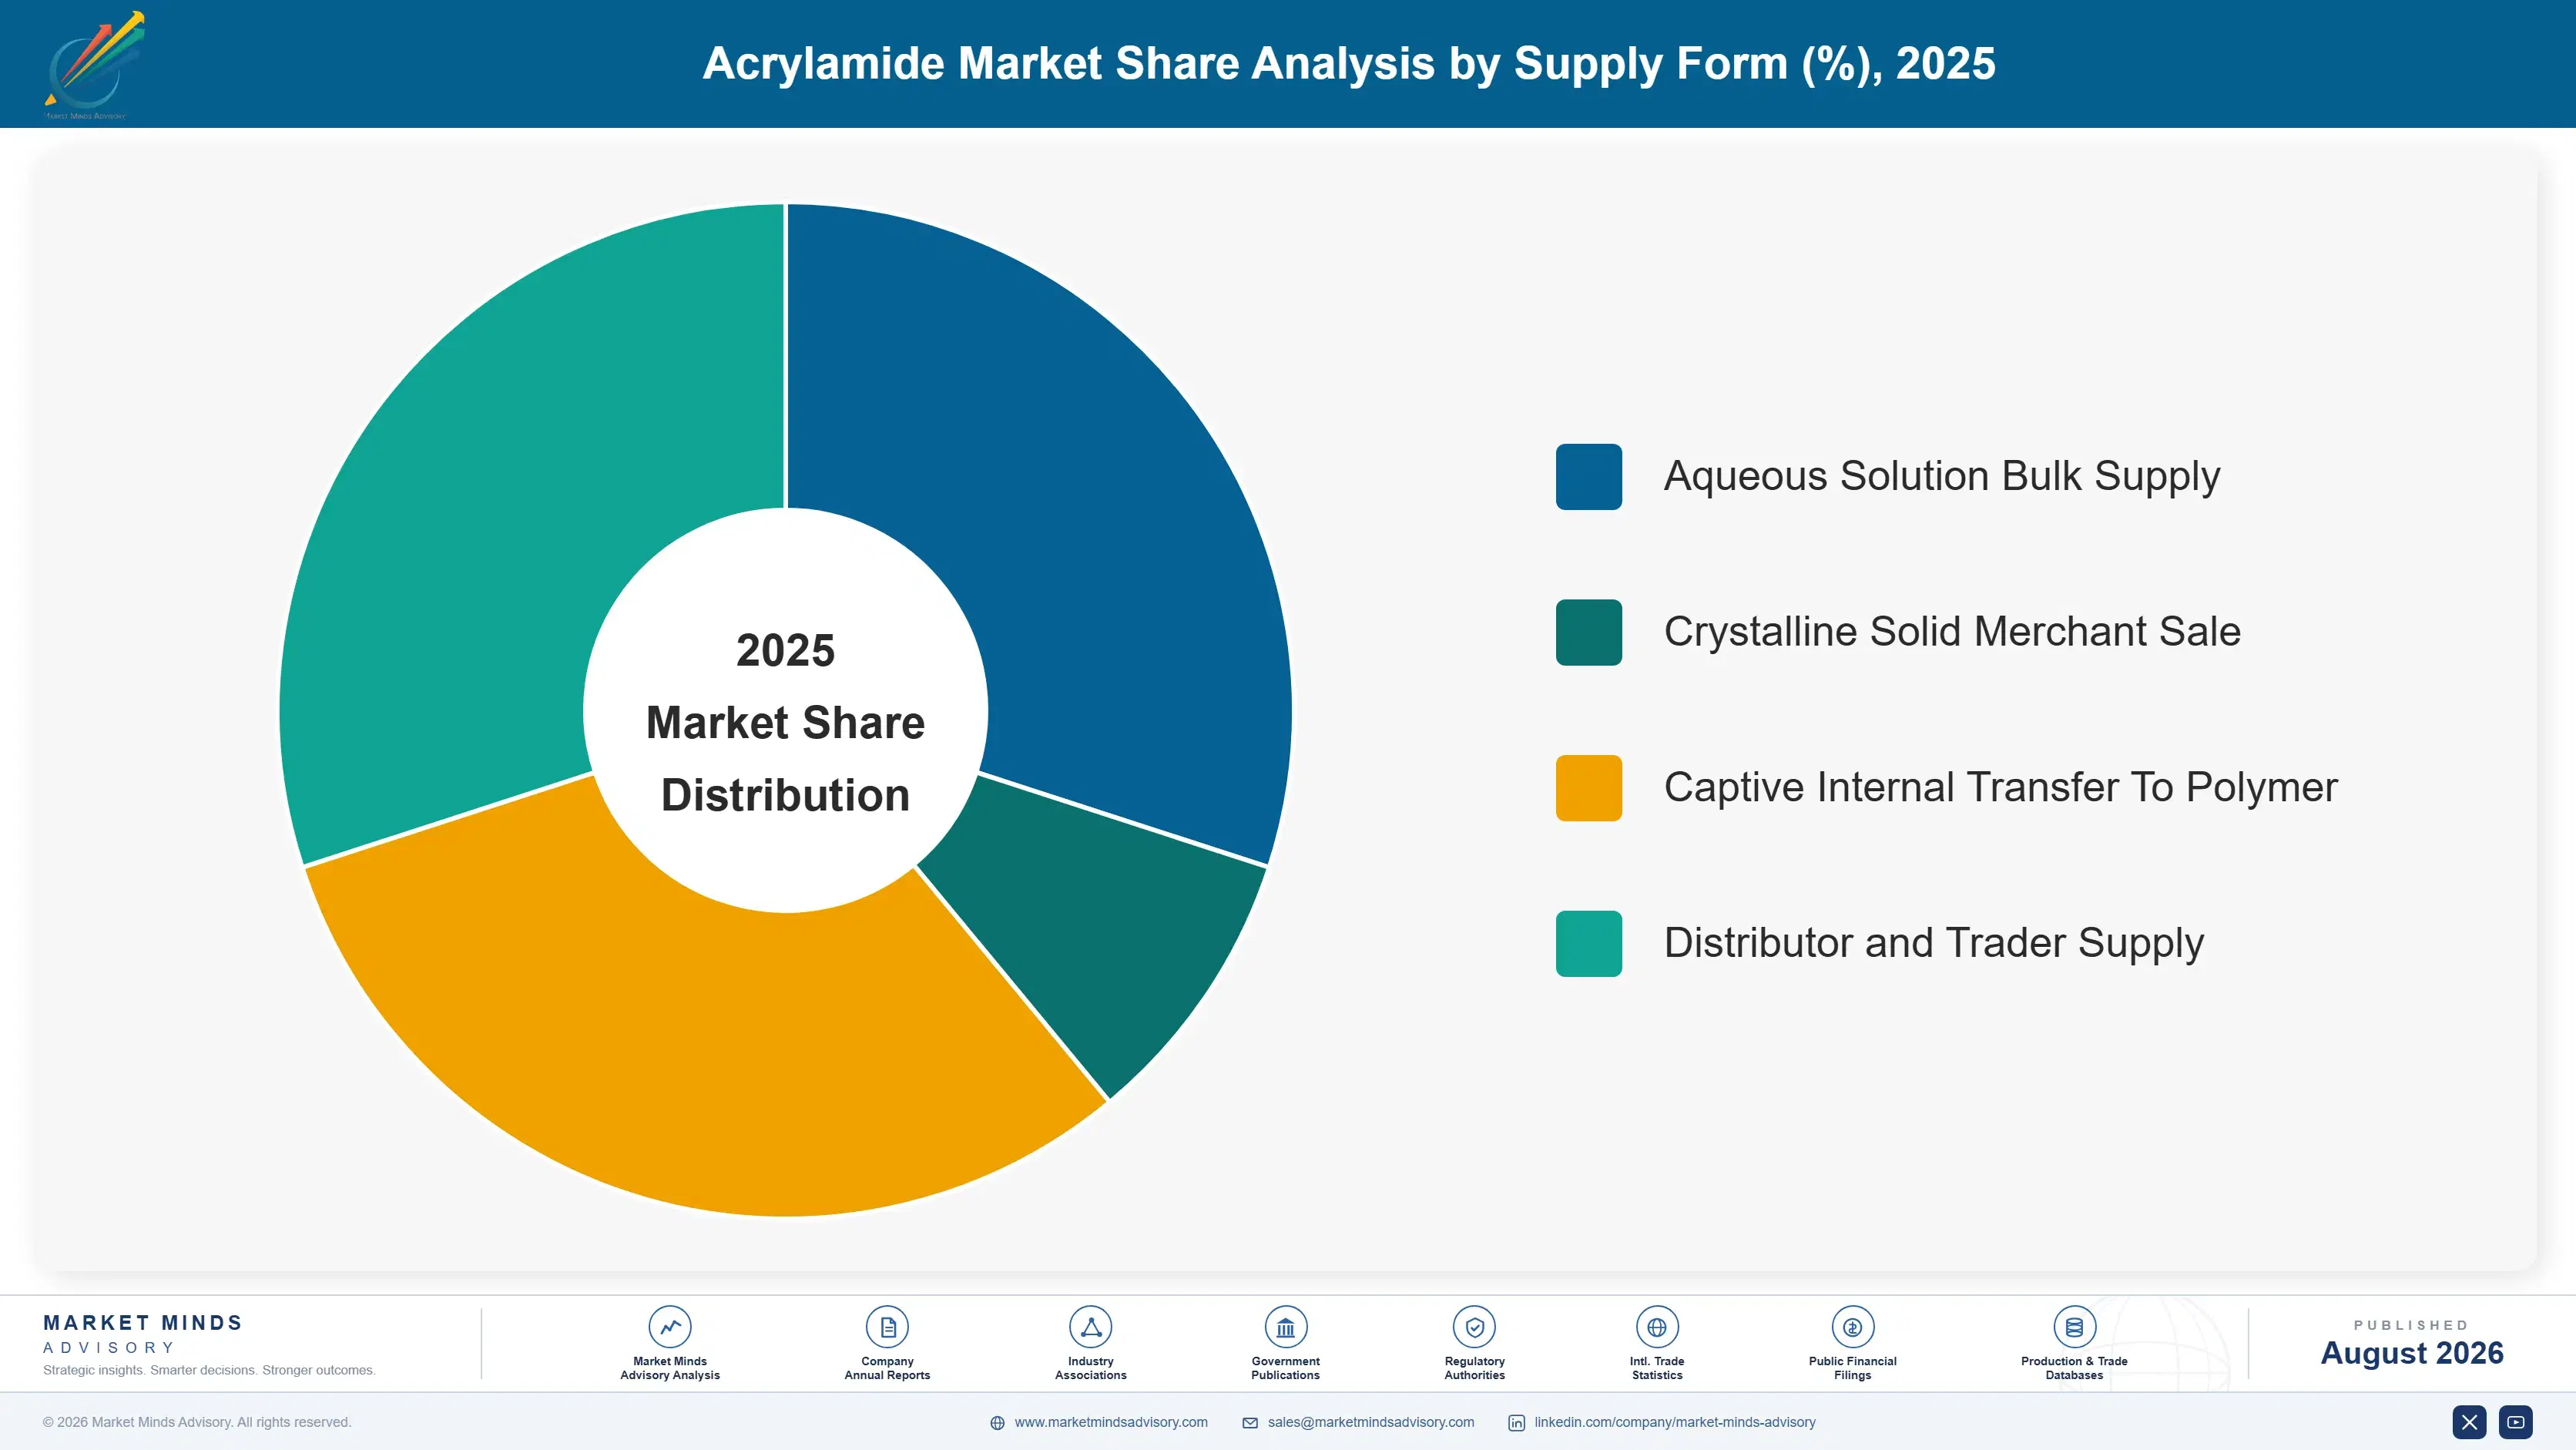
Segmentation follows application grade, a single classification describing the purity specification and approval status the monomer is produced to. Each grade carries its own residual limits, regulatory approval, handling requirement, and price position, so economics track the specification rather than the polymer made from it. End-use industry and supply form appear separately within the framework as their own distinct dimensions.
acrylamide-market-market-share-analysis-1787331942479

Water Treatment Grade Acrylamide

Water treatment grade acrylamide grows fastest at 7.8%, about 1.44 times the overall 5.4% rate, and municipal capacity rather than any technical change drives it. Treated water volume follows population and urbanisation, discharge standards keep tightening, and sludge dewatering requirements rise with disposal cost, so consumption grows every year regardless of economic conditions. Residual free monomer must stay below 0.025% by weight in drinking water flocculants, which pushes cost onto polymerisation control and batch testing rather than reducing demand. Approval for potable water use is a real barrier and it takes years to obtain in each jurisdiction separately. Consumption grows every year whether or not anybody wants to discuss the hazard publicly.
CAGR 7.8%

Mining and Mineral Processing Grade

Mining and mineral processing grade grows at 6.2%, the second-fastest specification, and tailings regulation rather than metal prices explains most of it. Dam failures prompted regulators and project lenders across mining jurisdictions to require dewatering, thickening, and dry stacking, all of which consume polyacrylamide heavily and none of which reverses when commodity prices fall. Copper, iron ore, and gold processing carry the bulk of that volume. Purity requirements are considerably looser than potable water grade, which widens the qualified supplier list and puts more pricing pressure on this grade than on treatment work. Regulation and project finance rather than commodity prices are what actually created this demand stream in the first place.
CAGR 6.2%
Full segment breakdown across 5 segments available in the complete report.

Regional Architecture and Country Demand Map

Production capacity and water treatment investment together set this distribution rather than population. East Asia leads on Chinese monomer capacity, while South Asia and Pacific grows quickest as municipal treatment infrastructure is built for the first time across very large populations. Approvals decide who supplies the water volume.

North America

North America holds 24% of value across municipal water treatment, shale oilfield use, and mining processing in roughly that order of reliability. Federal water infrastructure funding has released steadily if slower than announced, and municipal contracts run through utilities that buy flocculant on approved product lists rather than on spot pricing. Shale oilfield demand is the volatile element, tracking rig counts and completion activity rather than any water trend. Potable water approvals here are demanding and take years to obtain. Growth of 4.8% reflects steady municipal expansion against oilfield volatility that averages out over a cycle. Approved product lists rather than open competitive tenders govern nearly all municipal purchasing here.
Share: 24% | CAGR: 4.8% (2026 to 2036)

Western Europe

Regulation shapes this market more than volume growth does. Western Europe holds 22% of value, with urban wastewater treatment requirements among the strictest anywhere and residual monomer limits enforced through utility testing rather than assumed from supplier declarations. Sludge disposal cost is very high, which makes dewatering performance a genuine operating economics question rather than a compliance one. Energy costs since 2022 have disadvantaged European monomer production against Asian and American plants. There is essentially no enhanced oil recovery demand. Growth of 3.9% is the slowest of the seven regions, reflecting mature treatment capacity throughout. Verification by utility testing rather than by supplier declaration is now standard practice right across the region.
Share: 22% | CAGR: 3.9% (2026 to 2036)
Regional intelligence for 5 additional markets available in the complete report: East Asia, South Asia and Pacific, Latin America, Middle East and Africa, Eastern Europe. Contact sales@marketmindsadvisory.com.
acrylamide-market-country-cagr-analysis-1787331942990

Where Acrylamide Producers Hold Position

Selling monomer on acrylonitrile cost plus a margin is the weakest position available in this chain. The four moves below reach ground feedstock pricing cannot touch: potable water approvals, downstream polymer integration, feedstock security, and weighting capacity toward the demand that does not disappear. None of the four is a price argument, and each takes years.

Hold Potable Water Approvals In Every Target Jurisdiction

Approval for use in drinking water treatment takes years to obtain in each jurisdiction separately, requires residual monomer control below 0.025% by weight, and is verified by utilities through their own testing rather than accepted on a supplier declaration. That barrier is the reason water treatment grade earns better than mining or oilfield material despite identical chemistry upstream. Producers holding a full approval set supply the demand that never falls. Those without them are confined to the cyclical grades and price accordingly. The approval set rather than the chemistry is the whole barrier.
Market Impact: Approvals require residual monomer

Integrate Forward Into Polymer Rather Than Selling Monomer

A hazardous monomer sold merchant carries transport, containment, and liability exposure that converting it on site avoids entirely, and the polymer captures value the monomer never does. Producers who polymerise internally also control residual monomer directly rather than relying on a customer's process. Acrylonitrile is roughly 52% of monomer cost and passes through regardless, so the monomer margin is thin by construction. Forward integration is capital intensive and it is the only route out of feedstock-plus pricing that actually exists. Merchant monomer margin is thin by construction rather than by any competition.
Market Impact: Feedstock accounts for about 52% of

Contract Acrylonitrile Supply Rather Than Buying Spot

Acrylonitrile is roughly 52% of production cost and moves on petrochemical markets driven by propylene and ammonia that no acrylamide producer influences at all. Long-term contracts with indexation convert that swing into a mechanical adjustment rather than a margin gamble taken every quarter. Producers integrated back into acrylonitrile hold a genuine cost advantage, which is why the largest players tend to be the ones who are. Buying spot in a tight market is how small producers lose a year of earnings. Spot buying in a tight market removes a year of earnings.
Market Impact: Acrylonitrile drives roughly 52% of

Weight Capacity Toward Water, Not Oil Recovery

Enhanced oil recovery demand fell roughly 30% in 2020 and recovered unevenly, because polymer flooding is a marginal-barrel decision reviewed continuously against oil price. Municipal water treatment consumption grows every year regardless of economic conditions because nobody stops treating drinking water. Producers who built capacity against the oil recovery story in the last decade have spent years operating below rated output. Treating recovery volume as upside rather than baseline is the difference between a stable business and a cyclical one. Capacity built against the oil recovery story has idled for years.
Market Impact: Recovery demand fell roughly 30% in

Who Controls the Margin Pool

Concentration is high: the top five hold roughly 57% of acrylamide revenue, because handling a probably carcinogenic monomer requires permits, containment, and liability capacity that few producers hold. The gap between leaders and challengers is potable water approval breadth and downstream integration rather than reaction chemistry, which is well documented. All participants here are assessed on one basis, revenue from acrylamide monomer production and sale, excluding polyacrylamide polymers,
Competition runs along four lines. First, potable water approval breadth, since those approvals gate the demand that never falls. Second, downstream polymer integration, which captures value the monomer alone cannot. Third, acrylonitrile position, because feedstock is over half of cost. Fourth, containment and handling capability, which decides whether a producer can supply merchant monomer at all in a given jurisdiction.

Pressure is building from two directions. Chinese capacity exports aggressively into every region at prices Western plants struggle to match on identical chemistry. Meanwhile residual monomer scrutiny raises the cost of serving the potable water demand that carries the best margin. Rankings should favour producers with broad water approvals and downstream integration over those selling merchant monomer on feedstock-plus pricing alone.
acrylamide-market-company-positioning-matrix-1787331943507

Competitive Moat and Risk Dimensions

BASF

Moat: Integration depth and approval breadth

BASF holds acrylonitrile integration, acrylamide production, and downstream polyacrylamide capability within one chain, which captures value at every stage rather than selling monomer at feedstock plus a margin. Its potable water approvals span most regulated jurisdictions and took years to accumulate. Containment and handling capability meets standards that smaller producers cannot economically match on a hazardous monomer.
BASF

Risk: European cost base exposure

European production carries energy and compliance costs that Chinese and American plants do not, on chemistry where cost position matters considerably. Acrylamide sits inside an enormous portfolio and competes internally for capital against businesses with faster payback. Chinese exporters also price aggressively into the mining and oilfield grades where approval barriers provide no protection whatsoever.
SNF GROUP

Moat: Polyacrylamide scale and water focus

SNF is the largest polyacrylamide producer globally and converts most of its acrylamide internally, which removes merchant monomer exposure entirely and captures the full chain margin. Its focus on water treatment and oilfield polymers rather than a diversified chemical portfolio means acrylamide investment competes against nothing else internally. Potable water approval depth across jurisdictions is genuinely extensive.
SNF GROUP

Risk: Single chain and oilfield exposure

Concentration in one chemistry chain means a regulatory move against acrylamide reaches the entire business rather than one division of it. Oilfield polymer exposure carries the cyclicality that municipal water does not, and the 2020 collapse demonstrated how quickly that reverses. Chinese producers competing on both monomer and polymer also pressure pricing in the grades where approvals offer no shelter.

Players Tracked

Prominent Players

BASF
SNF Group
Mitsubishi Chemical
Kemira
Ecolab

Other Key Players

Solenis
Ashland
Arkema
Shandong Baomo Biochemical
Anhui Jucheng Fine Chemicals
Zhengzhou Tianchang
Beijing Hengju
Jiangxi Changjiu
Aoyou Chemical
Black Rose Industries
Zibo Xinye Chemical
Chinafloc
Kolon Life Science
Nitto Chemical
Diamond Chemical

Recent Developments

FEBRUARY 2025

Utility testing regimes tighten on residual monomer verification

Water utilities in several regulated markets extended independent verification of residual acrylamide in delivered flocculant rather than accepting supplier declarations, following inconsistencies found in batch testing. These were procurement and compliance changes rather than commercial transactions, and they raised the cost of serving potable water demand without reducing it.
Signal: Verification moving from supplier declarat
AUGUST 2024

Mining tailings requirements extend dewatering obligations further

Regulators and project lenders across several mining jurisdictions extended dewatering, thickening, and dry stacking requirements following continued attention to tailings dam safety. These were regulatory and financing conditions rather than corporate events, and they added polyacrylamide consumption that commodity price cycles do not remove. Consumption rises with each requirement.
Signal: Policy-driven mining demand now behaves fa
APRIL 2024

Chinese acrylamide capacity expansions continue despite soft pricing

Chinese producers advanced further acrylamide and polyacrylamide capacity additions despite utilisation across the industry sitting well below rated levels, supported by integrated acrylonitrile supply and domestic treatment demand. These were organic capacity expansions rather than acquisitions, and they extended export pressure into every other region.
Signal: Capacity added into a soft market caps pri

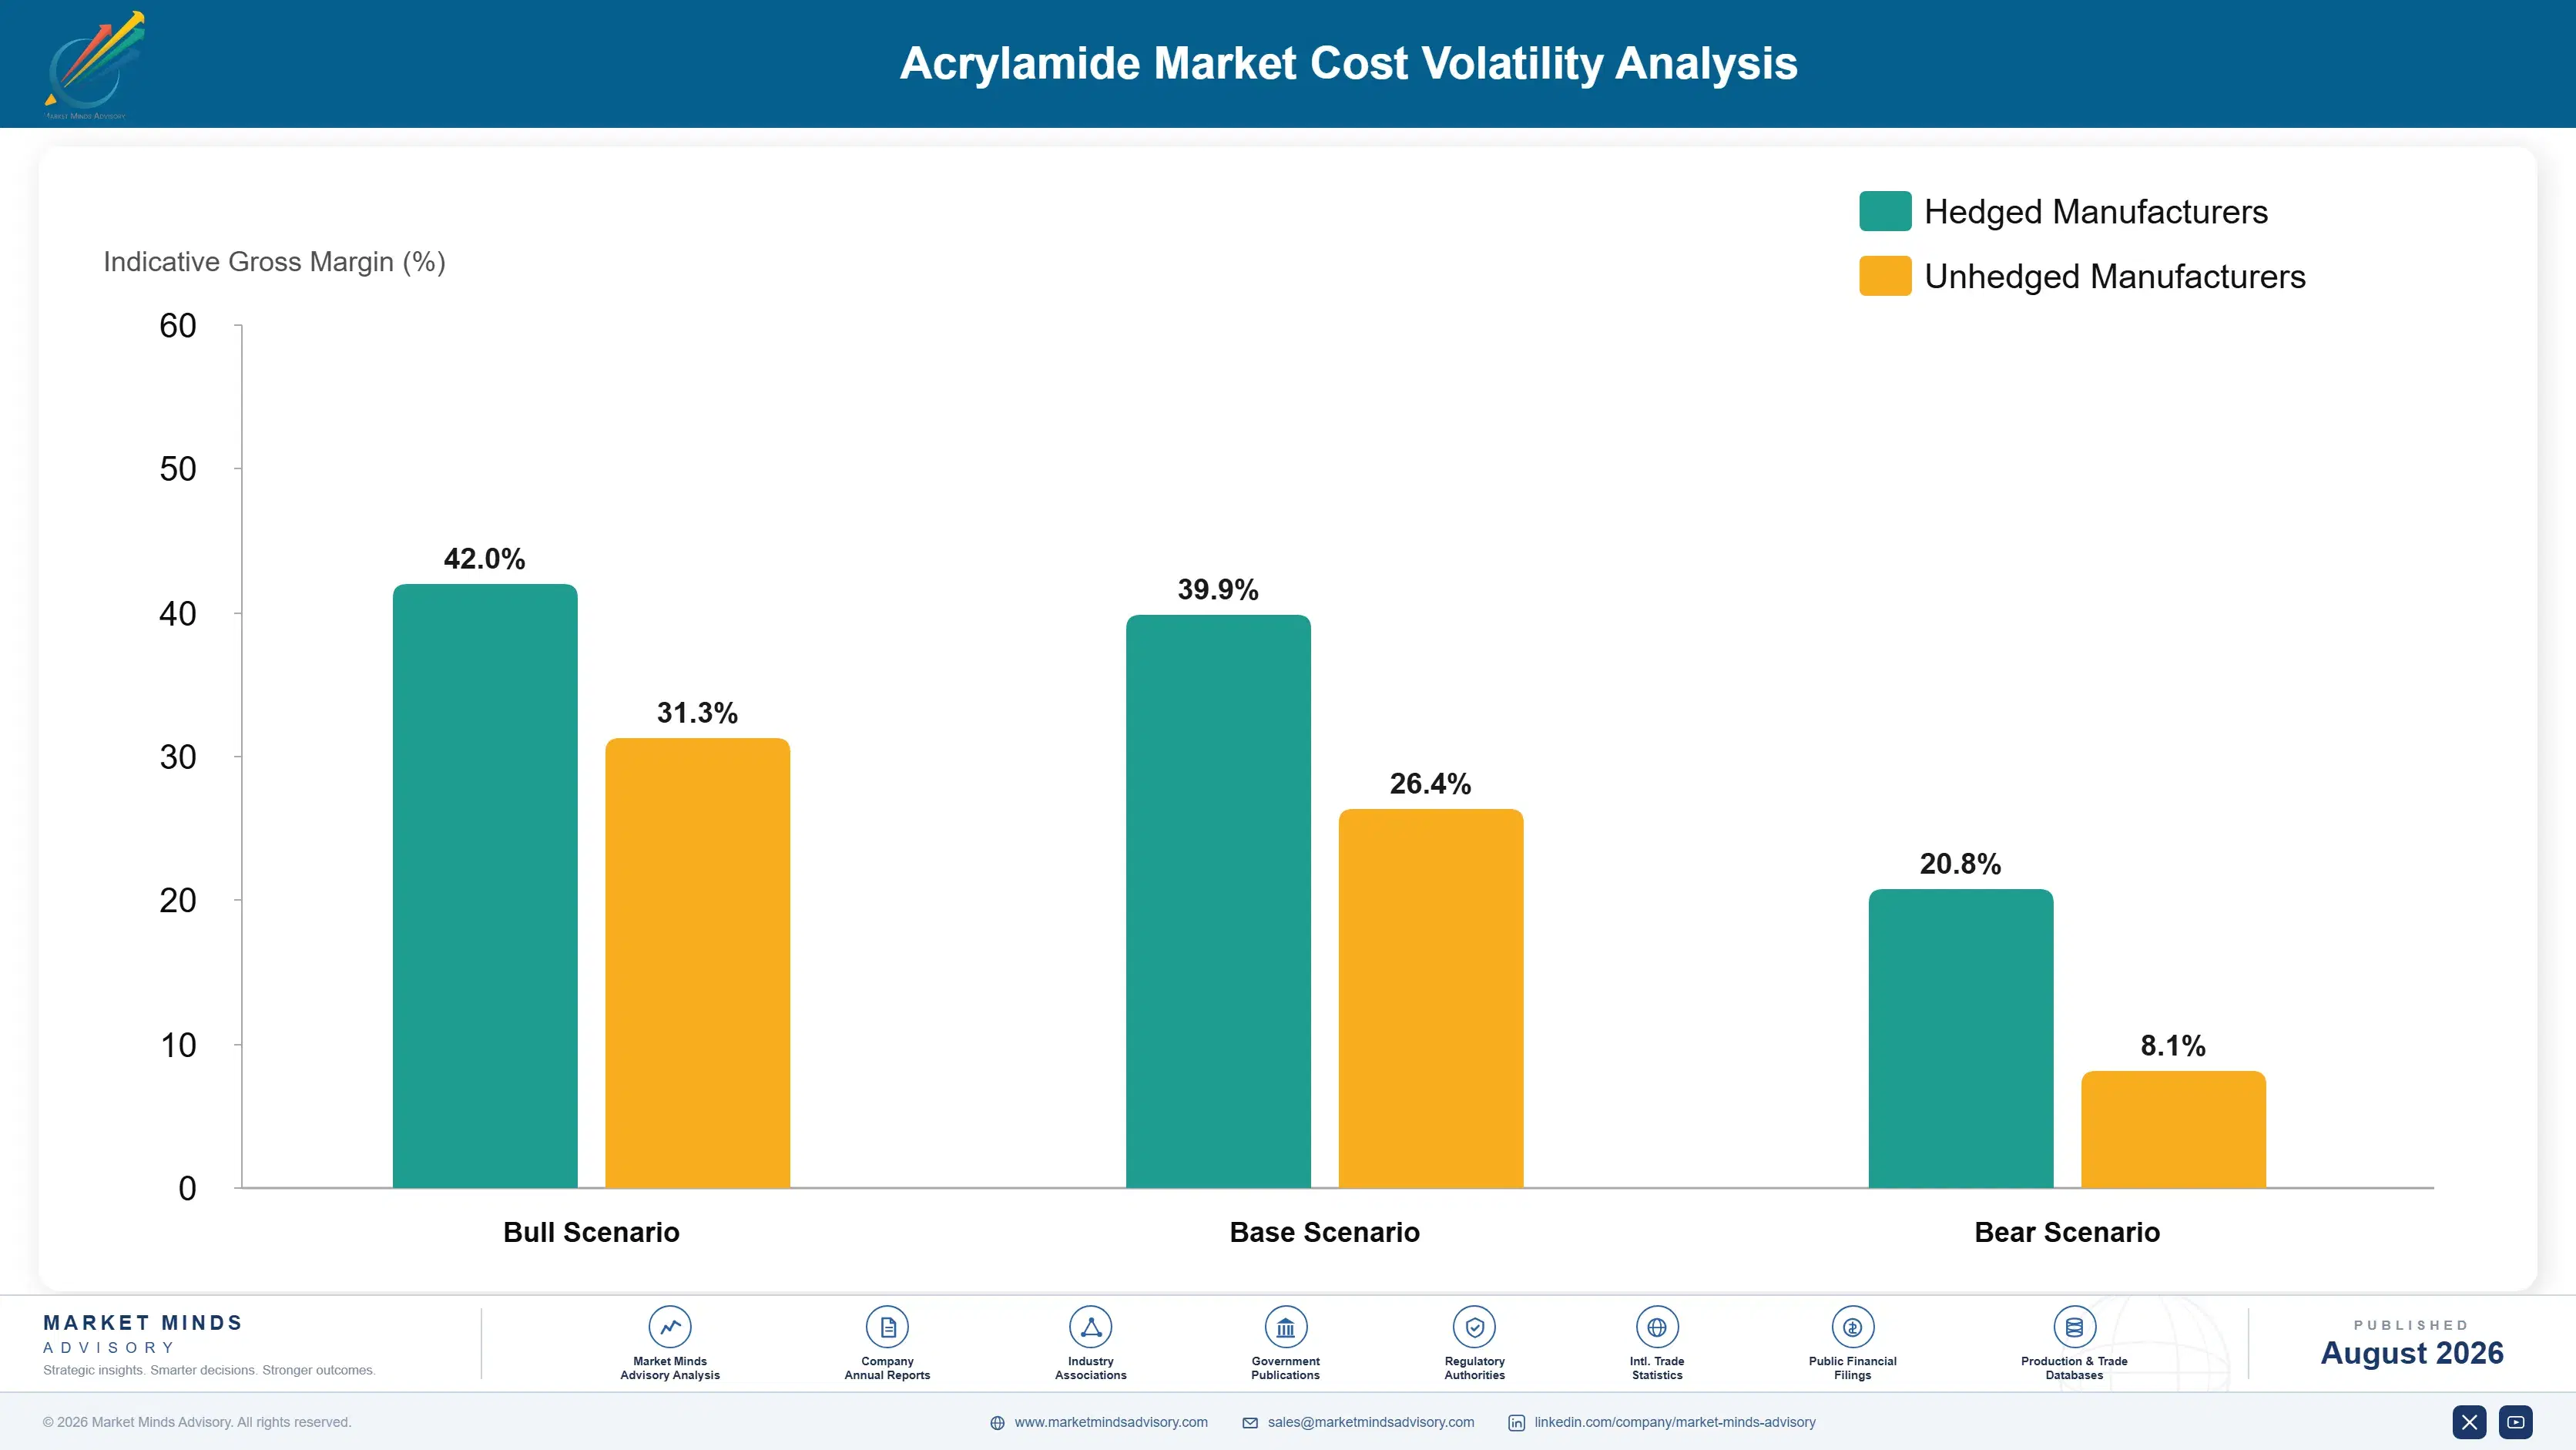
Acrylonitrile, Catalyst, Energy, Containment

One feedstock dominates this cost sheet completely. Acrylonitrile runs roughly 52% of production cost, purchased on contracts indexed to propylene and ammonia that no acrylamide producer influences. Catalyst and process chemicals add 8% to 14%, energy for hydration and crystallisation 12% to 18%, and containment, monitoring, waste treatment, and worker exposure control a further 10% to 16% because the product is classified as probably carcinogenic.
Acrylonitrile pricing rose steeply through 2021 and 2022 on propylene and ammonia costs, and ammonia in particular moved with European gas, so the whole chain tightened at once. BASF and Mitsubishi Chemical both disclosed raw material cost pressure across those reporting periods, and IEA analysis recorded European industrial gas at several times prior-year levels. Utilities on annual contracts resisted mid-term increases, which left producers absorbing the difference.

Exposure separates by feedstock integration rather than by scale. A producer integrated back into acrylonitrile controls the largest cost element internally, while one buying on the merchant market carries whatever propylene and ammonia do that quarter. Geography compounds it, since Chinese producers combine integrated acrylonitrile with lower energy and compliance costs, and supply mining and oilfield grades at prices no Western plant can approach on identical chemistry.
acrylamide-market-cost-volatility-analysis-1787331943703

Index every customer contract to published acrylonitrile benchmarks

Feedstock is over half of cost and moves on markets no producer influences, so a fixed annual price is a gamble rather than a position. Indexation converts that swing into a mechanical adjustment instead. Utilities resist it more firmly than industrial customers because their budgets are set annually, so it usually lands on mining and oilfield volume first.

Integrate backward into acrylonitrile where volume justifies it

Buying the dominant input on the merchant market caps cost position permanently and leaves a producer exposed to petrochemical cycles unrelated to water treatment. Integration removes that and gives a durable advantage the largest producers already hold. The capital requirement is very substantial and only justified above a volume threshold that most regional producers will never reach.

Convert monomer on site rather than shipping it merchant

Shipping a probably carcinogenic monomer carries transport permits, containment requirements, liability exposure, and jurisdictional restrictions that on-site polymerisation avoids entirely. Converting where the monomer is made also gives direct control of residual levels rather than depending on a customer's process. The trade-off is that polymer freight costs more than monomer freight per unit of active ingredient shipped.

Portfolio Architecture for Margin Defence

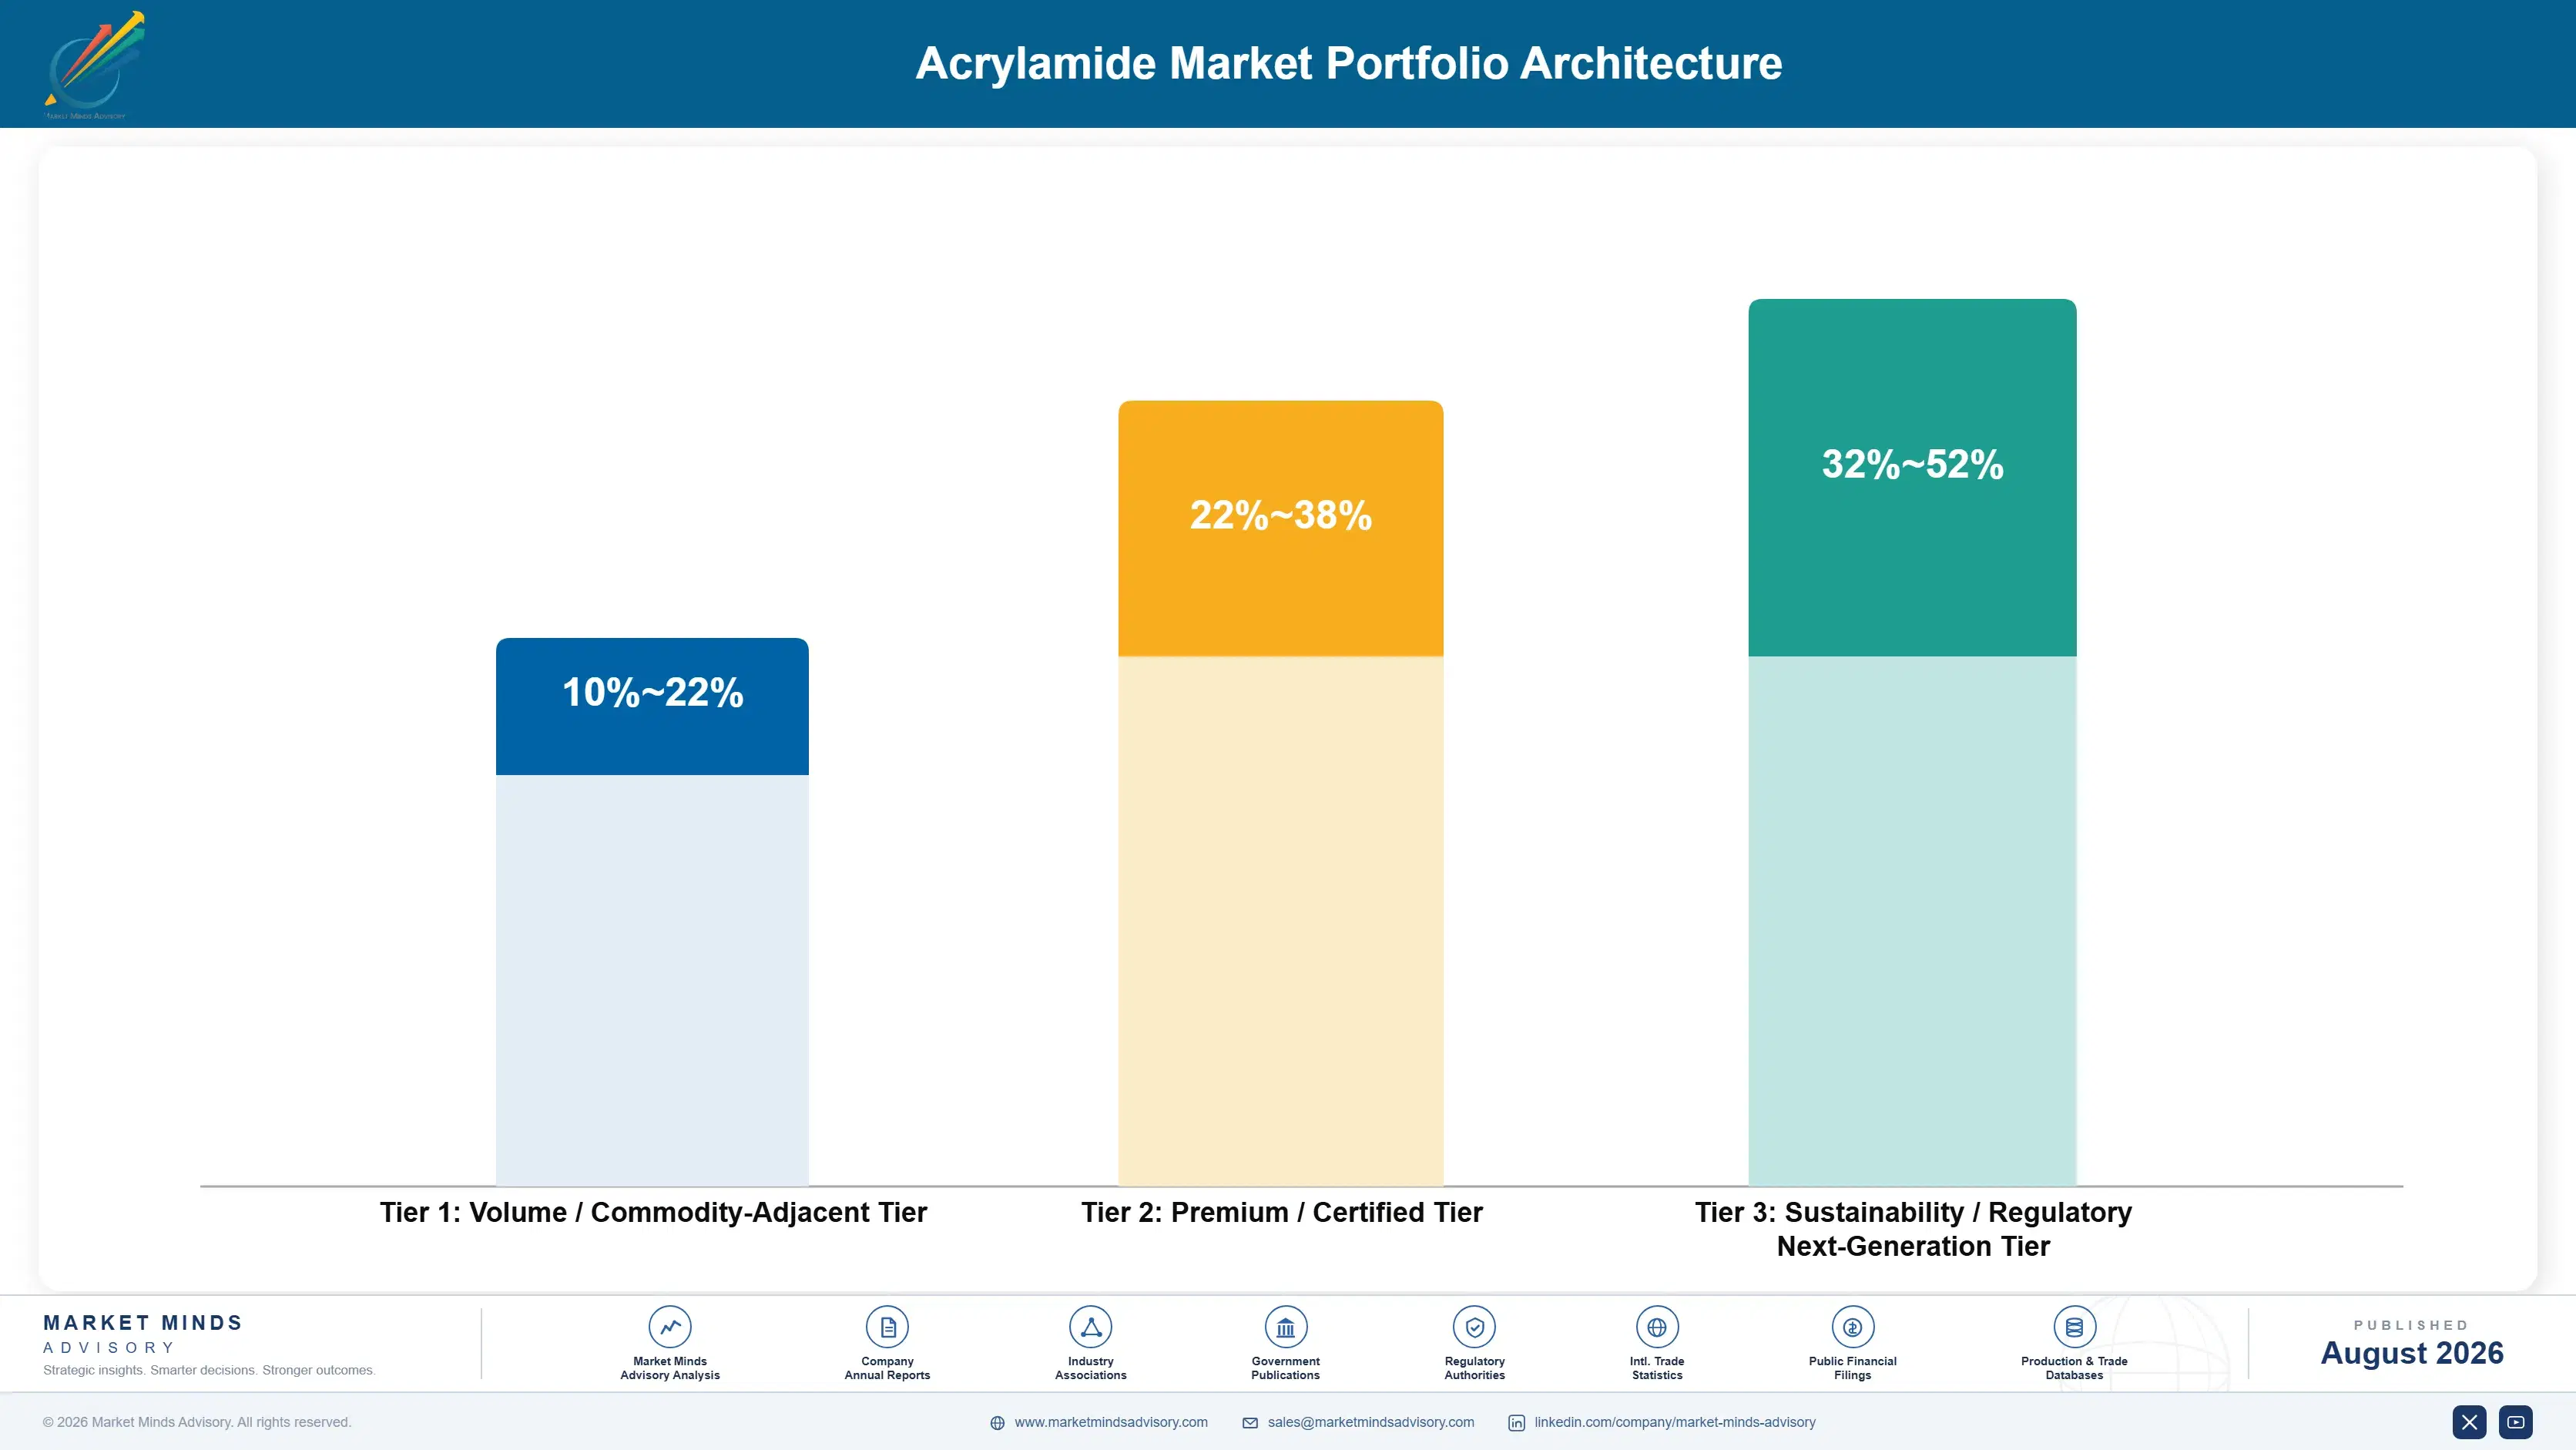
The portfolio splits into three tiers with different economics. Mining and oilfield grades form the volume tier, where purity requirements are loose, approvals provide no barrier, and Chinese supply sets the price everybody works inside. Water treatment grade earns considerably more because potable approval and residual monomer control narrow the field. Electrophoresis and specialty grades price against purity scarcity rather than any competing quotation.
The tension runs between volume grades that fill the reactor and approved water grade that earns the return. Mining and oilfield material keeps hydration capacity loaded, absorbs committed acrylonitrile contracts, and maintains the distributor relationships through which approved work sometimes arrives. Yet it competes against Chinese supply on cost no Western plant can match. Producers handling this well accept thin volume margin while directing effort toward approval breadth and downstream conversion.

High-value pools concentrate where approval or purity limits competition: potable water grade with a full jurisdictional approval set, electrophoresis and laboratory material at very high purity, monomer converted on site into polymer, and specialty copolymer feedstock. All four escape the feedstock-plus comparison. Mining grade sits at the other end, where the specification is loose and the tender resets pricing every year.

Volume / Commodity-Adjacent Tier

Mining, mineral processing, and oilfield grade monomer sold on acrylonitrile cost plus a margin. The range is wide because feedstock integration and regional energy cost separate producers enormously at identical selling prices.
Gross Margin: 10-22%

Premium / Certified Tier

Water treatment grade carrying potable approvals, residual monomer control, and utility verification records. The range is wide because approval breadth varies by producer and only some jurisdictions enforce testing rigorously.
Gross Margin: 22-38%

Sustainability / Regulatory / Next-Generation Tier

Electrophoresis and laboratory grade at very high purity, low-residual polymer systems, and on-site converted monomer. The range is wide because purity scarcity supports pricing while conversion capacity carries substantial capital charge.
Gross Margin: 32-52%
acrylamide-market-portfolio-architecture-1787331944198

High-value Sub-segments and Strategic Watch-out

Water Treatment Grade Acrylamide

High value and high growth at 7.8%, the fastest grade, because treated water volume rises with population and nobody stops treating drinking water. Potable approval in each jurisdiction takes years to obtain, which is the barrier that protects the pricing here. Consumption does not fall in downturns.
Gross Margin: 22-38%

Mining and Mineral Processing Grade

High volume with strong growth at 6.2% on tailings dewatering requirements that regulation and project lenders now impose. Purity requirements are loose, which widens the qualified supplier list and hands pricing power to whoever has the lowest cost base. Nothing sold into this grade is genuinely differentiated.
Gross Margin: 12-26%

Oilfield and Enhanced Recovery Grade

The volume core in capacity terms, growing at only 3.2% and tracking oil price rather than any technical trend. Demand fell roughly 30% in 2020 and recovered unevenly, which makes it the least forecastable element of any producer's order book. Treating it as baseline volume is a mistake.
Gross Margin: 10-24%

Electrophoresis and Laboratory Grade

The strategic watch-out, growing at 4.6% on life science research consumption that is small, high-margin, and entirely dependent on research funding cycles. Purity requirements are extreme and the qualified supplier list is correspondingly very short. Research funding cycles rather than any industrial demand entirely decide it.
Gross Margin: 32-52%

How Approved Supply Positions Hold

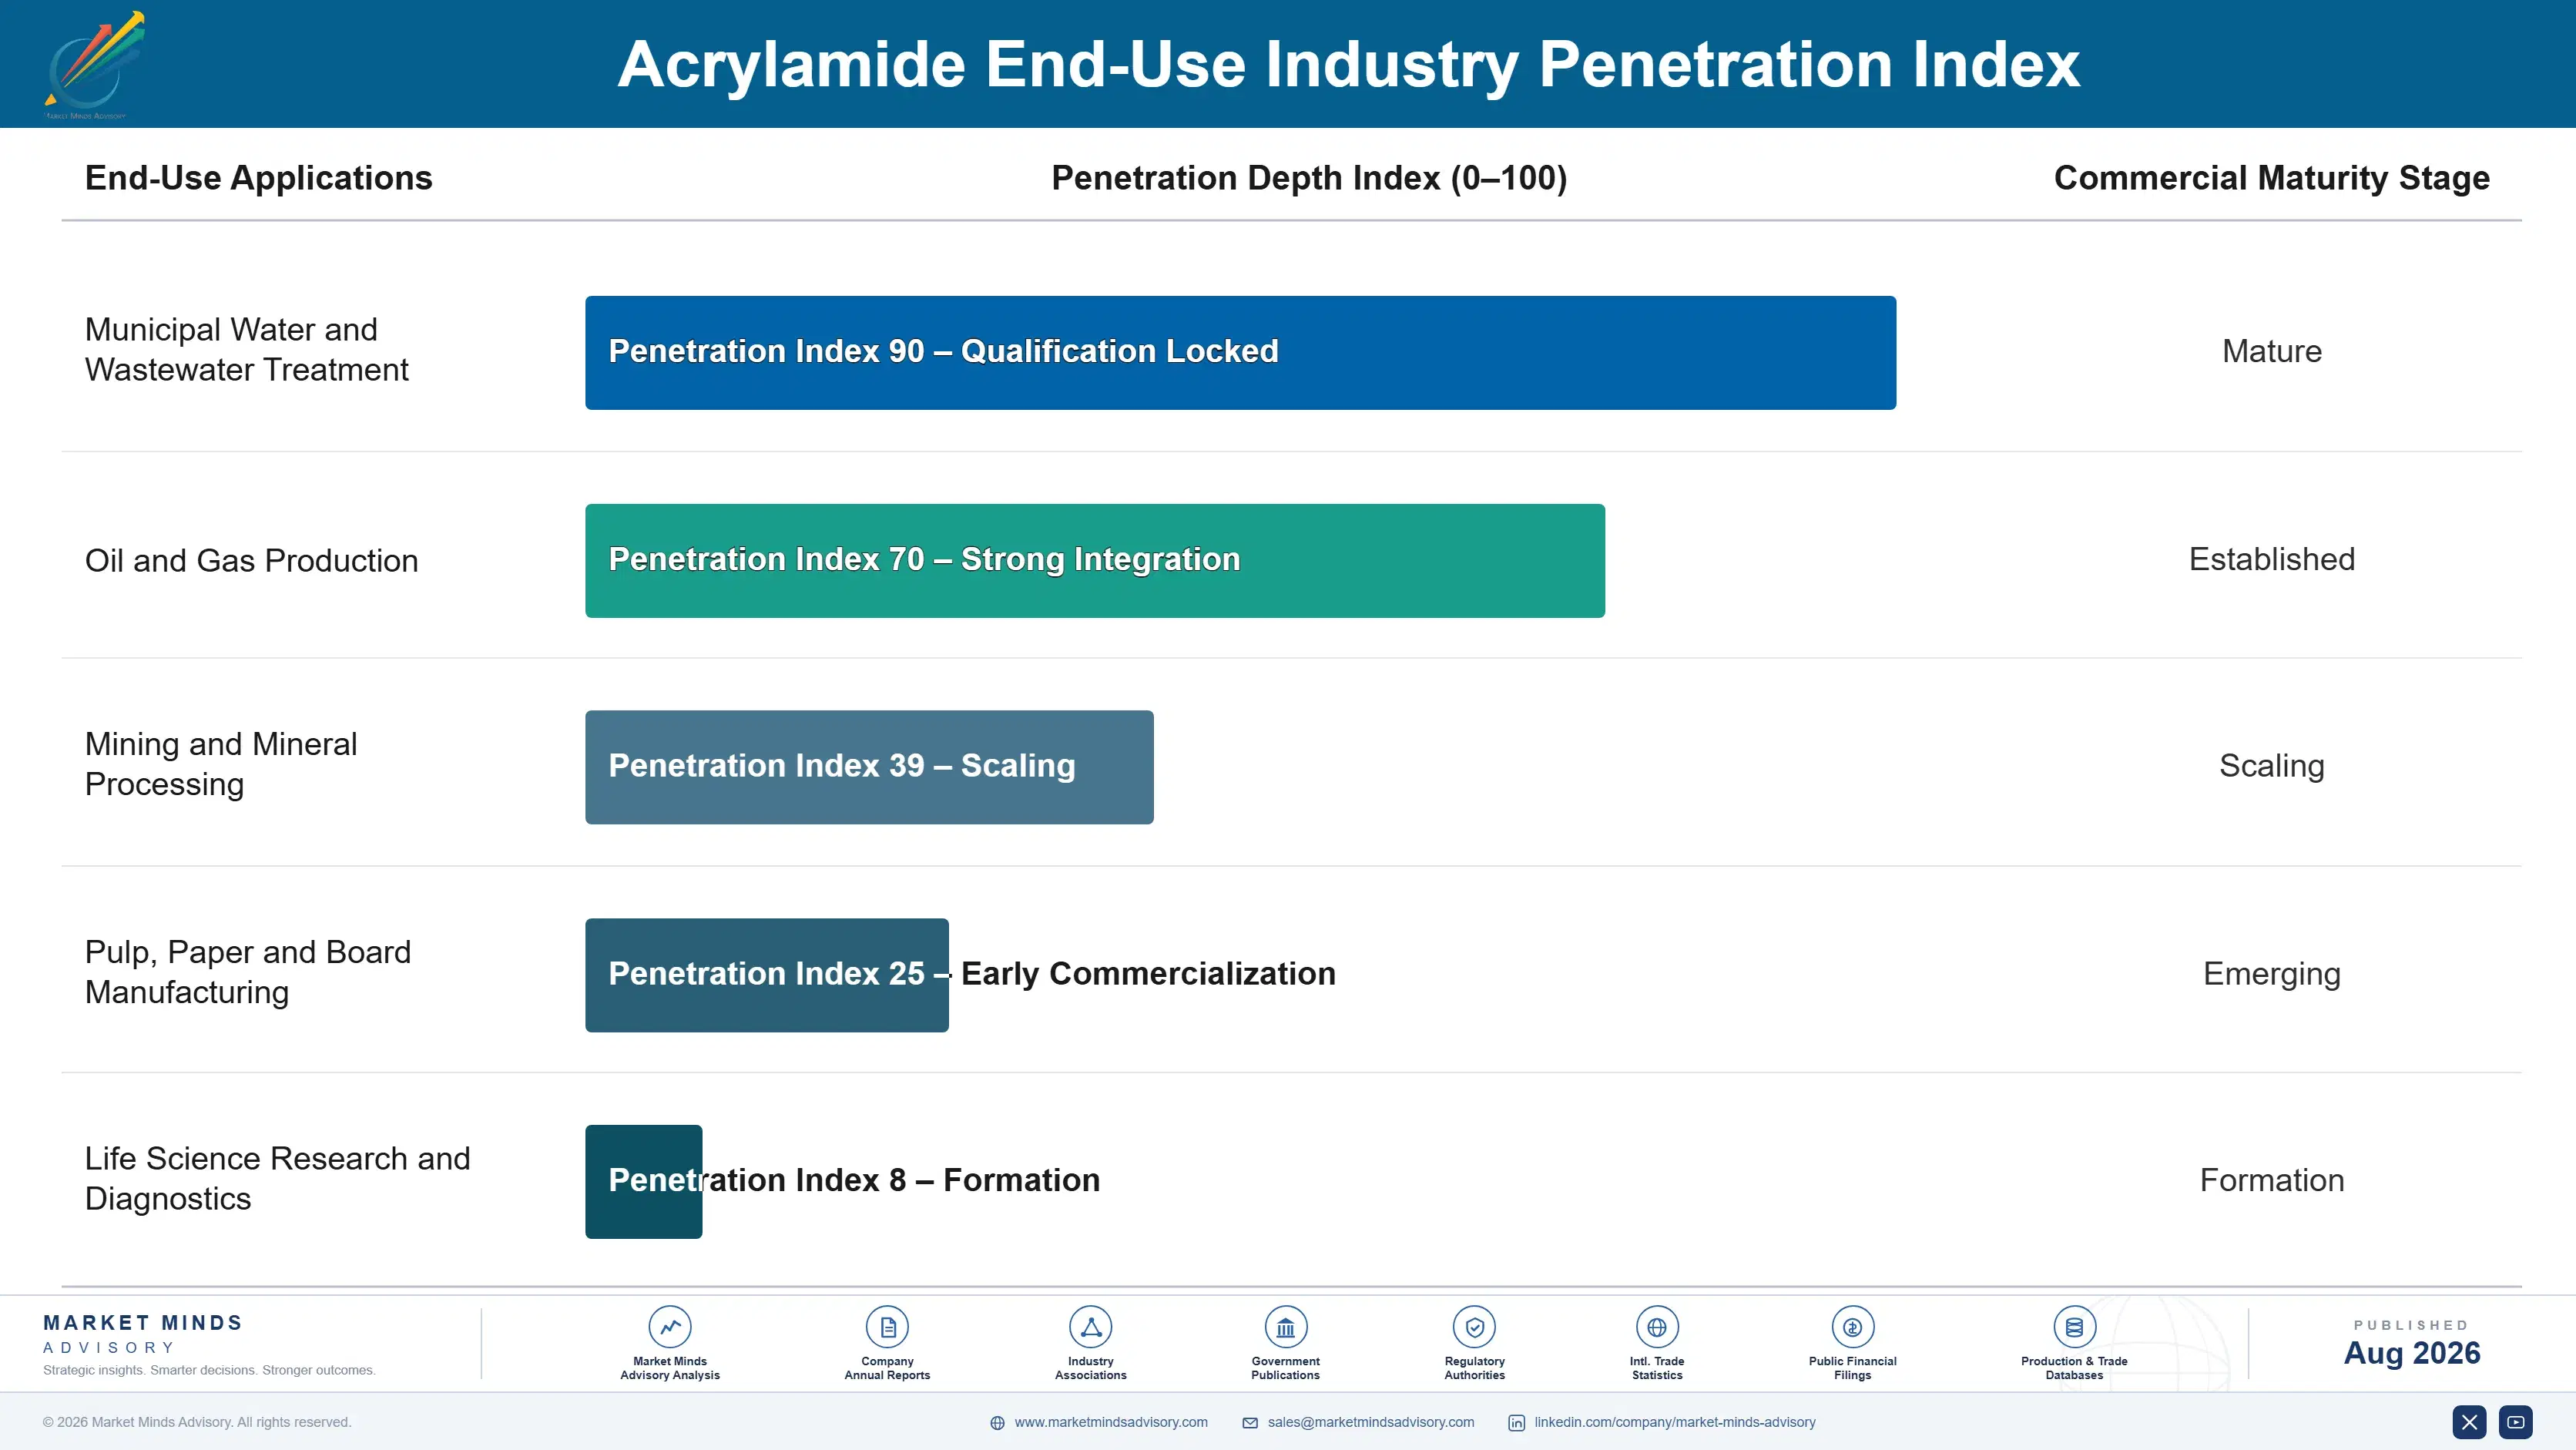
Demand commits at approval and repeats as contracted tonnage. A producer approved for potable water use has passed residual monomer verification, toxicological review, and increasingly utility batch testing, and no water authority reopens that casually. That protects incumbents strongly across multi-year municipal contracts. The genuine competitive moments are a new treatment plant coming online, a contract retender, and any residual finding that removes a supplier from an approved list.
Stickiness varies by approval depth and hazard consequence. Potable water grade sticks hardest, since a utility that has verified residual control will not reopen it without cause. Electrophoresis grade sticks through purity qualification in protocols. Mining grade sticks least, moving on price at every tender because the specification is loose and a dozen producers meet it. Oilfield volume sticks only while the field economics do.

Buyer profiles have moved from procurement teams buying a commodity monomer toward utility technical functions, regulatory affairs, and increasingly public accountability. A probably carcinogenic input in drinking water attracts attention no purchasing manager wants. That change rewards producers bringing verification data, residual control evidence, and approval breadth, and penalises those still competing on delivered price where approval is the actual gate.
acrylamide-market-end-use-penetration-index-1787331944687

Our Call On Acrylamide

These are among the four positions where our research anticipates prominent divergence between winners and laggards over the coming forecast period. Each is grounded in the demand model, the regulatory perimeter, and the announced capacity pipeline.
01 / POTABLE APPROVAL BREADTH

Approvals gate the demand that never falls

Approval for drinking water treatment takes years in each jurisdiction separately, requires residual free monomer below 0.025% by weight, and is increasingly verified by utility testing rather than accepted on a supplier declaration. That barrier is the only reason water treatment grade earns better than mining material despite identical upstream chemistry. Producers holding a full approval set supply consumption that grows every year regardless of economic conditions, and those without them are confined to the cyclical grades entirely, priced accordingly.
02 / FORWARD POLYMER INTEGRATION

Merchant monomer is feedstock cost plus very little

Acrylonitrile is roughly 52% of production cost and passes through regardless, which means the merchant monomer margin is thin by construction rather than by any competition. Shipping a probably carcinogenic monomer around also carries transport permits, containment obligations, and liability exposure that on-site conversion avoids completely. Converting internally captures the polymer margin and gives direct control of residual levels rather than depending on a customer's process, which is precisely why the largest players in this chain all do exactly that.
03 / WATER OVER OIL WEIGHTING

Recovery demand disappeared once and will again

Enhanced oil recovery consumption fell roughly 30% in 2020 and recovered unevenly, because polymer flooding is a marginal-barrel economics decision reviewed continuously against the oil price rather than any technical trend. Municipal water treatment consumption grows every year simply because nobody stops treating drinking water when budgets tighten. Producers who built capacity against the oil recovery story have operated well below rated output for years, and treating that volume as upside rather than as baseline is the whole difference here.
04 / FEEDSTOCK CONTRACT DISCIPLINE

Fixed pricing on a passed-through input is a gamble

Acrylonitrile represents roughly 52% of production cost and moves on propylene and ammonia markets that no acrylamide producer influences in any way whatsoever. A fixed annual price on that basis is a margin gamble taken every quarter rather than a commercial position that anybody chose deliberately. Indexation converts that swing into a mechanical adjustment instead, though utilities resist it far more firmly than industrial buyers because their own budgets are set annually and cannot absorb any mid-year movement at all.

Engagement Snapshot From the Field

A live engagement with an industry participant carrying material or product regulatory and market exposure ahead of a defining policy shift, showing how our research translates into a defensible multi-year portfolio strategy.
MARKET MINDS ADVISORY · CLIENT ENGAGEMENT SUMMARY
Acrylamide Producer Strategic Portfolio Review and Transition Roadmap 2026·Investment Scenario on Acrylamide Exposure Evaluation 2025-26
CLIENT PROFILE
A municipal water utility group serving eleven million people engaged MMA after independent testing found residual acrylamide above expectation in delivered flocculant from one approved supplier. The client reported four approved suppliers, annual flocculant spend of about USD 31 million, and no batch verification programme of its own at any of its plants (client-reported, unverified by MMA).
STRATEGIC CHALLENGE
Removing the supplier would leave three sources for a product with no substitute at the required dose, and the finding raised the question of whether the other three had ever been verified either. Public disclosure obligations complicated the timing considerably. The board needed to know the extent of the problem before it became a reported incident rather than a procurement matter.
MMA APPROACH
MMA arranged independent residual monomer testing across all four suppliers and multiple batches rather than accepting supplier certificates, which the client had relied on entirely. We traced each product back to its monomer producer, since two suppliers sourced from the same plant. We then assessed what alternative flocculants would cost at the dose actually required, because the substitution question had never been quantified properly.
KEY FINDINGS
  1. Two of four suppliers sourced monomer from the same producer, so apparent supplier diversity provided no real protection against a single upstream problem (client-reported, unverified by MMA).
  2. Residual levels varied more between batches from one supplier than between suppliers, which pointed to polymerisation control rather than monomer quality across the sampled batches.
  3. Inorganic coagulant alternatives required roughly 4.5 times the dose and generated substantially more sludge, which made the total cost considerably worse rather than better.
  4. No plant held any batch verification capability, so the finding had emerged from an external test rather than from any process the client controlled.
CLIENT PROFILE
A municipal water utility group serving eleven million people engaged MMA after independent testing found residual acrylamide above expectation in delivered flocculant from one approved supplier. The client reported four approved suppliers, annual flocculant spend of about USD 31 million, and no batch verification programme of its own at any of its plants (client-reported, unverified by MMA).
STRATEGIC CHALLENGE
Removing the supplier would leave three sources for a product with no substitute at the required dose, and the finding raised the question of whether the other three had ever been verified either. Public disclosure obligations complicated the timing considerably. The board needed to know the extent of the problem before it became a reported incident rather than a procurement matter.
MMA APPROACH
MMA arranged independent residual monomer testing across all four suppliers and multiple batches rather than accepting supplier certificates, which the client had relied on entirely. We traced each product back to its monomer producer, since two suppliers sourced from the same plant. We then assessed what alternative flocculants would cost at the dose actually required, because the substitution question had never been quantified properly.
KEY FINDINGS
  1. Two of four suppliers sourced monomer from the same producer, so apparent supplier diversity provided no real protection against a single upstream problem (client-reported, unverified by MMA).
  2. Residual levels varied more between batches from one supplier than between suppliers, which pointed to polymerisation control rather than monomer quality across the sampled batches.
  3. Inorganic coagulant alternatives required roughly 4.5 times the dose and generated substantially more sludge, which made the total cost considerably worse rather than better.
  4. No plant held any batch verification capability, so the finding had emerged from an external test rather than from any process the client controlled.
RECOMMENDED STRATEGY
Phase 1: Phase 1 (0 to 4 months): Establish batch verification at the three largest plants before making any supplier decision at all. Phase 2: Phase 2 (4 to 14 months): Require monomer source disclosure from every supplier and add a fourth genuinely independent upstream chain. Phase 3: Phase 3 (14 to 24 months): Write residual verification and source disclosure into the next contract renewal rather than relying on certificates.
OUTCOME
The client established verification before removing anybody, which showed the problem was batch-level polymerisation control at one supplier rather than a systemic monomer issue. Adding a genuinely independent upstream source removed the shared-producer exposure, and residual levels have stayed within limits since verification began (client-reported, unverified by MMA).

Frequently Asked Questions

Foundational context covering the market sizes, CAGR, scope, country, region and competition that inform every finding below. This section is provided to cover basics and most often pre-purchase conversations, answered from the MMA Primary Research Dataset.

What is the current size of the Acrylamide Market?

The global acrylamide market is valued at USD 4.1 billion in 2025, covering water treatment, oilfield, paper, mining, and laboratory grades of the monomer. Polyacrylamide polymers and other acrylic monomers are excluded.

How large will the Acrylamide Market be by 2036?

The market is forecast to reach USD 7.31 billion by 2036 in the base case, about 1.69 times the 2026 level. That represents incremental value of roughly USD 2.99 billion across the decade.

What is the CAGR for the Acrylamide Market 2026 to 2036?

The market grows at a 5.4% CAGR in the base case, with bull and bear scenarios at 6.6% and 4.2%. The spread turns mainly on enhanced oil recovery activity and Chinese capacity pricing.

Which segment is growing fastest?

Water treatment grade acrylamide grows fastest at 7.8%, about 1.44 times the overall rate, on municipal capacity and sludge dewatering. Mining and mineral processing grade follows at 6.2%.

Who are the major companies in the Acrylamide Market?

Leading producers include BASF, SNF Group, Mitsubishi Chemical, Kemira, and Ecolab. Concentration is high, with the top five holding roughly 57% of acrylamide revenue across all application grades.

Which country is growing fastest?

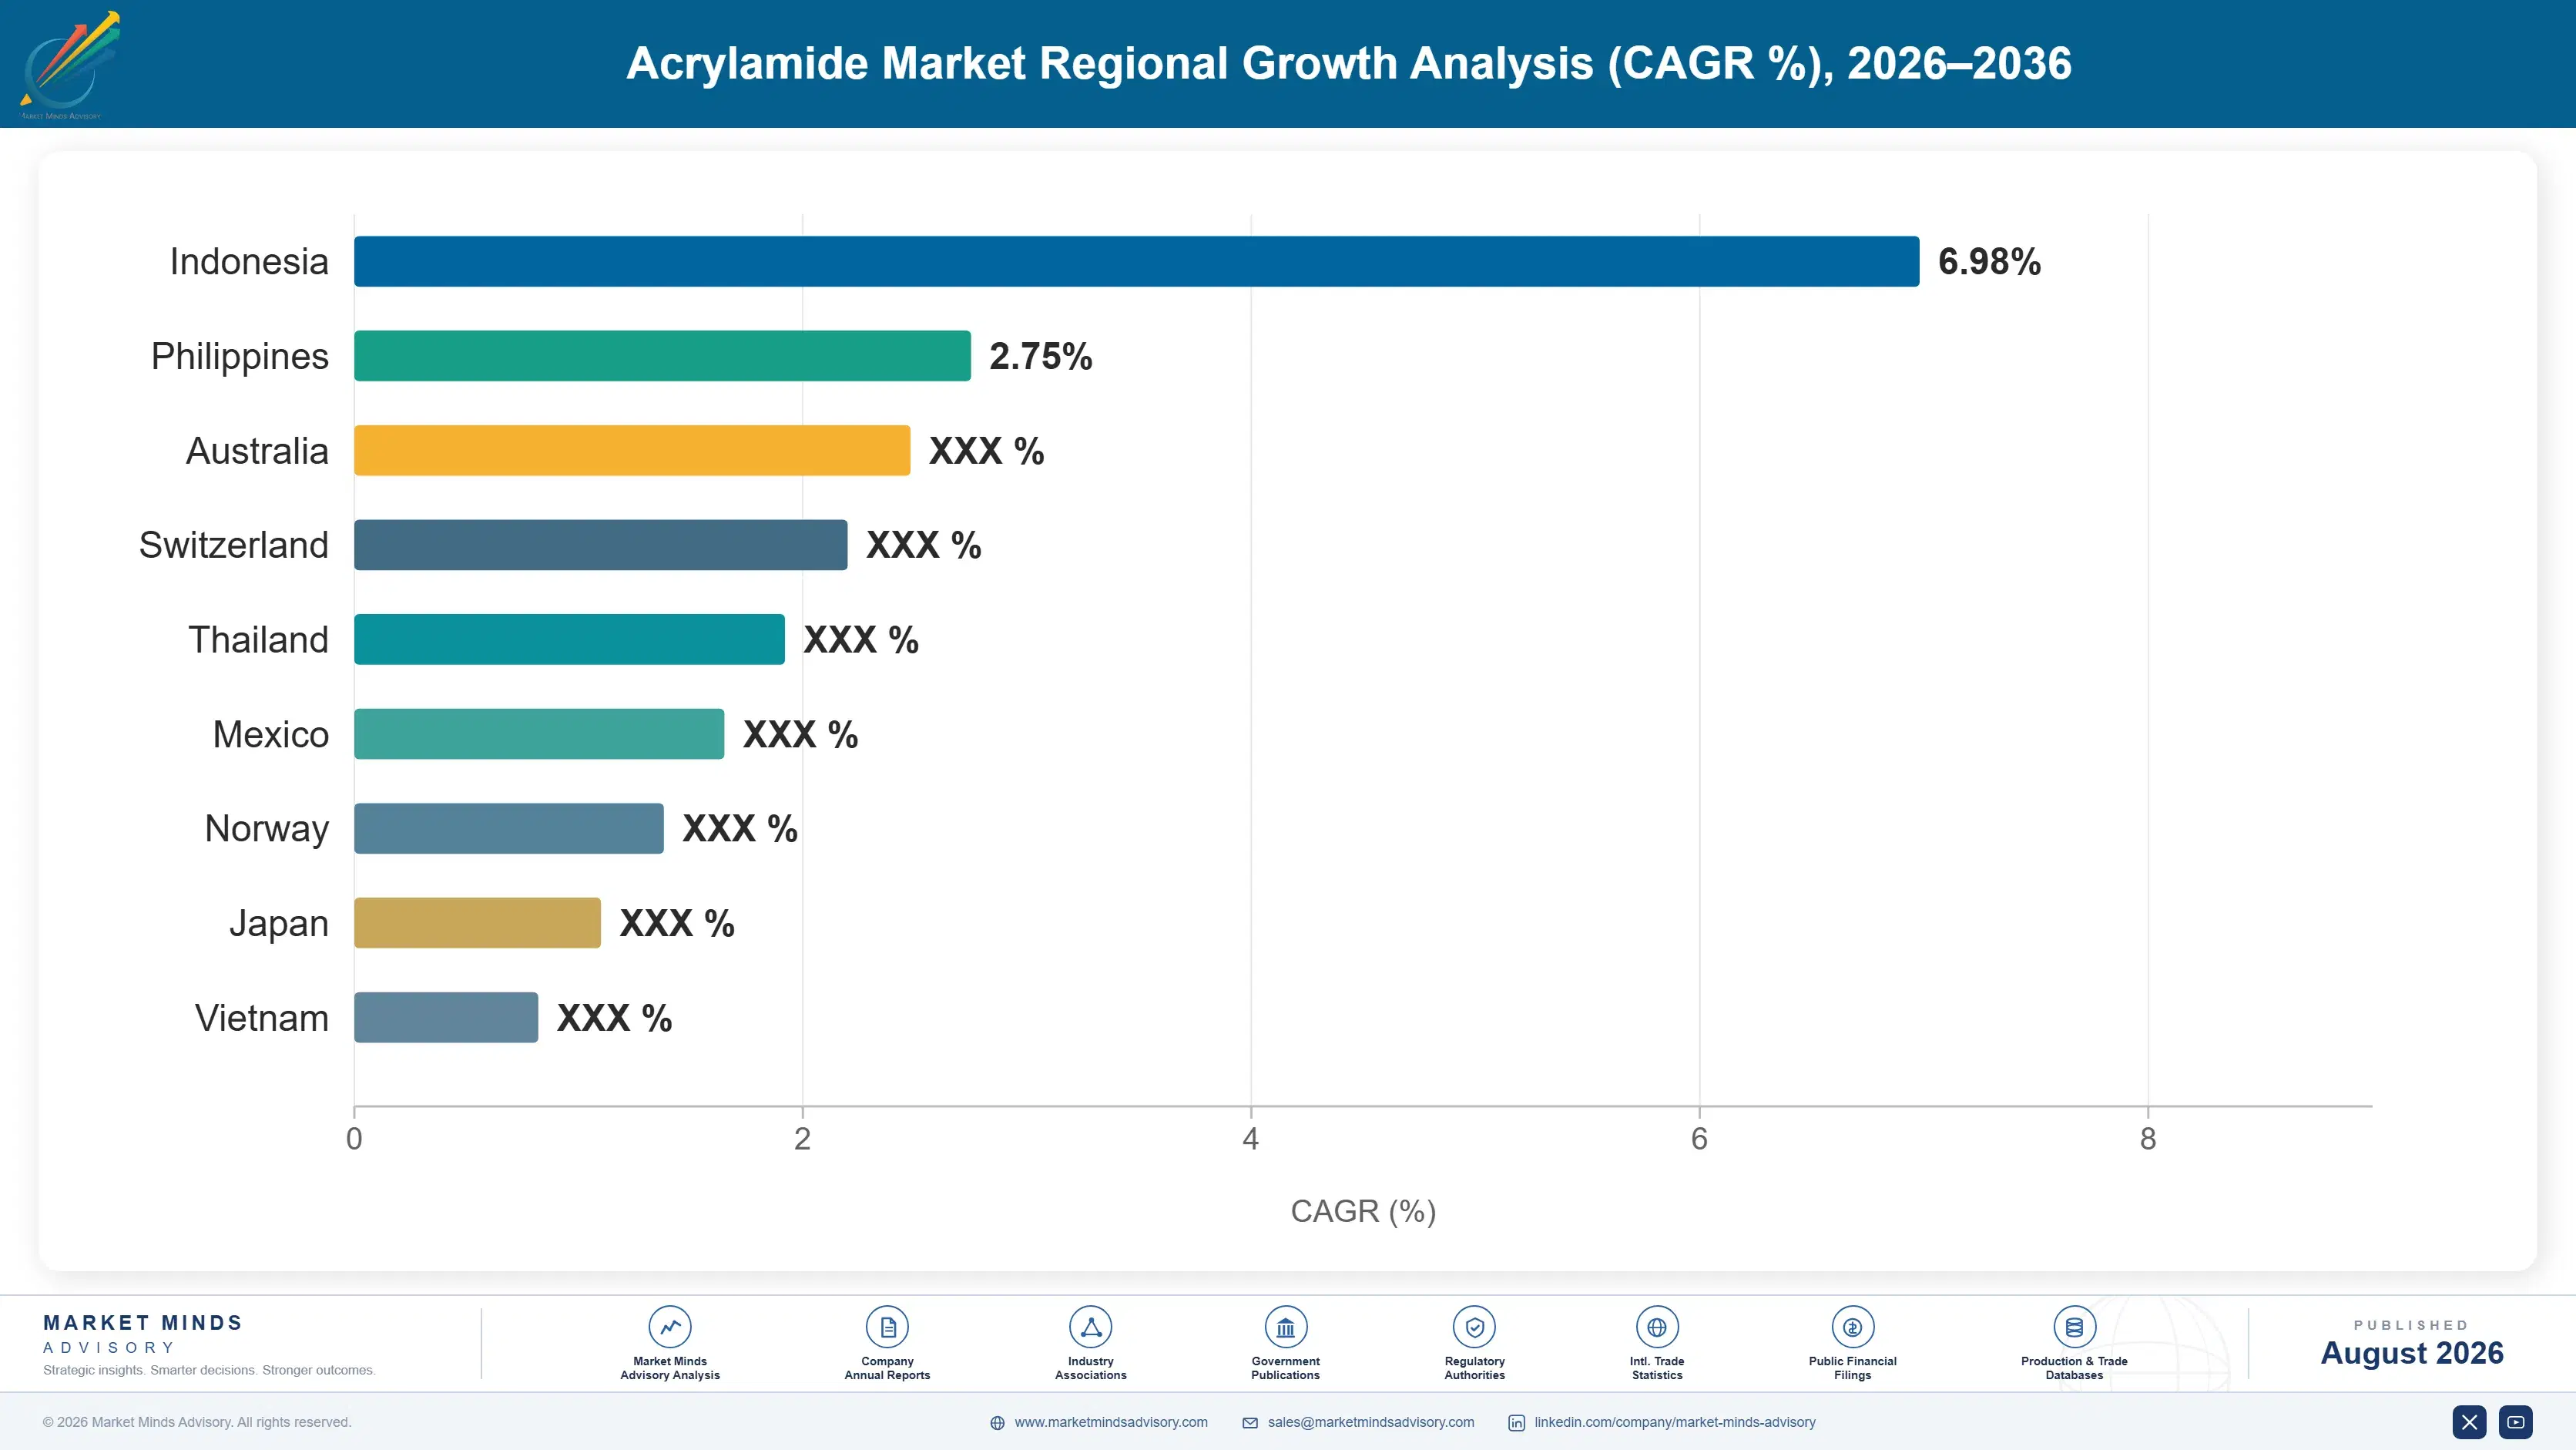
India grows fastest at a 9.2% CAGR, as municipal wastewater treatment capacity is built across cities that previously discharged untreated. China and Indonesia follow on treatment investment.

Report Segmentation Architecture

The full report scope spans multiple orthogonal segmentation dimensions, with cross-tabulated demand data provided for each dimension pair. Coverage extends further to regional breakdowns, trend trajectories, and the competitive detail needed to support segment-level decision-making.

By Application Grade

  • Water Treatment Grade Acrylamide
  • Oilfield and Enhanced Recovery Grade
  • Paper and Pulp Processing Grade
  • Mining and Mineral Processing Grade
  • Electrophoresis and Laboratory Grade

By End-Use Industry

  • Municipal Water and Wastewater Treatment
  • Oil and Gas Production
  • Mining and Mineral Processing
  • Pulp, Paper and Board Manufacturing
  • Life Science Research and Diagnostics

By Supply Form

  • Aqueous Solution Bulk Supply
  • Crystalline Solid Merchant Sale
  • Captive Internal Transfer To Polymer
  • Distributor and Trader Supply

By Region

  • North America
  • Western Europe
  • East Asia
  • South Asia and Pacific
  • Latin America
  • Middle East and Africa
  • Eastern Europe

Scope, Methodology, and Coverage

Every figure in this report is reproducible from documented input assumptions. The scope below maps the historical period, the forecast horizon, the segmentation dimensions, and the countries covered, alongside the underlying primary and qualitative methodology.
Historical Period
2020 to 2025
Forecast Period
2026 to 2036
Base Year
2025 (USD billions; MMA Primary Research Dataset, August 2026)
Market Definition
The acrylamide market comprises the production and sale of acrylamide monomer, valued at producer selling prices to polyacrylamide manufacturers, water treatment chemical formulators, oilfield service companies, and distributors, and including transfer value of captive internal production converted to polymer. It spans water treatment grade with potable approval and controlled residual monomer, oilfield and enhanced oil recovery grade, paper and pulp processing grade, mining and mineral processing grade, and electrophoresis and laboratory grade at high purity, together with the containment, handling, and residual verification documentation supplied with them. Polyacrylamide polymers, copolymers and their formulated flocculant products, other acrylic monomers including acrylic acid, acrylonitrile and methacrylamide, acrylamide formed unintentionally during food cooking or processing, flocculant blending, dosing and formulation services, and water treatment plant equipment, construction and operation are excluded.
Quantitative Units
USD billions (current prices); production volume in thousand tonnes and installed capacity
Segmentation Dimensions
By Application Grade; By End-Use Industry; By Supply Form; By Region
Regions Covered
North America, Western Europe, East Asia, South Asia and Pacific, Latin America, Middle East and Africa, Eastern Europe
Countries Covered
China, USA, Japan, Germany, France, Netherlands, UK, Italy, Spain, Finland, India, South Korea, Taiwan, Australia, Indonesia, Vietnam, Philippines, Brazil, Chile, Peru, Mexico, Argentina, UAE, Saudi Arabia, South Africa, Zambia, Poland, Czech Republic, Romania, Bulgaria, and additional markets relevant to this sector
Key Companies Profiled
BASF, SNF Group, Mitsubishi Chemical, Kemira, Ecolab, Solenis, Ashland, Arkema, Shandong Baomo Biochemical, Anhui Jucheng Fine Chemicals, Zhengzhou Tianchang, Beijing Hengju, Jiangxi Changjiu, Aoyou Chemical, Black Rose Industries, Zibo Xinye Chemical, Chinafloc, Kolon Life Science, Nitto Chemical, Diamond Chemical
Quantitative Methodology
Primary survey, n=3,800 respondents, Q4 2025, six countries; demand-side model with trade association cross-validation
Qualitative Methodology
47 expert interviews, Q4 2025; applied to validate demand model assumptions, identify emerging dynamics, and assess competitive positioning
Report Format
PDF and XLSX data workbook (Word format preview document)
Publisher
Market Minds Advisory
Report Code
MMA-2026-CHM-379
Published
August 2026
Contact
sales@marketmindsadvisory.com | www.marketmindsadvisory.com

Purchase the full Acrylamide Market Report (2026 to 2036).

The full MMA Acrylamide report sizes the market across five application grades, five end-use industries, four supply forms, and seven regions through 2036. It profiles 20 producers on a consistent basis of acrylamide monomer production and sale revenue, scoring each on potable water approval breadth, downstream polymer integration, acrylonitrile position, and containment capability. Scenario models quantify how municipal treatment investment, oil recovery activity, and Chinese capacity additions move both volume and achievable margin by grade. The report also includes potable approval mapping by producer and jurisdiction, residual monomer verification practice comparison, acrylonitrile cost pass-through analysis, and alternative flocculant dose and total cost benchmarking.
Five-grade and four-form market sizing to 2036
Twenty-producer benchmark on acrylamide monomer revenue
Potable water approval mapping by producer and jurisdiction
Residual monomer verification practice comparison across utilities
Acrylonitrile cost pass-through analysis by contract structure
Alternative flocculant dose and total cost benchmarking

Built For The People Who Decide

From boardroom strategy to bench-side execution, this report is read cover-to-cover by leaders shaping the next decade of their industry, turning demand scenarios, market dynamics and valuation benchmarks into decisions.
CXOs/ Presidents/ VPs/ Managers
M&A and Corporate Development
Strategy Teams and R&D Heads
Procurement and Product Directors
Regulatory and Compliance Leaders
Investor Relations and Equity Analysts